AMD Zen 3 Ryzen Deep Dive Review: 5950X, 5900X, 5800X and 5600X Tested
by Dr. Ian Cutress on November 5, 2020 9:01 AM ESTCPU Tests: Office and Science
Our previous set of ‘office’ benchmarks have often been a mix of science and synthetics, so this time we wanted to keep our office section purely on real world performance.
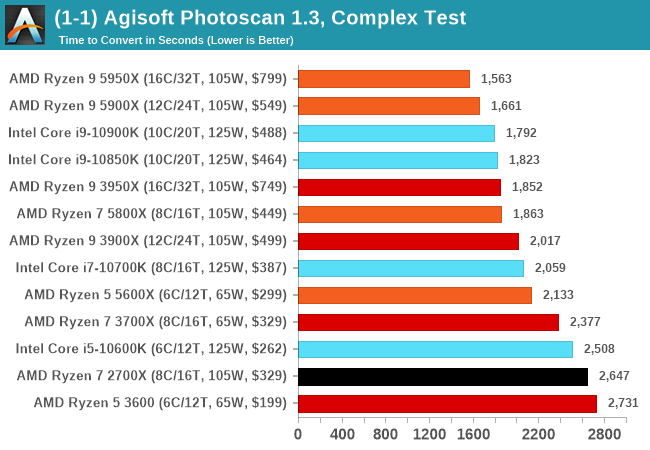
Agisoft Photoscan 1.3.3: link
The concept of Photoscan is about translating many 2D images into a 3D model - so the more detailed the images, and the more you have, the better the final 3D model in both spatial accuracy and texturing accuracy. The algorithm has four stages, with some parts of the stages being single-threaded and others multi-threaded, along with some cache/memory dependency in there as well. For some of the more variable threaded workload, features such as Speed Shift and XFR will be able to take advantage of CPU stalls or downtime, giving sizeable speedups on newer microarchitectures.
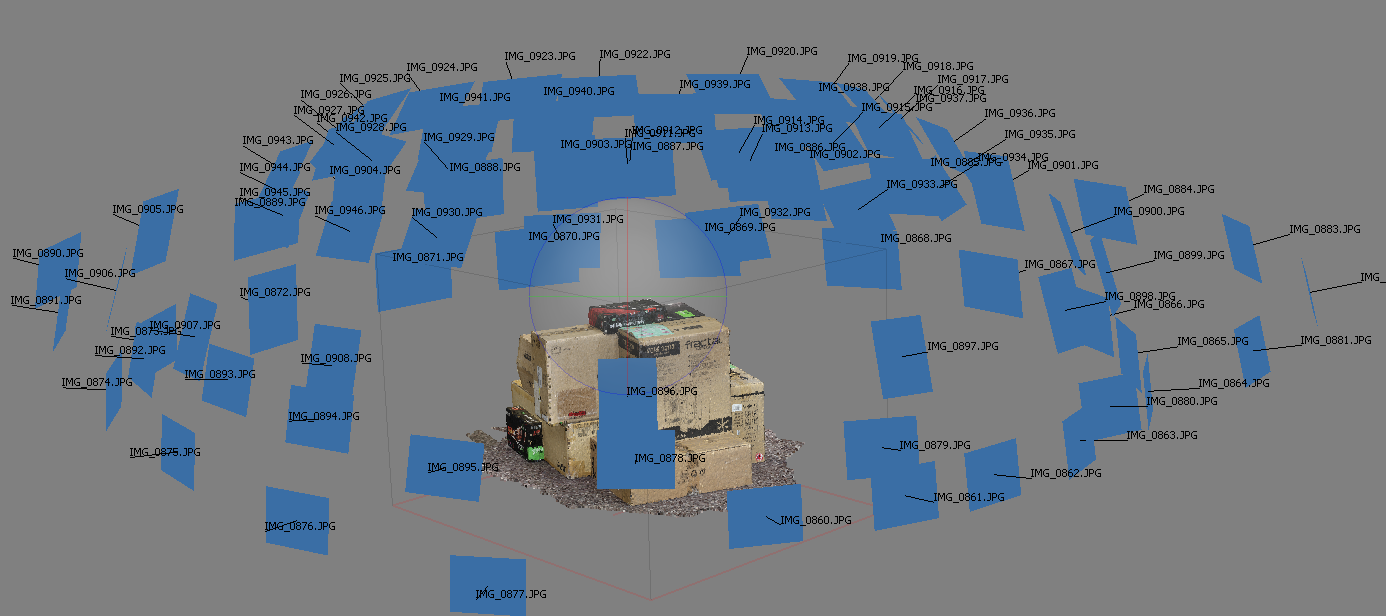
For the update to version 1.3.3, the Agisoft software now supports command line operation. Agisoft provided us with a set of new images for this version of the test, and a python script to run it. We’ve modified the script slightly by changing some quality settings for the sake of the benchmark suite length, as well as adjusting how the final timing data is recorded. The python script dumps the results file in the format of our choosing. For our test we obtain the time for each stage of the benchmark, as well as the overall time.
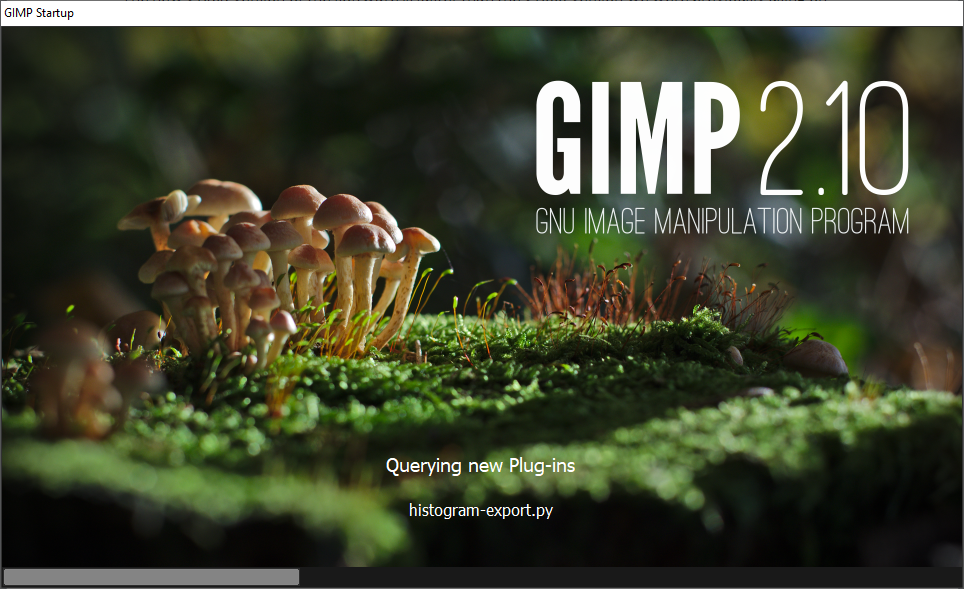
Application Opening: GIMP 2.10.18
First up is a test using a monstrous multi-layered xcf file to load GIMP. While the file is only a single ‘image’, it has so many high-quality layers embedded it was taking north of 15 seconds to open and to gain control on the mid-range notebook I was using at the time.
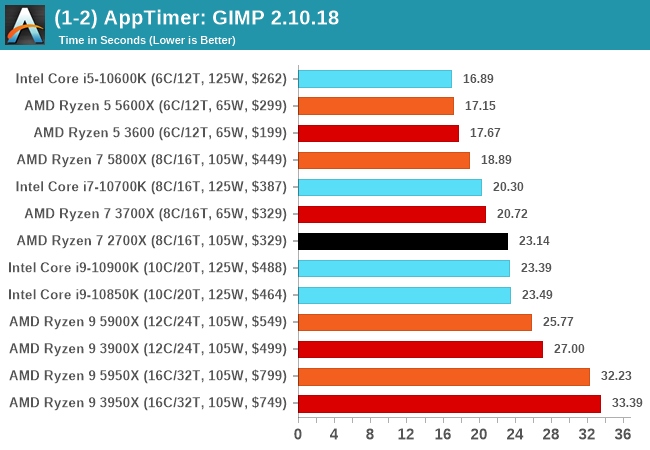
What we test here is the first run - normally on the first time a user loads the GIMP package from a fresh install, the system has to configure a few dozen files that remain optimized on subsequent opening. For our test we delete those configured optimized files in order to force a ‘fresh load’ each time the software in run. As it turns out, GIMP does optimizations for every CPU thread in the system, which requires that higher thread-count processors take a lot longer to run.
We measure the time taken from calling the software to be opened, and until the software hands itself back over to the OS for user control. The test is repeated for a minimum of ten minutes or at least 15 loops, whichever comes first, with the first three results discarded.
Science
In this version of our test suite, all the science focused tests that aren’t ‘simulation’ work are now in our science section. This includes Brownian Motion, calculating digits of Pi, molecular dynamics, and for the first time, we’re trialing an artificial intelligence benchmark, both inference and training, that works under Windows using python and TensorFlow. Where possible these benchmarks have been optimized with the latest in vector instructions, except for the AI test – we were told that while it uses Intel’s Math Kernel Libraries, they’re optimized more for Linux than for Windows, and so it gives an interesting result when unoptimized software is used.
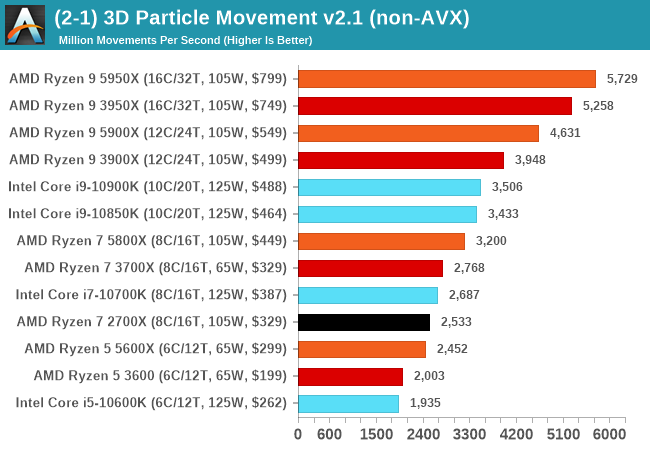
3D Particle Movement v2.1: Non-AVX and AVX2/AVX512
This is the latest version of this benchmark designed to simulate semi-optimized scientific algorithms taken directly from my doctorate thesis. This involves randomly moving particles in a 3D space using a set of algorithms that define random movement. Version 2.1 improves over 2.0 by passing the main particle structs by reference rather than by value, and decreasing the amount of double->float->double recasts the compiler was adding in.
The initial version of v2.1 is a custom C++ binary of my own code, and flags are in place to allow for multiple loops of the code with a custom benchmark length. By default this version runs six times and outputs the average score to the console, which we capture with a redirection operator that writes to file.
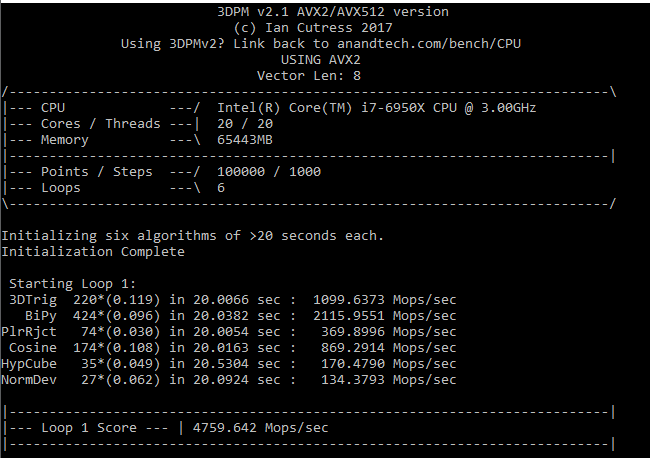
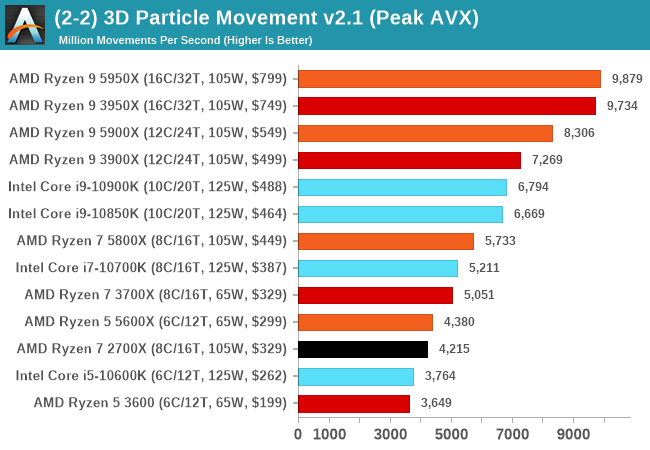
For v2.1, we also have a fully optimized AVX2/AVX512 version, which uses intrinsics to get the best performance out of the software. This was done by a former Intel AVX-512 engineer who now works elsewhere. According to Jim Keller, there are only a couple dozen or so people who understand how to extract the best performance out of a CPU, and this guy is one of them. To keep things honest, AMD also has a copy of the code, but has not proposed any changes.
The 3DPM test is set to output millions of movements per second, rather than time to complete a fixed number of movements.
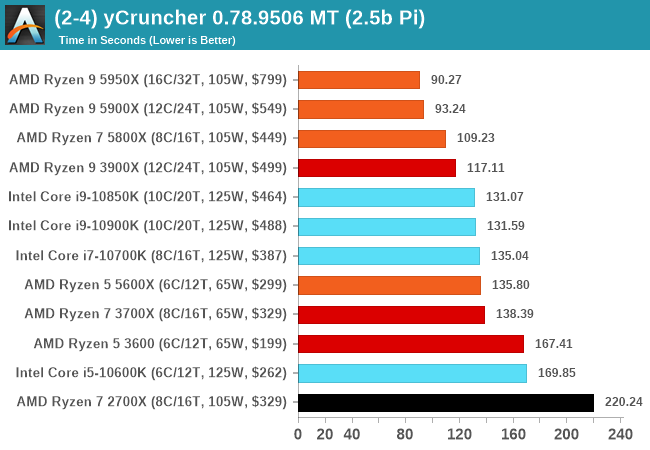
y-Cruncher 0.78.9506: www.numberworld.org/y-cruncher
If you ask anyone what sort of computer holds the world record for calculating the most digits of pi, I can guarantee that a good portion of those answers might point to some colossus super computer built into a mountain by a super-villain. Fortunately nothing could be further from the truth – the computer with the record is a quad socket Ivy Bridge server with 300 TB of storage. The software that was run to get that was y-cruncher.
Built by Alex Yee over the last part of a decade and some more, y-Cruncher is the software of choice for calculating billions and trillions of digits of the most popular mathematical constants. The software has held the world record for Pi since August 2010, and has broken the record a total of 7 times since. It also holds records for e, the Golden Ratio, and others. According to Alex, the program runs around 500,000 lines of code, and he has multiple binaries each optimized for different families of processors, such as Zen, Ice Lake, Sky Lake, all the way back to Nehalem, using the latest SSE/AVX2/AVX512 instructions where they fit in, and then further optimized for how each core is built.
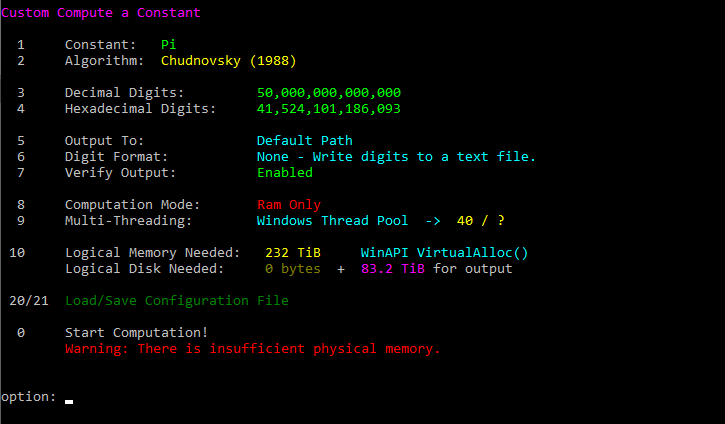
For our purposes, we’re calculating Pi, as it is more compute bound than memory bound. In multithreaded mode we go for 2.5 billion digits. That 2.5 billion digit value requires ~12 GB of DRAM, and so is limited to systems with at least 16 GB.
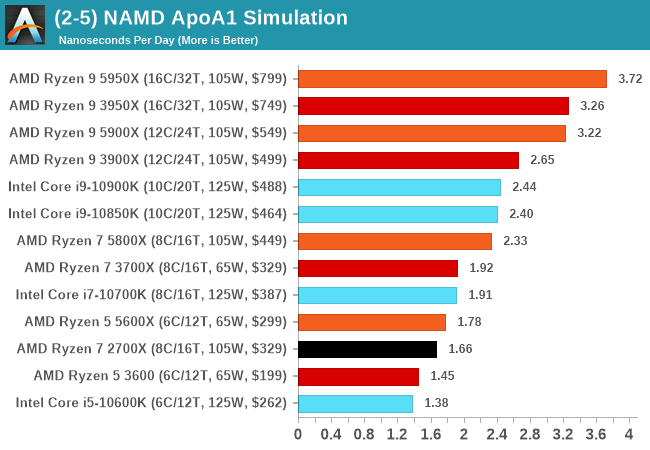
NAMD 2.13 (ApoA1): Molecular Dynamics
One of the popular science fields is modeling the dynamics of proteins. By looking at how the energy of active sites within a large protein structure over time, scientists behind the research can calculate required activation energies for potential interactions. This becomes very important in drug discovery. Molecular dynamics also plays a large role in protein folding, and in understanding what happens when proteins misfold, and what can be done to prevent it. Two of the most popular molecular dynamics packages in use today are NAMD and GROMACS.
NAMD, or Nanoscale Molecular Dynamics, has already been used in extensive Coronavirus research on the Frontier supercomputer. Typical simulations using the package are measured in how many nanoseconds per day can be calculated with the given hardware, and the ApoA1 protein (92,224 atoms) has been the standard model for molecular dynamics simulation.
Luckily the compute can home in on a typical ‘nanoseconds-per-day’ rate after only 60 seconds of simulation, however we stretch that out to 10 minutes to take a more sustained value, as by that time most turbo limits should be surpassed. The simulation itself works with 2 femtosecond timesteps. We use version 2.13 as this was the recommended version at the time of integrating this benchmark into our suite. The latest nightly builds we’re aware have started to enable support for AVX-512, however due to consistency in our benchmark suite, we are retaining with 2.13. Other software that we test with has AVX-512 acceleration.
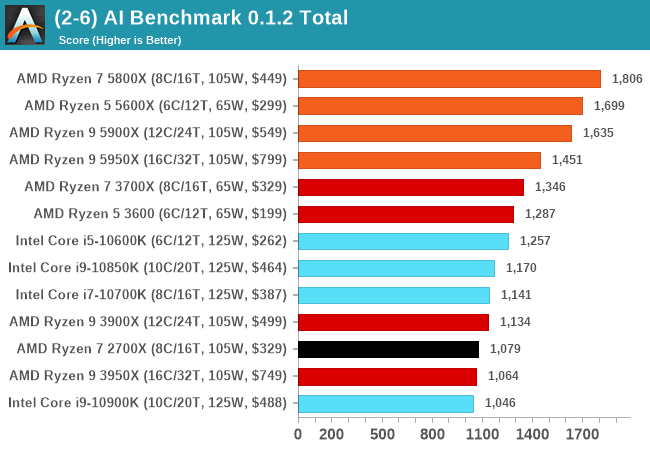
AI Benchmark 0.1.2 using TensorFlow: Link
Finding an appropriate artificial intelligence benchmark for Windows has been a holy grail of mine for quite a while. The problem is that AI is such a fast moving, fast paced word that whatever I compute this quarter will no longer be relevant in the next, and one of the key metrics in this benchmarking suite is being able to keep data over a long period of time. We’ve had AI benchmarks on smartphones for a while, given that smartphones are a better target for AI workloads, but it also makes some sense that everything on PC is geared towards Linux as well.
Thankfully however, the good folks over at ETH Zurich in Switzerland have converted their smartphone AI benchmark into something that’s useable in Windows. It uses TensorFlow, and for our benchmark purposes we’ve locked our testing down to TensorFlow 2.10, AI Benchmark 0.1.2, while using Python 3.7.6.

The benchmark runs through 19 different networks including MobileNet-V2, ResNet-V2, VGG-19 Super-Res, NVIDIA-SPADE, PSPNet, DeepLab, Pixel-RNN, and GNMT-Translation. All the tests probe both the inference and the training at various input sizes and batch sizes, except the translation that only does inference. It measures the time taken to do a given amount of work, and spits out a value at the end.
There is one big caveat for all of this, however. Speaking with the folks over at ETH, they use Intel’s Math Kernel Libraries (MKL) for Windows, and they’re seeing some incredible drawbacks. I was told that MKL for Windows doesn’t play well with multiple threads, and as a result any Windows results are going to perform a lot worse than Linux results. On top of that, after a given number of threads (~16), MKL kind of gives up and performance drops of quite substantially.
So why test it at all? Firstly, because we need an AI benchmark, and a bad one is still better than not having one at all. Secondly, if MKL on Windows is the problem, then by publicizing the test, it might just put a boot somewhere for MKL to get fixed. To that end, we’ll stay with the benchmark as long as it remains feasible.


339 Comments
View All Comments
TheinsanegamerN - Tuesday, November 10, 2020 - link
However AMD's boost algorithim is very temperature sensitive. Those coolers may work fine, but if they get to the 70C range you're losing max performance to higher temperatures.Andrew LB - Sunday, December 13, 2020 - link
Blah blah....Ryzen 5800x @ 3.6-4.7ghz : 219w and 82'c.
Ryzen 5800x @ 4.7ghz locked: 231w and 88'c.
Fractal Celsius+ S28 Prisma 280mm AIO CPU cooler at full fan and pump speed
https://www.kitguru.net/components/cpu/luke-hill/a...
If you actually set your voltages on Intel chips they stay cool. My i7-10700k @ 5.0ghz all-core locked never goes above 70'c.
Count Rushmore - Friday, November 6, 2020 - link
It took 3 days... finally the article load-up.AT seriously need to upgrade their server (or I need to stop using IE6).
name99 - Friday, November 6, 2020 - link
"AMD wouldn’t exactly detail what this means but we suspect that this could allude to now two branch predictions per cycle instead of just one"So imagine you have wide OoO CPU. How do you design fetch? The current state of the art (and presumably AMD have aspects of this, though perhaps not the *entire* package) goes as follows:
Instructions come as runs of sequential instructions separated by branches. At a branch you may HAVE to fetch instructions from a new address (think call, goto, return) or you may perhaps continue to the next address (think non-taken branch).
So an intermediate complexity fetch engine will bring in blobs of instructions, up to (say 6 or 8) with the run of instructions terminating at
- I've scooped up N or
- I've hit a branch or
- I've hit the end of a cache line.
Basically every cycle should consist of pulling in the longest run of instructions possible subject to the above rules.
The way really advanced fetch works is totally decoupled from the rest of the CPU. Every cycle the fetch engine predicts the next fetch address (from some hierarchy of : check the link stack, check the BTB, increment the PC), and fetches as much as possible from that address. These are stuck in a queue connected to decode, and ideally that queue would never run dry.
BUT: on average there is about a branch every 6 instructions.
Now supposed you want to sustain, let's say, 8-wide. That means that you might set N at 8, but most of the time you'll fetch 6 or so instructions because you'll bail out based on hitting a branch before you have a full 8 instructions in your scoop. So you're mostly unable to go beyond an IPC of 6, even if *everything* else is ideal.
BUT most branches are conditional. And good enough half of those are not taken. This means that if you can generate TWO branch predictions per cycle then much of the time the first branch will not be taken, can be ignored, and fetch can continue in a straight line past it. Big win! Half the time you can pull in only 6 instructions, but the other half you could pull in maybe 12 instructions. Basically, if you want to sustain 8 wide, you'd probably want to pull in at least 10 or 12 instructions under best case conditions, to help fill up the queue for the cases where you pull in less than 8 instructions (first branch is taken, or you reach the end of the cache line).
Now there are some technicalities here.
One is "how does fetch know where the branches are, to know when to stop fetching". This is usually done via pre-decode bits living in the I-cache, and set by a kinda decode when the line is first pulled into the I-cache. (I think x86 also does this, but I have no idea how. It's obviously much easier for a sane ISA like ARM, POWER, even z.)
Second, and more interesting, is that you're actually performing two DIFFERENT TYPES of prediction, which makes it somewhat easier from a bandwidth point of view. The prediction on the first branch is purely "taken/not taken", and all you care about is "not taken"; the prediction on the second branch is more sophisticated because if you predict taken you also have to predict the target, which means dealing BTB or link stack.
But you don't have to predict TWO DIFFERENT "next fetch addresses" per cycle, which makes it somewhat easier.
Note also that any CPU that uses two level branch prediction is, I think, already doing two branch prediction per cycle, even if it doesn't look like it. Think about it: how do you USE a large (but slow) second level pool of branch prediction information?
You run the async fetch engine primarily from the first level; and this gives a constant stream of "runs of instructions, separated by branches" with zero delay cycles between runs. Great, zero cycle branches, we all want that. BUT for the predictors to generate a new result in a single cycle they can't be too large.
So you also run a separate engine, delayed a cycle or two, based on the larger pool of second level branch data, checking the predictions of the async engine. If there's a disagreement you flush whatever was fetched past that point (which hopefully is still just in the fetch queue...) and resteer. This will give you a one (or three or four) cycle bubble in the fetch stream, which is not ideal, but
- it doesn't happen that often
- it's a lot better catching a bad prediction very early in fetch, rather than much later in execution
- hopefully the fetch queue is full enough, and filled fast enough, that perhaps it's not even drained by the time decode has walked along it to the point at which the re-steer occurred...
This second (checking) branch prediction doesn't ever get mentioned, but it is there behind the scenes, even when the CPU is ostensibly doing only a single prediction per cycle.
There are other crazy things that happen in modern fetch engines (which are basically in themselves as complicated as a whole CPU from 20 years ago).
One interesting idea is to use the same data that is informing the async fetch engine to inform prefetch. The idea is that you now have essentially two fetch engines running. One is as I described above; the second ONLY cares about the stream of TAKEN branches, and follows that stream as rapidly as possible, ensuring that each line referenced by this stream is being pulled into the I-cache. (You will recognize this as something like a very specialized form of run-ahead.)
In principle this should be perfect -- the I prefetcher and branch-prediction are both trying to solve the *exact* same problem, so pooling their resources should be optimal! In practice, so far this hasn't yet been perfected; the best simulations using this idea are a very few percent behind the best simulations using a different I prefetch technology. But IMHO this is mostly a consequence of this being a fairly new idea that has so far been explored mainly by using pre-existing branch predictors, rather than designing a branch predictor store that's optimal for both tasks.
The main difference is that what matters for prefetching is "far future" branches, branches somewhat beyond where I am now, so that there's plenty of time to pull in the line all the way from RAM. And existing branch predictors have had no incentive to hold onto that sort of far future prediction state. HOWEVER
A second interesting idea is what IBM has been doing for two or three years now. They store branch prediction in what they call an L2 storage but, to avoid things, I'll cal a cold cache. This is stale/far future branch prediction data that is unused for a while but, on triggering events, that cold cache data will be swapped into the branch prediction storage so that the branch predictors are ready to go for the new context in which they find themselves.
I don't believe IBM use this to drive their I-prefetcher, but obviously it is a great solution to the problem I described above and I suspect this will be where all the performance CPUs eventually find themselves over the next few years. (Apple and IBM probably first, because Apple is Apple, and IBM has the hard part of the solution already in place; then ARM because they's smart and trying hard; then AMD because they're also smart but their technology cycles are slower than ARM; and final Intel because, well, they're Intel and have been running on fumes for a few years now.)
(Note of course this only solves I-prefetch, which is nice and important; but D-prefetch remains as a difficult and different problem.)
name99 - Friday, November 6, 2020 - link
Oh, one more thing. I referred to "width" of the CPU above. This becomes an ever vaguer term every year. The basic points are two:- when OoO started, it seemed reasonable to scale every step of the pipeline together. Make the CPU 4-wide. So it can fetch up to 4 instructions/cycle. decode up to 4, issue up to 4, retire up to 4. BUT if you do this you're losing performance every step of the way. Every cycle that fetches only 3 instructions can never make that up; likewise every cycle that only issues 3 instructions.
- so once you have enough transistors available for better designs, you need to ask yourself what's the RATE-LIMITING step? For x86 that's probably in fetch and decode, but let's consider sane ISAs like ARM. There the rate limiting step is probably register rename. So lets assume your max rename bandwidth is 6 instructions/cycle. You actually want to run the rest of your machinery at something like 7 or 8 wide because (by definition) you CAN do so (they are not rate limiting, so they can be grown). And by running them wider you can ensure that the inevitable hiccups along the way are mostly hidden by queues, and your rename machinery is running at full speed, 6-wide each and every cycle, rather than frequently running at 5 or 4 wide because of some unfortunate glitch upstream.
Spunjji - Monday, November 9, 2020 - link
These were interesting posts. Thank you!GeoffreyA - Monday, November 9, 2020 - link
Yes, excellent posts. Thanks.Touching on width, I was expecting Zen 3 to add another decoder and take it up to 5-wide decode (like Skylake onwards). Zen 3's keeping it at 4 makes good sense though, considering their constraint of not raising power. Another decoder might have raised IPC but would have likely picked up power quite a bit.
ignizkrizalid - Saturday, November 7, 2020 - link
Rip Intel no matter how hard you try squeezing Intel sometimes on top within your graphics! stupid site bias and unreliable if this site was to be truth why not do a live video comparison side by side using 3600 or 4000Mhz ram so we can see the actual numbers and be 100% assured the graphic table is not manipulated in any way, yea I know you will never do it! personally I don't trust these "reviews" that can be manipulated as desired, I respect live video comparison with nothing to hide to the public. Rip Intel Rip Intel.Spunjji - Monday, November 9, 2020 - link
I... don't think this makes an awful lots of sense, tbh.MDD1963 - Saturday, November 7, 2020 - link
It would be interesting to also see the various results of the 10900K the way most people actually run them on Z490 boards, i.e, with higher RAM clocks, MCE enabled, etc...; do the equivalent tuning with 5000 series, I'm sure they will run with faster than DDR4-3200 MHz. plus perhaps a small all-core overclock.