AMD Zen 3 Ryzen Deep Dive Review: 5950X, 5900X, 5800X and 5600X Tested
by Dr. Ian Cutress on November 5, 2020 9:01 AM ESTTest Setup and #CPUOverload Benchmarks
As per our processor testing policy, we take a premium category motherboard suitable for the socket, and equip the system with a suitable amount of memory running at the manufacturer's maximum supported frequency. This is also typically run at JEDEC subtimings where possible. It is noted that some users are not keen on this policy, stating that sometimes the maximum supported frequency is quite low, or faster memory is available at a similar price, or that the JEDEC speeds can be prohibitive for performance. While these comments make sense, ultimately very few users apply memory profiles (either XMP or other) as they require interaction with the BIOS, and most users will fall back on JEDEC supported speeds - this includes home users as well as industry who might want to shave off a cent or two from the cost or stay within the margins set by the manufacturer. Where possible, we will extend out testing to include faster memory modules either at the same time as the review or a later date.
| AnandTech | Example Processors |
Motherboard | DRAM | PSU | SSD |
| AMD | |||||
| Zen 3 CPU | Ryzen 9 5950X | MSI X570 Godlike (1.B3T13) |
Corsair RGB Dominator Pro 32 GB DDR4-3200 |
OCZ Gold 1250W |
Crucial MX500 2 TB |
| Ryzen 9 5900X | |||||
| Ryzen 7 5800X | |||||
| Ryzen 5 5600X | |||||
| Zen 2 CPU | Ryzen 9 3950X | GIGABYTE X570 Aorus I Pro (F30a) |
ADATA 32 GB DDR4-3200 |
Corsair AX860i |
Crucial MX500 2 TB |
| Ryzen 9 3900X | |||||
| Ryzen 7 3800XT | |||||
| Ryzen 7 3700X | |||||
| Ryzen 5 3600 | |||||
| Zen+ CPU | Ryzen 7 2700X | GIGABYTE X570 Aorus I Pro (F30a) |
ADATA 32 GB DDR4-3200 |
Corsair AX860i |
Crucial MX500 2 TB |
| Intel | |||||
| Comet Lake CPU |
Core i9-10900K | ASRock Z490 PG Velocia |
Corsair RGB Dominator Pro 32 GB DDR4-2933 |
OCZ Gold 1250 W |
Crucial MX500 2 TB |
| Core i9-10850K | |||||
| Core i7-10700K | |||||
| Core i5-10600K | |||||
Many thanks to...
We must thank the following companies for kindly providing hardware for our multiple test beds. Some of this hardware is not in this test bed specifically, but is used in other testing.
| Hardware Providers for CPU and Motherboard Reviews | |||
| Sapphire RX 460 Nitro |
NVIDIA RTX 2080 Ti |
Crucial SSDs | Corsair PSUs |
 |
 |
 |
 |
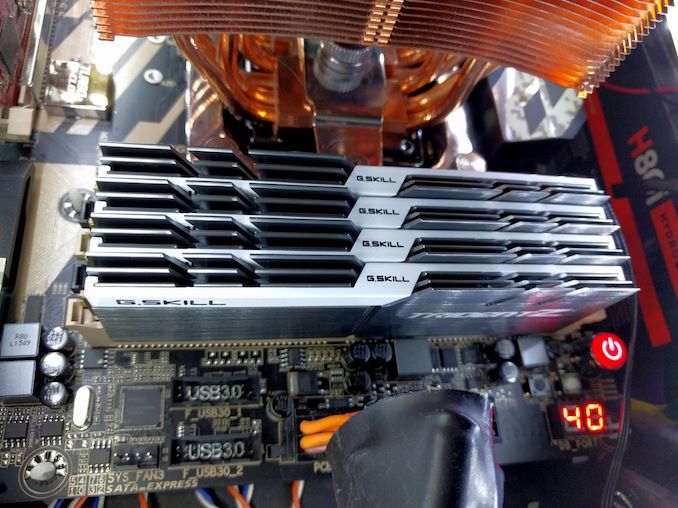
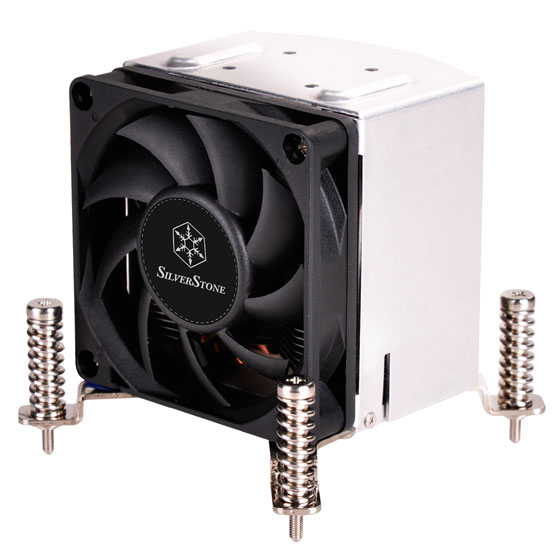
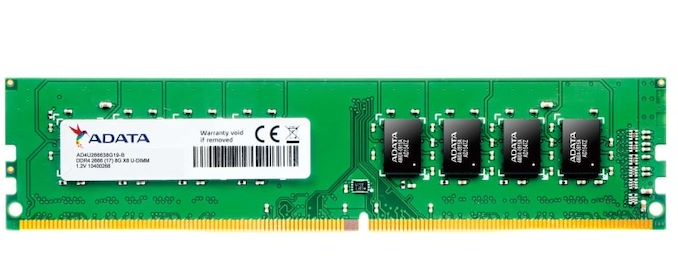
| G.Skill DDR4 | ADATA DDR4 | Silverstone Coolers |
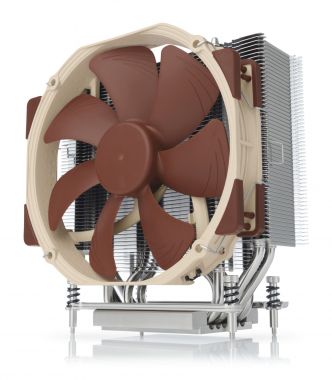
Noctua Coolers |
 |
|
 |
 |
-
The 2020 #CPUOverload Suite
Our CPU tests go through a number of main areas. We cover Web tests using our un-updateable version of Chromium, opening tricky PDFs, emulation, brain simulation, AI, 2D image to 3D model conversion, rendering (ray tracing, modeling), encoding (compression, AES, video and HEVC), office based tests, and our legacy tests (throwbacks from another generation of code but interesting to compare).
The Win10 Pro operating system is prepared in advance, and we run a number of registry edit commands again to ensure that various system features are turned off and disabled at the start of the benchmark suite. This includes disabling Cortana, disabling the GameDVR functionality, disabling Windows Error Reporting, disabling Windows Defender as much as possible again, disabling updates, and re-implementing power options and removing OneDrive, in-case it sprouted wings again.
A number of these tests have been requested by our readers, and we’ve split our tests into a few more categories than normal as our readers have been requesting specific focal tests for their workloads. A recent run on a Core i5-10600K, just for the CPU tests alone, took around 20 hours to complete.
Power
- Peak Power (y-Cruncher using latest AVX)
- Per-Core Loading Power using POV-Ray
Office
- Agisoft Photoscan 1.3: 2D to 3D Conversion
- Application Loading Time: GIMP 2.10.18 from a fresh install
- Compile Testing (WIP)
Science
- 3D Particle Movement v2.1 (Non-AVX + AVX2/AVX512)
- y-Cruncher 0.78.9506 (Optimized Binary Splitting Compute for mathematical constants)
- NAMD 2.13: Nanoscale Molecular Dynamics on ApoA1 protein
- AI Benchmark 0.1.2 using TensorFlow (unoptimized for Windows)
Simulation
- Digicortex 1.35: Brain stimulation simulation
- Dwarf Fortress 0.44.12: Fantasy world creation and time passage
- Dolphin 5.0: Ray Tracing rendering test for Wii emulator
Rendering
- Blender 2.83 LTS: Popular rendering program, using PartyTug frame render
- Corona 1.3: Ray Tracing Benchmark
- Crysis CPU-Only: Can it run Crysis? What, on just the CPU at 1080p? Sure
- POV-Ray 3.7.1: Another Ray Tracing Test
- V-Ray: Another popular renderer
- CineBench R20: Cinema4D Rendering engine
Encoding
- Handbrake 1.32: Popular Transcoding tool
- 7-Zip: Open source compression software
- AES Encoding: Instruction accelerated encoding
- WinRAR 5.90: Popular compression tool
Legacy
- CineBench R10
- CineBench R11.5
- CineBench R15
- 3DPM v1: Naïve version of 3DPM v2.1 with no acceleration
- X264 HD3.0: Vintage transcoding benchmark
Web
- Kraken 1.1: Depreciated web test with no successor
- Octane 2.0: More comprehensive test (but also deprecated with no successor)
- Speedometer 2: List-based web-test with different frameworks
Synthetic
- GeekBench 4 and GeekBench 5
- AIDA Memory Bandwidth
- Linux OpenSSL Speed (rsa2048 sign/verify, sha256, md5)
- LinX 0.9.5 LINPACK (where appropriate)
SPEC (Estimated)
- SPEC2006 rate-1T
- SPEC2017 rate-1T
- SPEC2017 rate-nT
It should be noted that due to the terms of the SPEC license, because our benchmark results are not vetted directly by the SPEC consortium, we have to label them as ‘estimated’. The benchmark is still run and we get results out, but those results have to have the ‘estimated’ label.
Others
- A full x86 instruction throughput/latency analysis
- Core-to-Core Latency
- Cache-to-DRAM Latency
- Frequency Ramping
Some of these tests also have AIDA power wrappers around them in order to provide an insight in the way the power is reported through the test.
2020 CPU Gaming (GPU) Benchmarks
In the past, we’ve tackled the GPU benchmark set in several different ways. We’ve had one GPU to multiple games at one resolution, or multiple GPUs take a few games at one resolution, then as the automation progressed into something better, multiple GPUs take a few games at several resolutions. However, based on feedback, having the best GPU we can get hold of over a dozen games at several resolutions seems to be the best bet.
Normally securing GPUs for this testing is difficult, as we need several identical models for concurrent testing, and very rarely is a GPU manufacturer, or one of its OEM partners, happy to hand me 3-4+ of the latest and greatest. In that aspect, over the years, I have to thank ECS for sending us four GTX 580s in 2012, MSI for sending us three GTX 770 Lightnings in 2014, Sapphire for sending us multiple RX 480s and R9 Fury X cards in 2016, and in our last test suite, MSI for sending us three GTX 1080 Gaming cards in 2018.
For our testing on the 2020 suite, we have secured three RTX 2080 Ti GPUs direct from NVIDIA. These GPUs have been optimized for with drivers and in gaming titles, and given how rare our updates are, we are thankful for getting the high-end hardware. (It’s worth noting we won’t be updating to whatever RTX 3080 variant is coming out at some point for a while yet.)
On the topic of resolutions, this is something that has been hit and miss for us in the past. Some users state that they want to see the lowest resolution and lowest fidelity options, because this puts the most strain on the CPU, such as a 480p Ultra Low setting. In the past we have found this unrealistic for all use cases, and even if it does give the best shot for a difference in results, the actual point where you come GPU limited might be at a higher resolution. In our last test suite, we went from the 720p Ultra Low up to 1080p Medium, 1440p High, and 4K Ultra settings. However, our most vocal readers hated it, because even by 1080p medium, we were GPU limited for the most part.
So to that end, the benchmarks this time round attempt to follow the basic pattern where possible:
- Lowest Resolution with lowest scaling, Lowest Settings
- 2560x1440 with the lowest settings (1080p where not possible)
- 3840x2160 with the lowest settings
- 1920x1080 at the maximum settings
Point (1) should give the ultimate CPU limited scenario. We should see that lift as we move up through (2) 1440p and (3) 4K, with 4K low still being quite strenuous in some titles.
Point (4) is essentially our ‘real world’ test. The RTX 2080 Ti is overkill for 1080p Maximum, and we’ll see that most modern CPUs pull well over 60 FPS average in this scenario.
What will be interesting is that for some titles, 4K Low is more compute heavy than 1080p Maximum, and for other titles that relationship is reversed.
For integrated graphics testing, we use the (1) and (4) settings to see where the GPU lies with respect to CPU performance (1) as well as test to confirm just how close integrated graphics is to proper 1080p gaming (4).
So we have the following benchmarks as part of our script, automated to the point of a one-button run and out pops the results approximately 10 hours later, per GPU. Also listed are the resolutions and settings used.
Offline Games
- Chernobylite, 360p Low, 1440p Low, 4K Low, 1080p Max
- Civilization 6, 480p Low, 1440p Low, 4K Low, 1080p Max
- Deus Ex: Mankind Divided, 600p Low, 1440p Low, 4K Low, 1080p Max
- Final Fantasy XIV: 768p Min, 1440p Min, 4K Min, 1080p Max
- Final Fantasy XV: 720p Standard, 1080p Standard, 4K Standard, 8K Standard
- World of Tanks: 768p Min, 1080p Standard, 1080p Max, 4K Max
Online Games
- Borderlands 3, 360p VLow, 1440p VLow, 4K VLow, 1080p Badass
- F1 2019, 768p ULow, 1440p ULow, 4K ULow, 1080p Ultra
- Far Cry 5, 720p Low, 1440p Low, 4K Low, 1080p Ultra
- Gears Tactics, 720p Low, 4K Low, 8K Low 1080p Ultra
- Grand Theft Auto 5, 720p Low, 1440p Low, 4K Low, 1080p Max
- Red Dead Redemption 2, 384p Min, 1440p Min, 8K Min, 1080p Max
- Strange Brigade DX12, 720p Low, 1440p Low, 4K Low, 1080p Ultra
- Strange Brigade Vulkan, 720p Low, 1440p Low, 4K Low, 1080p Ultra
For each of the games in our testing, we take the frame times where we can (the two that we cannot are Chernobylite and FFXIV). For these games, at each resolution/setting combination, we run them for as many loops in a given time limit (often 10 minutes per resolution). Results are then taken as average frame rates and 95th percentiles.
If there are any game developers out there involved with any of the benchmarks above, please get in touch at ian@anandtech.com. I have a list of requests to make benchmarking your title easier! I have a literal document I’ve compiled showing what would be ideal, best practices, who gets it correct and who gets it wrong, etc.
The other angle is DRM, and some titles have limits of 5 systems per day. This may limit our testing in some cases; in other cases it is solvable.


339 Comments
View All Comments
TheinsanegamerN - Tuesday, November 10, 2020 - link
However AMD's boost algorithim is very temperature sensitive. Those coolers may work fine, but if they get to the 70C range you're losing max performance to higher temperatures.Andrew LB - Sunday, December 13, 2020 - link
Blah blah....Ryzen 5800x @ 3.6-4.7ghz : 219w and 82'c.
Ryzen 5800x @ 4.7ghz locked: 231w and 88'c.
Fractal Celsius+ S28 Prisma 280mm AIO CPU cooler at full fan and pump speed
https://www.kitguru.net/components/cpu/luke-hill/a...
If you actually set your voltages on Intel chips they stay cool. My i7-10700k @ 5.0ghz all-core locked never goes above 70'c.
Count Rushmore - Friday, November 6, 2020 - link
It took 3 days... finally the article load-up.AT seriously need to upgrade their server (or I need to stop using IE6).
name99 - Friday, November 6, 2020 - link
"AMD wouldn’t exactly detail what this means but we suspect that this could allude to now two branch predictions per cycle instead of just one"So imagine you have wide OoO CPU. How do you design fetch? The current state of the art (and presumably AMD have aspects of this, though perhaps not the *entire* package) goes as follows:
Instructions come as runs of sequential instructions separated by branches. At a branch you may HAVE to fetch instructions from a new address (think call, goto, return) or you may perhaps continue to the next address (think non-taken branch).
So an intermediate complexity fetch engine will bring in blobs of instructions, up to (say 6 or 8) with the run of instructions terminating at
- I've scooped up N or
- I've hit a branch or
- I've hit the end of a cache line.
Basically every cycle should consist of pulling in the longest run of instructions possible subject to the above rules.
The way really advanced fetch works is totally decoupled from the rest of the CPU. Every cycle the fetch engine predicts the next fetch address (from some hierarchy of : check the link stack, check the BTB, increment the PC), and fetches as much as possible from that address. These are stuck in a queue connected to decode, and ideally that queue would never run dry.
BUT: on average there is about a branch every 6 instructions.
Now supposed you want to sustain, let's say, 8-wide. That means that you might set N at 8, but most of the time you'll fetch 6 or so instructions because you'll bail out based on hitting a branch before you have a full 8 instructions in your scoop. So you're mostly unable to go beyond an IPC of 6, even if *everything* else is ideal.
BUT most branches are conditional. And good enough half of those are not taken. This means that if you can generate TWO branch predictions per cycle then much of the time the first branch will not be taken, can be ignored, and fetch can continue in a straight line past it. Big win! Half the time you can pull in only 6 instructions, but the other half you could pull in maybe 12 instructions. Basically, if you want to sustain 8 wide, you'd probably want to pull in at least 10 or 12 instructions under best case conditions, to help fill up the queue for the cases where you pull in less than 8 instructions (first branch is taken, or you reach the end of the cache line).
Now there are some technicalities here.
One is "how does fetch know where the branches are, to know when to stop fetching". This is usually done via pre-decode bits living in the I-cache, and set by a kinda decode when the line is first pulled into the I-cache. (I think x86 also does this, but I have no idea how. It's obviously much easier for a sane ISA like ARM, POWER, even z.)
Second, and more interesting, is that you're actually performing two DIFFERENT TYPES of prediction, which makes it somewhat easier from a bandwidth point of view. The prediction on the first branch is purely "taken/not taken", and all you care about is "not taken"; the prediction on the second branch is more sophisticated because if you predict taken you also have to predict the target, which means dealing BTB or link stack.
But you don't have to predict TWO DIFFERENT "next fetch addresses" per cycle, which makes it somewhat easier.
Note also that any CPU that uses two level branch prediction is, I think, already doing two branch prediction per cycle, even if it doesn't look like it. Think about it: how do you USE a large (but slow) second level pool of branch prediction information?
You run the async fetch engine primarily from the first level; and this gives a constant stream of "runs of instructions, separated by branches" with zero delay cycles between runs. Great, zero cycle branches, we all want that. BUT for the predictors to generate a new result in a single cycle they can't be too large.
So you also run a separate engine, delayed a cycle or two, based on the larger pool of second level branch data, checking the predictions of the async engine. If there's a disagreement you flush whatever was fetched past that point (which hopefully is still just in the fetch queue...) and resteer. This will give you a one (or three or four) cycle bubble in the fetch stream, which is not ideal, but
- it doesn't happen that often
- it's a lot better catching a bad prediction very early in fetch, rather than much later in execution
- hopefully the fetch queue is full enough, and filled fast enough, that perhaps it's not even drained by the time decode has walked along it to the point at which the re-steer occurred...
This second (checking) branch prediction doesn't ever get mentioned, but it is there behind the scenes, even when the CPU is ostensibly doing only a single prediction per cycle.
There are other crazy things that happen in modern fetch engines (which are basically in themselves as complicated as a whole CPU from 20 years ago).
One interesting idea is to use the same data that is informing the async fetch engine to inform prefetch. The idea is that you now have essentially two fetch engines running. One is as I described above; the second ONLY cares about the stream of TAKEN branches, and follows that stream as rapidly as possible, ensuring that each line referenced by this stream is being pulled into the I-cache. (You will recognize this as something like a very specialized form of run-ahead.)
In principle this should be perfect -- the I prefetcher and branch-prediction are both trying to solve the *exact* same problem, so pooling their resources should be optimal! In practice, so far this hasn't yet been perfected; the best simulations using this idea are a very few percent behind the best simulations using a different I prefetch technology. But IMHO this is mostly a consequence of this being a fairly new idea that has so far been explored mainly by using pre-existing branch predictors, rather than designing a branch predictor store that's optimal for both tasks.
The main difference is that what matters for prefetching is "far future" branches, branches somewhat beyond where I am now, so that there's plenty of time to pull in the line all the way from RAM. And existing branch predictors have had no incentive to hold onto that sort of far future prediction state. HOWEVER
A second interesting idea is what IBM has been doing for two or three years now. They store branch prediction in what they call an L2 storage but, to avoid things, I'll cal a cold cache. This is stale/far future branch prediction data that is unused for a while but, on triggering events, that cold cache data will be swapped into the branch prediction storage so that the branch predictors are ready to go for the new context in which they find themselves.
I don't believe IBM use this to drive their I-prefetcher, but obviously it is a great solution to the problem I described above and I suspect this will be where all the performance CPUs eventually find themselves over the next few years. (Apple and IBM probably first, because Apple is Apple, and IBM has the hard part of the solution already in place; then ARM because they's smart and trying hard; then AMD because they're also smart but their technology cycles are slower than ARM; and final Intel because, well, they're Intel and have been running on fumes for a few years now.)
(Note of course this only solves I-prefetch, which is nice and important; but D-prefetch remains as a difficult and different problem.)
name99 - Friday, November 6, 2020 - link
Oh, one more thing. I referred to "width" of the CPU above. This becomes an ever vaguer term every year. The basic points are two:- when OoO started, it seemed reasonable to scale every step of the pipeline together. Make the CPU 4-wide. So it can fetch up to 4 instructions/cycle. decode up to 4, issue up to 4, retire up to 4. BUT if you do this you're losing performance every step of the way. Every cycle that fetches only 3 instructions can never make that up; likewise every cycle that only issues 3 instructions.
- so once you have enough transistors available for better designs, you need to ask yourself what's the RATE-LIMITING step? For x86 that's probably in fetch and decode, but let's consider sane ISAs like ARM. There the rate limiting step is probably register rename. So lets assume your max rename bandwidth is 6 instructions/cycle. You actually want to run the rest of your machinery at something like 7 or 8 wide because (by definition) you CAN do so (they are not rate limiting, so they can be grown). And by running them wider you can ensure that the inevitable hiccups along the way are mostly hidden by queues, and your rename machinery is running at full speed, 6-wide each and every cycle, rather than frequently running at 5 or 4 wide because of some unfortunate glitch upstream.
Spunjji - Monday, November 9, 2020 - link
These were interesting posts. Thank you!GeoffreyA - Monday, November 9, 2020 - link
Yes, excellent posts. Thanks.Touching on width, I was expecting Zen 3 to add another decoder and take it up to 5-wide decode (like Skylake onwards). Zen 3's keeping it at 4 makes good sense though, considering their constraint of not raising power. Another decoder might have raised IPC but would have likely picked up power quite a bit.
ignizkrizalid - Saturday, November 7, 2020 - link
Rip Intel no matter how hard you try squeezing Intel sometimes on top within your graphics! stupid site bias and unreliable if this site was to be truth why not do a live video comparison side by side using 3600 or 4000Mhz ram so we can see the actual numbers and be 100% assured the graphic table is not manipulated in any way, yea I know you will never do it! personally I don't trust these "reviews" that can be manipulated as desired, I respect live video comparison with nothing to hide to the public. Rip Intel Rip Intel.Spunjji - Monday, November 9, 2020 - link
I... don't think this makes an awful lots of sense, tbh.MDD1963 - Saturday, November 7, 2020 - link
It would be interesting to also see the various results of the 10900K the way most people actually run them on Z490 boards, i.e, with higher RAM clocks, MCE enabled, etc...; do the equivalent tuning with 5000 series, I'm sure they will run with faster than DDR4-3200 MHz. plus perhaps a small all-core overclock.