AMD Zen 3 Ryzen Deep Dive Review: 5950X, 5900X, 5800X and 5600X Tested
by Dr. Ian Cutress on November 5, 2020 9:01 AM ESTSection by Andrei Frumusanu
CPU ST Performance: SPEC 2006, SPEC 2017
SPEC2017 and SPEC2006 is a series of standardized tests used to probe the overall performance between different systems, different architectures, different microarchitectures, and setups. The code has to be compiled, and then the results can be submitted to an online database for comparison. It covers a range of integer and floating point workloads, and can be very optimized for each CPU, so it is important to check how the benchmarks are being compiled and run.
We run the tests in a harness built through Windows Subsystem for Linux, developed by our own Andrei Frumusanu. WSL has some odd quirks, with one test not running due to a WSL fixed stack size, but for like-for-like testing is good enough. SPEC2006 is deprecated in favor of 2017, but remains an interesting comparison point in our data. Because our scores aren’t official submissions, as per SPEC guidelines we have to declare them as internal estimates from our part.
For compilers, we use LLVM both for C/C++ and Fortan tests, and for Fortran we’re using the Flang compiler. The rationale of using LLVM over GCC is better cross-platform comparisons to platforms that have only have LLVM support and future articles where we’ll investigate this aspect more. We’re not considering closed-sourced compilers such as MSVC or ICC.
clang version 10.0.0

clang version 7.0.1 (ssh://git@github.com/flang-compiler/flang-driver.git

 24bd54da5c41af04838bbe7b68f830840d47fc03)
-Ofast -fomit-frame-pointer

-march=x86-64

-mtune=core-avx2

-mfma -mavx -mavx2
Our compiler flags are straightforward, with basic –Ofast and relevant ISA switches to allow for AVX2 instructions.
To note, the requirements for the SPEC licence state that any benchmark results from SPEC have to be labelled ‘estimated’ until they are verified on the SPEC website as a meaningful representation of the expected performance. This is most often done by the big companies and OEMs to showcase performance to customers, however is quite over the top for what we do as reviewers.
We start off with SPEC2006, a legacy benchmark by now, but which still has very well understood microarchitectural behaviour for us to analyse the new Zen3 design:
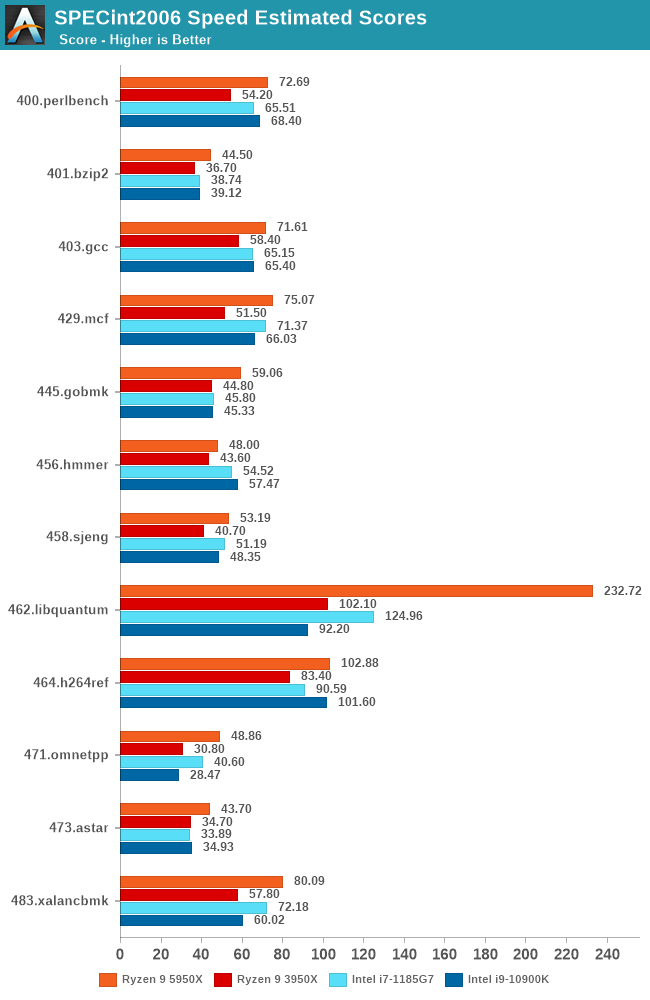
In SPECint2006, we’re seeing healthy performance upticks across the board for many of the tests. Particularly standing out is the new 462.libquantum behaviour of the Ryzen 9 5950X which is posting more than double the performance of its predecessor, likely thanks to the new much larger cache, but also the overall higher load/store throughput of the new core as well as the memory improvements of the microarchitecture.
We’re also seeing very large performance increases for 429.mcf and 471.omnetpp which are memory latency sensitive: Although the new design doesn’t actually change the structural latency to DRAM all that much, the new core’s much improved and smarter handling of memory through new cache-line replacement algorithms, new prefetchers, seem to have a large impact on these workloads.
400.perlbench is interesting as it’s not really a memory-heavy or L3 heavy workload, but instead has a lot of instruction pressure. I think that Zen3’s large boost here might be due to the new optimised OP-cache handling and optimisations as that would make the most sense out of all the changes in the new design – it’s one of the tests that has a very high L1I cache miss rate.
A simpler test that’s solely integer execution bound and sits almost solely in the L1D is 456.hmmer, and here we’re seeing only a minor uplift in performance only linear with the clock frequency increase of the new design, with only a 1% IPC uplift. Given that Zen3 doesn’t actually change its integer execution width in terms of ALUs or overall machine width, it makes sense to not see much improvements here.
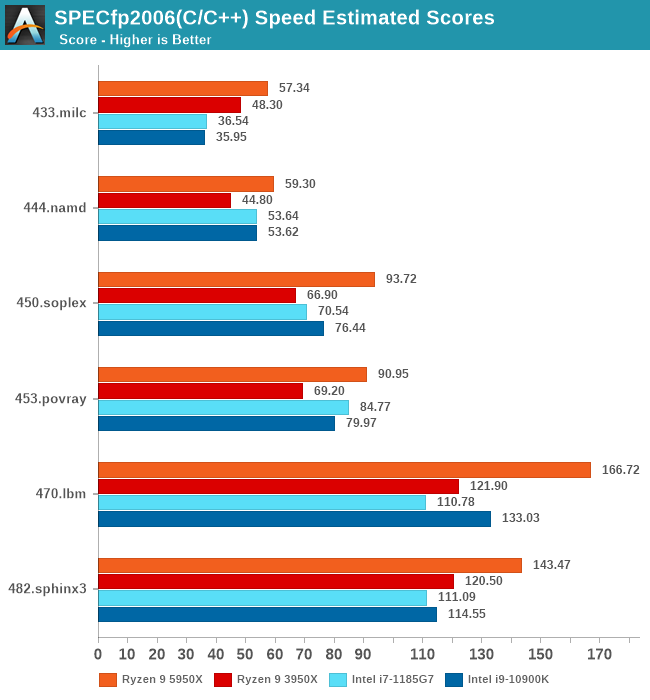
In SPECfp2006, we’re seeing more healthy boosts in performance across the board which is mostly due to the more memory intensive nature of the workloads, and we’re seeing large IPC uplifts in most tests due to the larger L3 as well as the better memory capabilities of the core. 433.milc sees a smaller uplift than the other benchmarks and that’s due to it being more DRAM memory bandwidth bound. 482.spinx is also seeing a smaller 9% IPC uplift due to it not being that memory intensive.
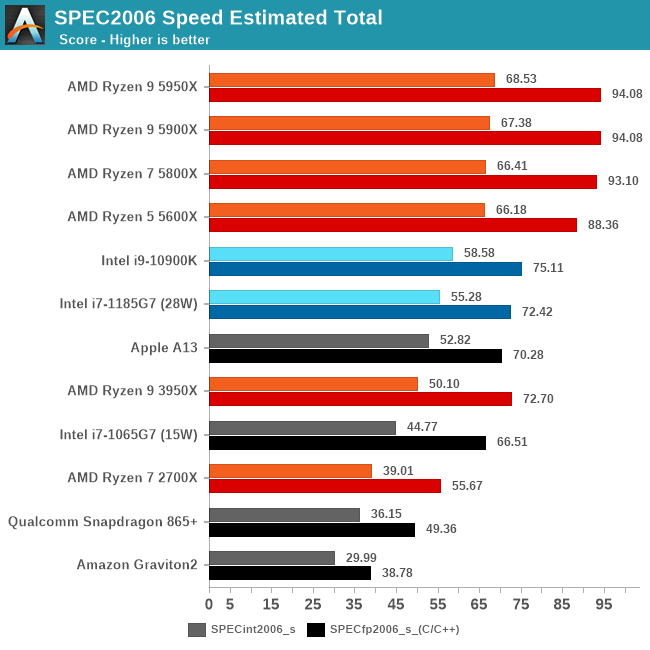
In the overall 2006 scores, the new Ryzen 5000 series parts are showcasing very large generational performance uplifts with margins well beyond that of the previous generation, as well as the nearest competition. Against the 3950X, the new 5950X is 36% faster in the integer workloads, and 29% faster in the floating-point workloads, which are both massive uplifts. AMD is also leaving Intel behind in terms of performance here with a 17% and 25% performance advantage against the 10900K.
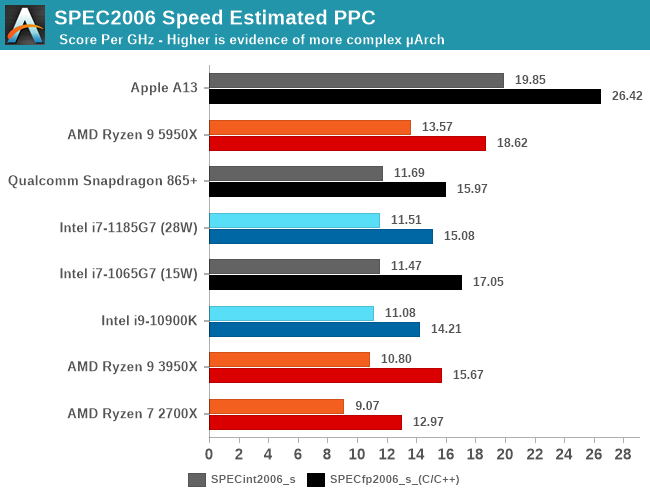
In the performance per clock uplifts, measured at peak performance, we’re seeing a 20.87% median and 24.99% average improvement for the new Zen3 microarchitecture when compared to last year’s Zen2 design. AMD is still quite behind Apple’s A13 and A14 (review coming soon), but that’s natural given the almost double the microarchitectural width of Apple’s design, running at lower frequencies. It’ll be interesting to get Apple Silicon Mac devices tested and compared against the new AMD parts.
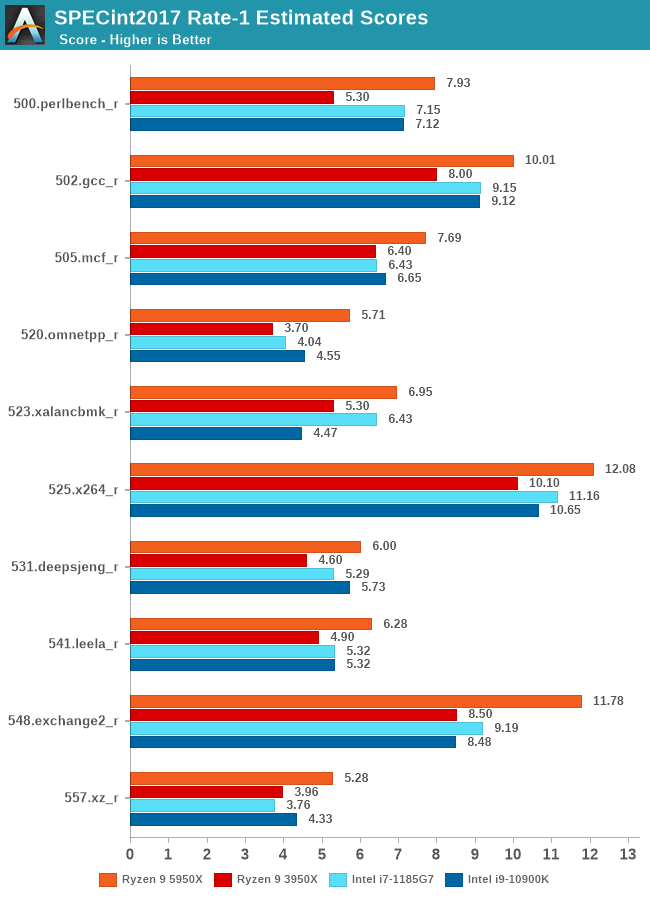
Moving onto the newer SPECint2017, we again see some large improvement of Zen3 depending on the various microarchitectural characteristics of the respective workloads. 500.perlbench_r again shows a massive 37% IPC uplift for the new architecture – again very likely to the new design and optimisations on the part of the OP-cache of the Zen3 design.
520.omnetpp again also shows a 42% IPC uplift thanks to the memory technologies employed in the new design. Execution throughput limited workloads such as 525.x264 are seeing smaller increases of 9.5% IPC due to again overall less changes on this aspect of the microarchitecture.
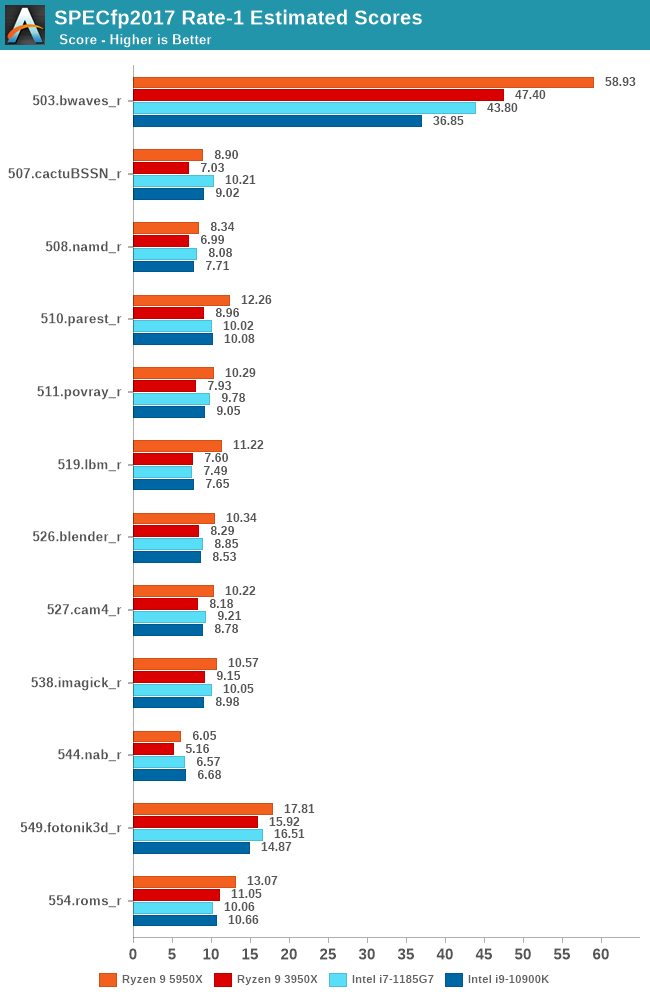
In SPECfp2017, we see a similar situation as previous workloads. Execution-bound workloads such as 508.namd or 538.imagick are seeing smaller IPC increases in the 9-6% range. Similarly, DRAM bandwidth starved workloads such as 549.fotonik3d and 554.roms are showcasing also smaller IPC boosts of 2.7 – 8.6%.
The more hybrid workloads which make good use of the caches are seeing larger performance improvements across the board. Up to a 35.6% IPC peak for 519.lbm.
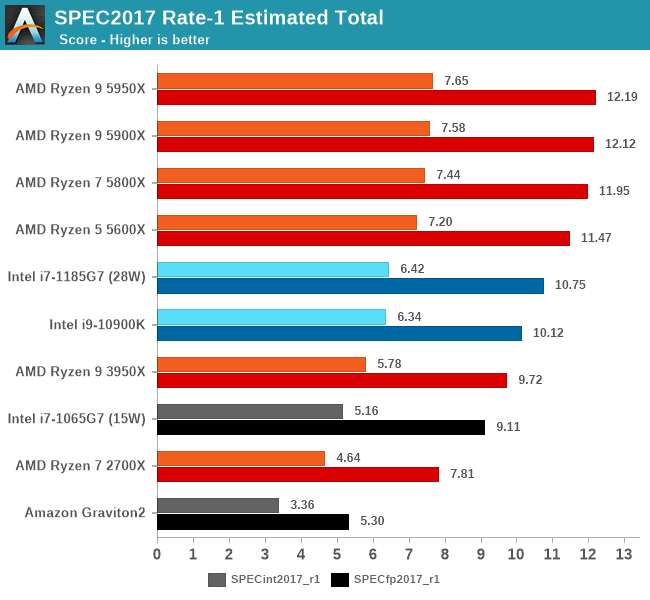
In the SPEC2017 suite total performance figures, the new Ryzen 5000 also shine thanks to their frequency and IPC uplifts. Generationally, across the int2017 and fp2017 suites, we’re seeing a 32% and 25% performance boost over the 3950X, which are very impressive figures.
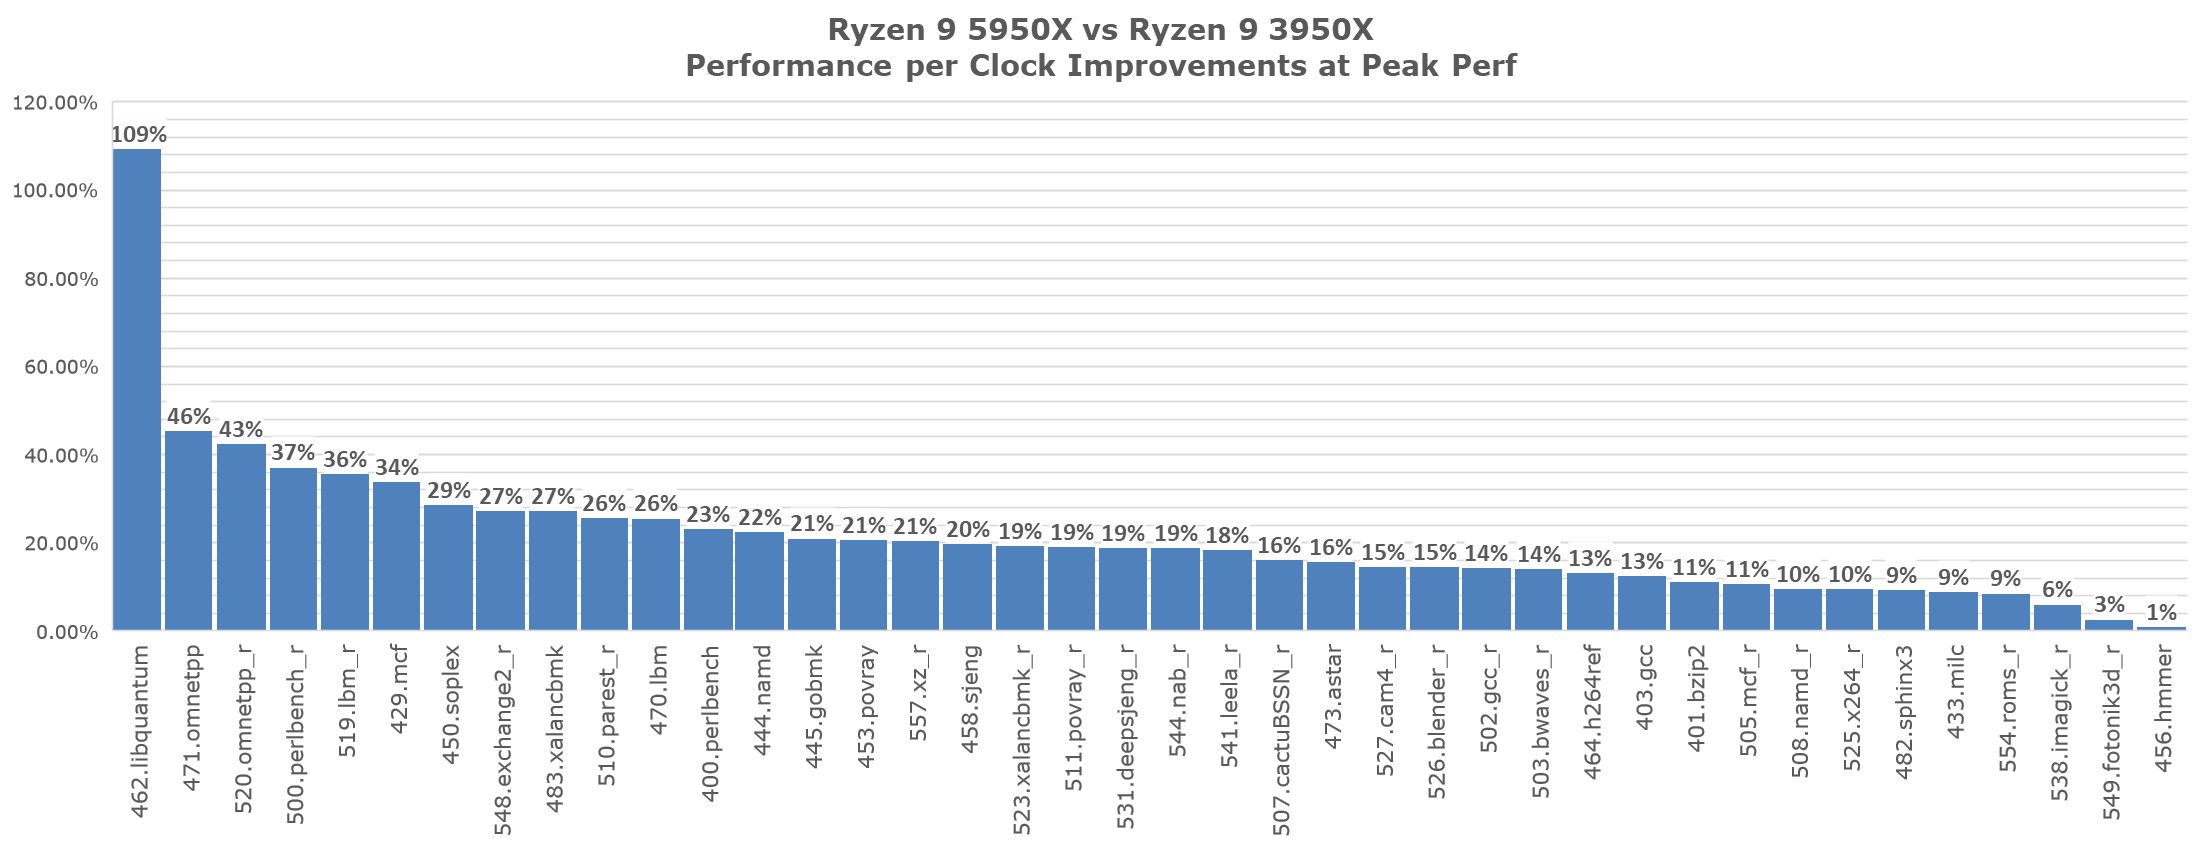
IPC wise, looking at a histogram of all SPEC workloads, we’re seeing a median of 18.86%, which is very near AMD’s proclaimed 19% figure, and an average of 21.38% - although if we discount libquantum that average does go down to 19.12%. AMD’s marketing numbers are thus pretty much validated as they’ve exactly hit their proclaimed figure with the new Zen3 microarchitecture.
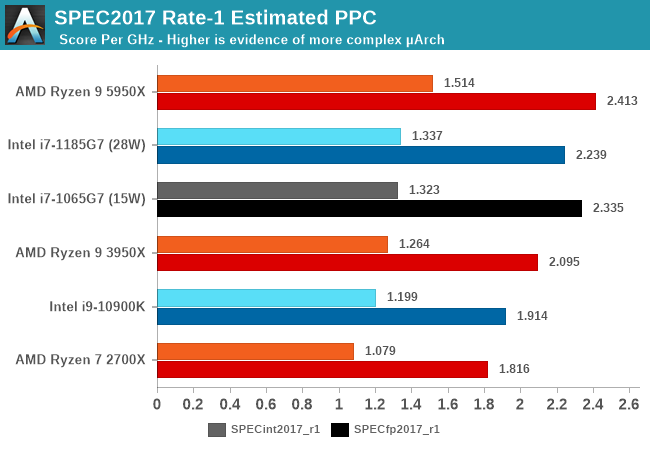
On the competitive landscape, this now makes Zen3 the undisputed leader in the x86 space, leaving Intel’s old Skylake designs far behind and also showing more design complexity than the newer Sunny Cove and Willow Cove cores.
Overall, the new Ryzen 5000 series and the Zen3 microarchitecture seem like absolute winners, and there’s no dispute about them taking the performance crown. AMD has achieved this through both an uplift in frequency, as well as a notable 19% uplift thanks to a smarter design.
What I hope to see from AMD in future designs is a more aggressive push towards a wider core design with even larger IPC jumps. In workloads that are more execution bound, Zen3 isn’t all that big of an uplift. The move from a 16MB to a 32MB L3 cache isn’t something that’ll repeated any time soon in terms of improvement magnitude, and it’s also very doubtful we’ll see significant frequency uplifts with coming generations. As Moore’s Law is slowing, going wider and smarter seems to be the only way forward for advancing performance.


339 Comments
View All Comments
LithiumFirefly - Friday, November 6, 2020 - link
I thought the whole point to a civilization game benchmark was a time to complete turn not FPS who cares about FPS and a turn-based game.dagobah123 - Friday, November 6, 2020 - link
The more benchmarks the better. These are general purpose CPUs. Wouldn't it be a shame if you bought a 120hz+ 4k monitor with an expensive graphics card, only to find out your CPU was limiting your frames? Sure the game is playable @ 5 FPS as the author mentioned. However, it's getting harder to make the CPU the bottleneck in a lot of these games at higher resolutions and quality settings, so they have to resort to this. Would anyone play a game @ 360p? No, but if you want to see which CPU is better I say lets include every benchmark we can find.CookieBin - Friday, November 6, 2020 - link
I find it funny that these huge gains mean literally nothing at 4K. So all these different review sites highlight sky high fps at 1080p because at 4K that huge advantage becomes less than a 0.3% improvement.. keep pounding sand linus tech tips. I've never seen such a big nothing burger. No idiot out there buys a $800 5950X to play video games at 1080p.chuyayala - Friday, November 6, 2020 - link
The reason they test 1080p is because game processing is CPU-bound at that resolution (they are testing the CPU after-all). The higher the resolution, the more the GPU is working (not the CPU). The reason why there aren't much gains in 4k is because processing is limited by the GPU power. If we assume we get ultra powerful GPUs that can run 4k games at 120+ frames per second, then the CPU becomes more important.dagobah123 - Friday, November 6, 2020 - link
This is simply not true. It only appears to 'mean nothing' if you don't realize the bottleneck in the testing system on most of the benchmarks are the GPU. Meaning the GPU is maxed out at 100%. In this case you're right, the difference between many CPUs will not matter, but what about next year when you decide to buy the next high-end GPU, only to find out the CPU you choose couldn't handle much more. This is why 360p, 720p, even 1080p benchmarks are included to show you just how much more ahead one CPU is over another. Check out the test setup--they are using a 2080 Ti. Come check out the updated reviews after they test all this on 3090s and 6900 XTs.Pit a Ferarri and a Ford Model T against one another. Sure they both keep up with one another in the grocery parking lot @ 15mph. Take em out on the freeway with a 70mph speed limit and you'll have a clear winner. Let alone let em loose on the race track.
Future proof yourself a bit, buy a 5600k or 5800k for your 4k gaming. If you don't update your CPU often you'll be glad you did a couple years out if you drop in that next GPU.
nandnandnand - Saturday, November 7, 2020 - link
5950X will make your web browsing snappier... so you can load more AnandTech ads. ;)zodiacfml - Sunday, November 8, 2020 - link
duh? Steam survey shows 1080p the most popular resolution for gaming. Aside from that, it is difficult to maintain frame rates for 240Hz/360Hz monitors.You might have a point with 720p res though
realbabilu - Friday, November 6, 2020 - link
First: I think you should compare with F or KF Intel version, for price comparison. Since they don't have internal Gpu. Somehow AMD not included the FAN also, beware good cooling isn't cheap.SECOND: it's nice to had coding bench with optimization here windows, with AVX2 and some flags compiling, Amd only provide optimization compiling on Linux only, I think they should be on windows too with optimized math kernel and compiler.
ThIrd: the price performance is justified now. In zen2 release the price was lower than Intel that time, made Intel justified the price for 10th Gen. Now from price sensitive, Intel still fine per price / performance ratio,even though it's need more power consumption.
duploxxx - Saturday, November 7, 2020 - link
the ryzens have a base TDP of 105W and peaking towards 140-150Wnot like the intels that peak at +200ish W, there you need good cooling.
A Dark rock slim or shadow rock can easily handle this and it will cost you 50-60$..
go find a cooler for the +200W so that it wont throttle all the time for the Intel
realbabilu - Saturday, November 7, 2020 - link
Great. I think Anand tech should do cooling shootout for 5900x/5950x bench.To find the minimum air cooler for this,
AMD only list noctua and bequiet as air cooler, others as liquid cooler at https://www.amd.com/en/processors/ryzen-thermal-so...
The slim rock and nh14s maybe the cheapest on the list. It is interesting could more budget double fan tower should enough for 5900x/5950x that has 145 watt max like deepcool gammax 400 pro (double fan), coolermaster ma410p, and shadow rock 2/3, and maybe cheapest aio coolermaster liquid master 120 lite that not listed on amd list.