QLC Goes To 8TB: Samsung 870 QVO and Sabrent Rocket Q 8TB SSDs Reviewed
by Billy Tallis on December 4, 2020 8:00 AM ESTRandom Read Performance
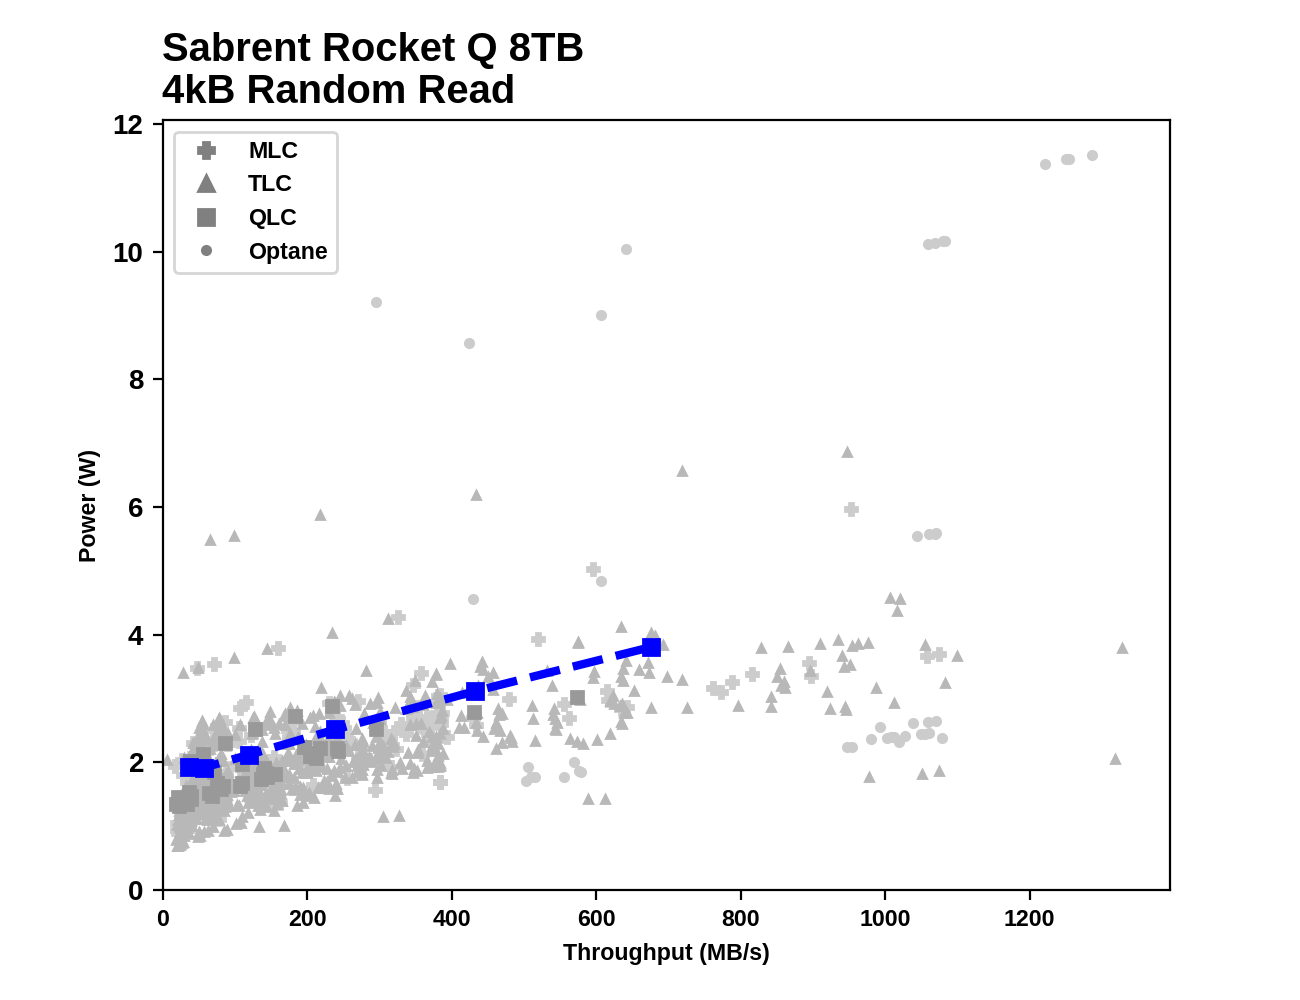
Our first test of random read performance uses very short bursts of operations issued one at a time with no queuing. The drives are given enough idle time between bursts to yield an overall duty cycle of 20%, so thermal throttling is impossible. Each burst consists of a total of 32MB of 4kB random reads, from a 16GB span of the disk. The total data read is 1GB.
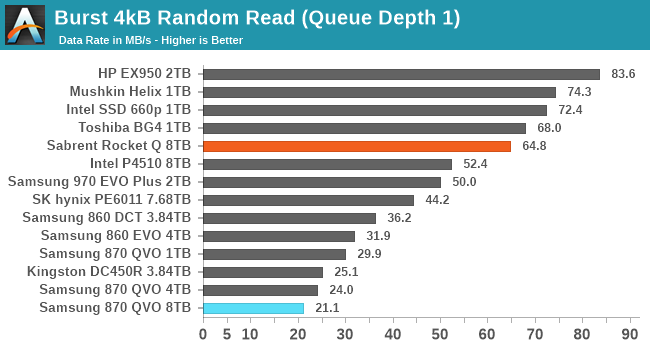
The burst random read performance from the 8TB Samsung 870 QVO is even worse than the smaller 870s; even though these drives have the full amount of DRAM necessary to hold the logical to physical address mapping tables, there are other significant sources of overhead affecting the higher capacity models.
The Sabrent Rocket Q's burst random read performance doesn't quite fall at the opposite end of the spectrum, but it does clearly offer decent random read latency that is comparable to other drives using the Phison E12(S) controller and not too far behind the NVMe drives using Silicon Motion controllers.
Our sustained random read performance is similar to the random read test from our 2015 test suite: queue depths from 1 to 32 are tested, and the average performance and power efficiency across QD1, QD2 and QD4 are reported as the primary scores. Each queue depth is tested for one minute or 32GB of data transferred, whichever is shorter. After each queue depth is tested, the drive is given up to one minute to cool off so that the higher queue depths are unlikely to be affected by accumulated heat build-up. The individual read operations are again 4kB, and cover a 64GB span of the drive.
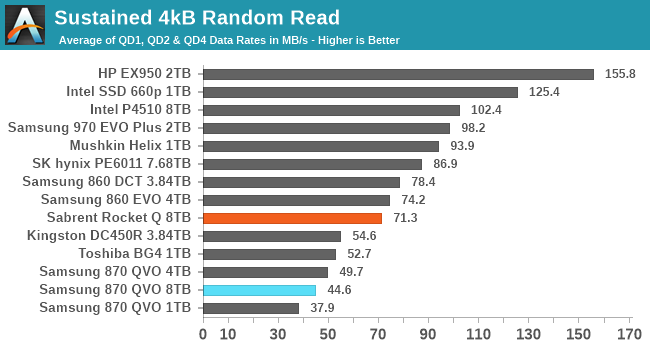
The QLC drives almost all fare poorly on the longer random read test. The Sabrent Rocket Q falls to be the second-slowest NVMe drive in this batch, and a bit slower than Samsung's TLC SATA drives. The 8TB Samsung 870 QVO is no longer the slowest capacity; while it is again a bit slower than the 4TB model, the 1TB 870 QVO takes last place in this test.
 |
|||||||||
| Power Efficiency in MB/s/W | Average Power in W | ||||||||
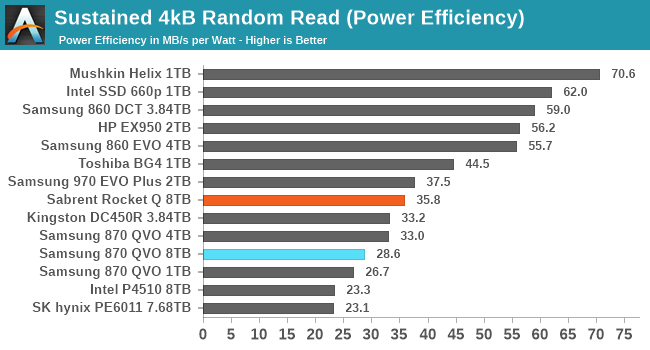
The power efficiency scores are mostly in line with the performance scores, with the slower drives tending to also be less efficient. The QLC drives follow this pattern quite well. The outliers are the particularly efficient Mushkin Helix DRAMless TLC drive, and the enterprise NVMe SSDs that show poor efficiency because they are underutilized by the low queue depths tested here.
 |
|||||||||
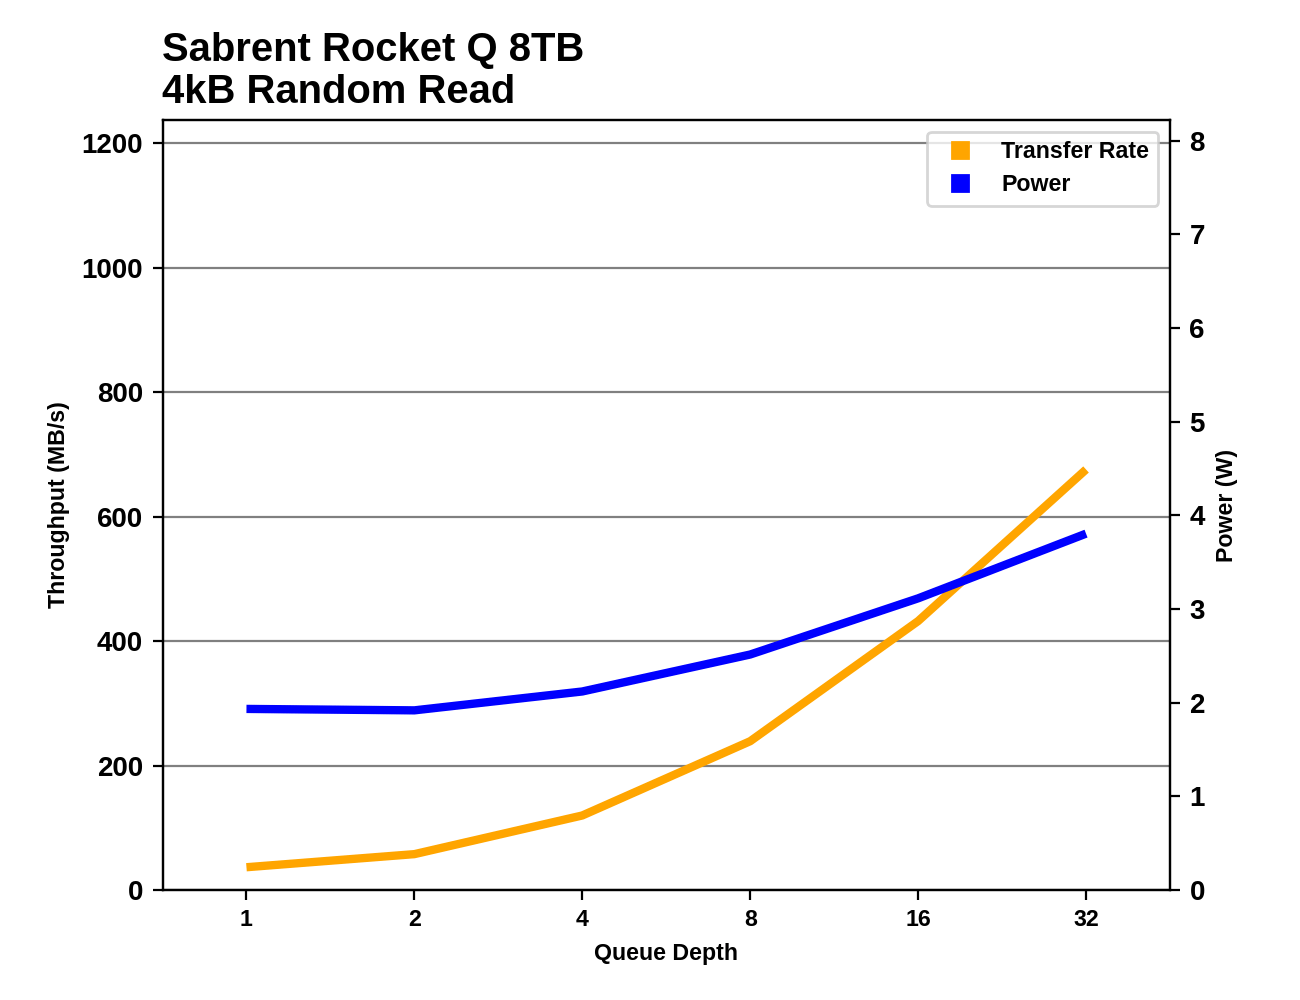
The Sabrent Rocket Q shows good performance scaling as queue depths increase during the random read test. The Samsung 870 QVO seems to be approaching saturation past QD16, even though the SATA interface is capable of delivering higher performance.
 |
|||||||||
| Sabrent Rocket Q 8TB | Samsung 870 QVO 8TB | ||||||||
Comparing the 8TB drives against everything else we've tested, neither is breaking new ground. Both drives have power consumption that's on the high side but not at all unprecedented, and random read performance that doesn't push the limits of their respective interfaces.
Random Write Performance
Our test of random write burst performance is structured similarly to the random read burst test, but each burst is only 4MB and the total test length is 128MB. The 4kB random write operations are distributed over a 16GB span of the drive, and the operations are issued one at a time with no queuing.
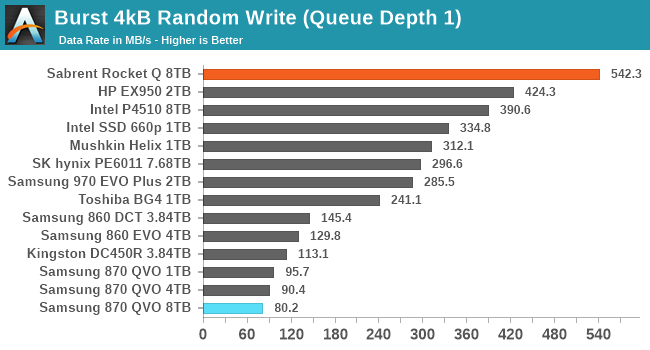
The two 8TB drives have opposite results for the burst random write performance test. The 8TB Sabrent Rocket Q it at the top of the chart with excellent SLC cache write latency, while the 8TB Samsung 870 QVO is a bit slower than the smaller capacities and turns in the worst score in this bunch.
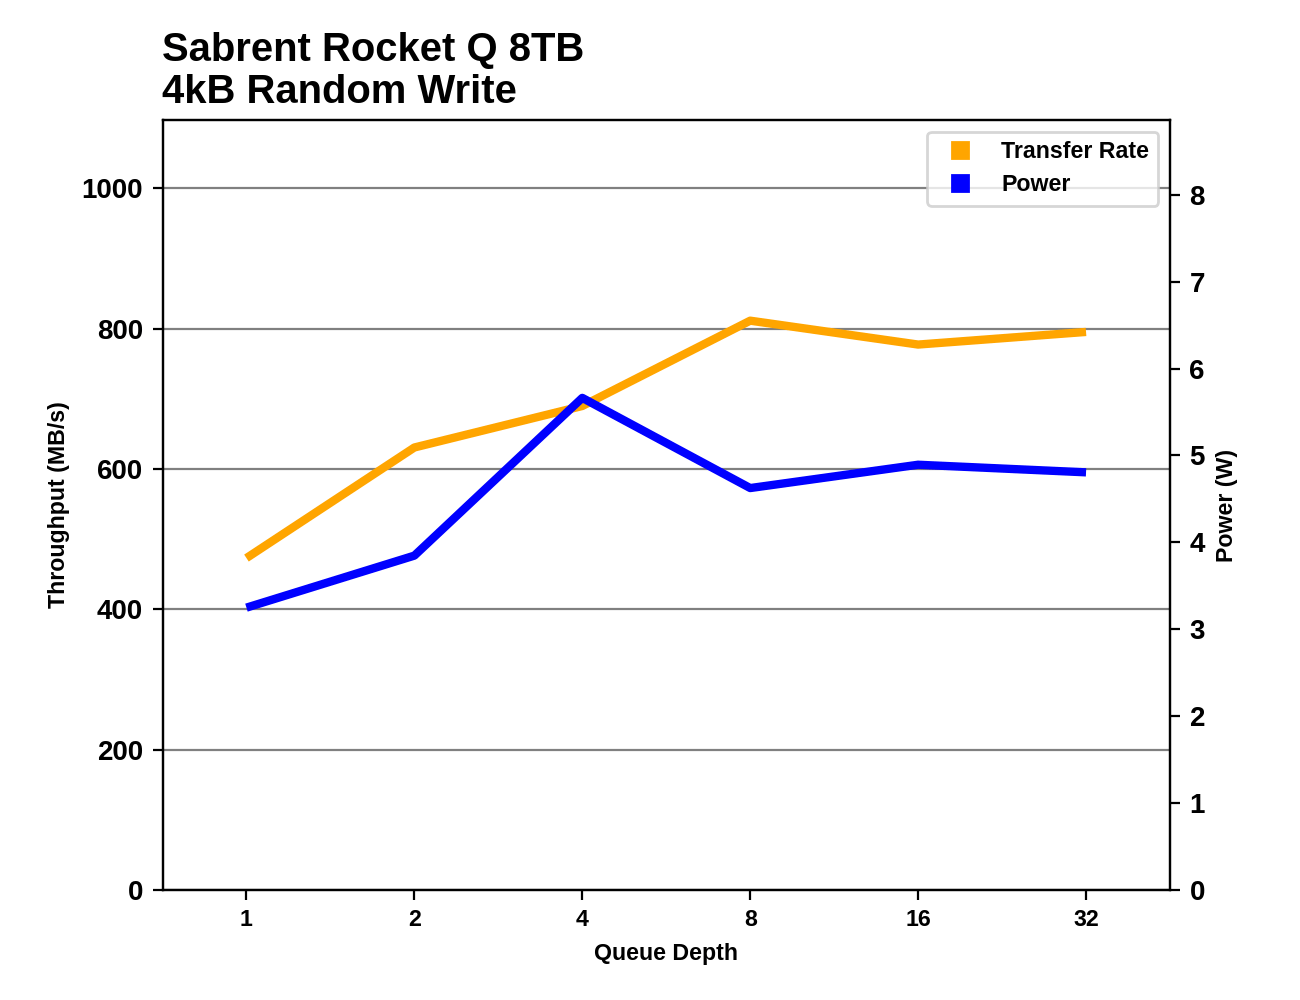
As with the sustained random read test, our sustained 4kB random write test runs for up to one minute or 32GB per queue depth, covering a 64GB span of the drive and giving the drive up to 1 minute of idle time between queue depths to allow for write caches to be flushed and for the drive to cool down.
On the longer random write test, the 8TB Rocket Q is still relying mostly on its SLC cache and continues to hang with the high-end NVMe drives. The 8TB 870 QVO is only slightly slower than the other SATA SSDs, and faster than some of the low-end DRAMless TLC NVMe drives.
 |
|||||||||
| Power Efficiency in MB/s/W | Average Power in W | ||||||||
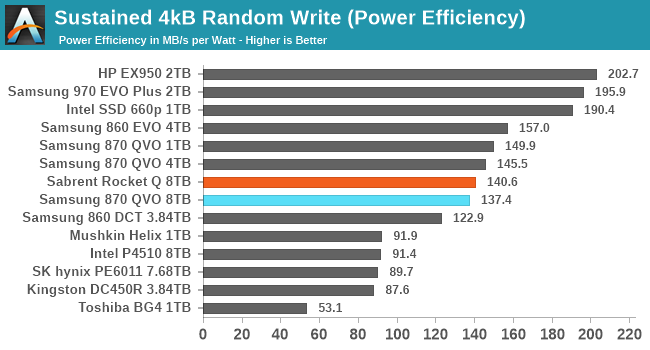
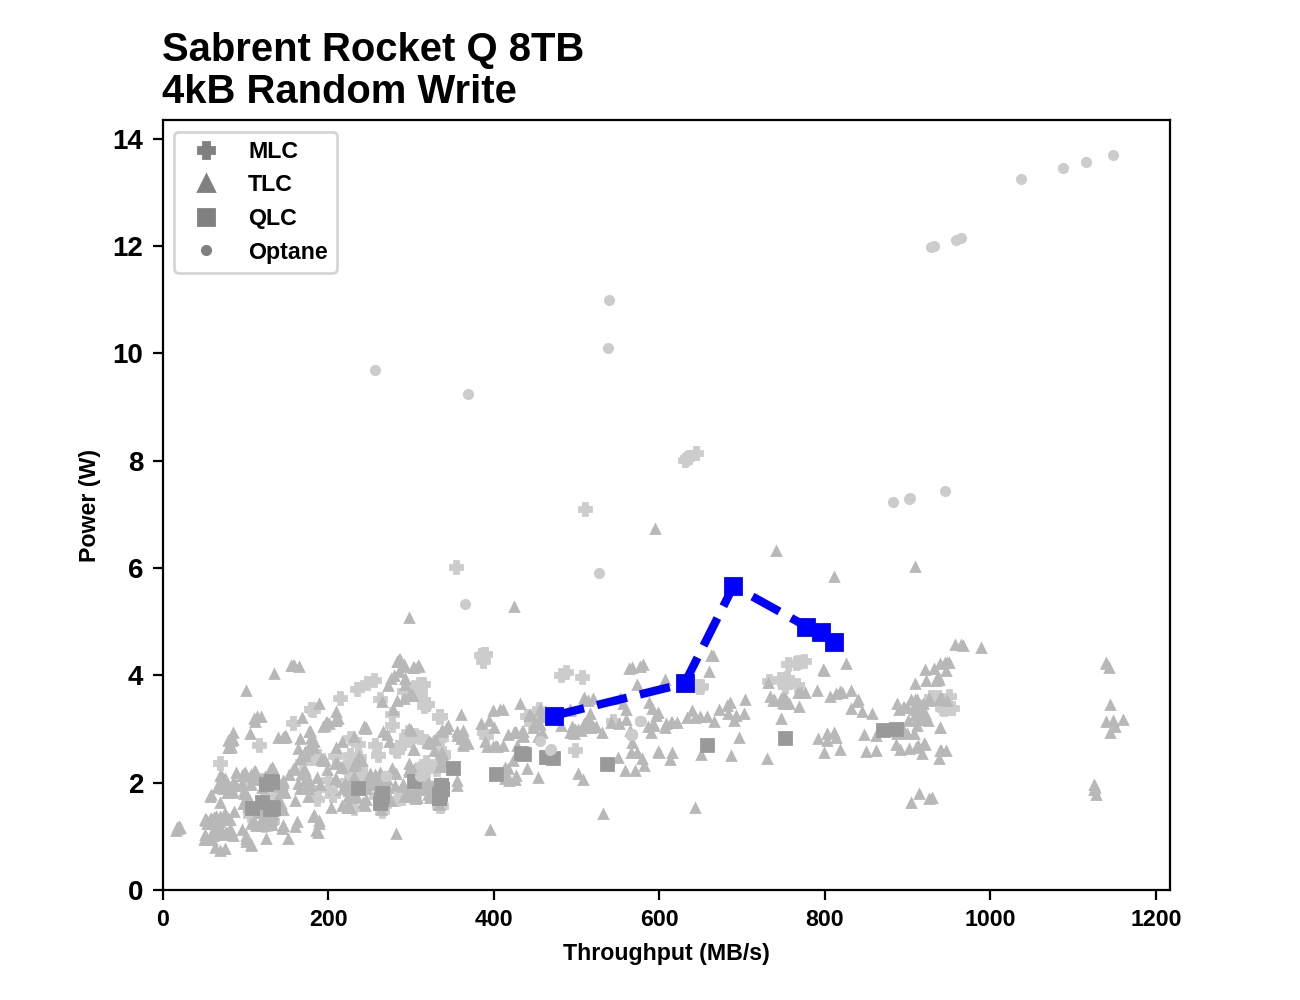
Despite their dramatically different random write performance, the two 8TB QLC drives end up with similar power efficiency that's fairly middle of the road: better than the enterprise drives and the slow DRAMless TLC drives, but clearly worse than the better TLC NVMe drives.
 |
|||||||||
The random write performance of the Rocket Q scales a bit unevenly, but seems to saturate around QD8. Power consumption actually drops after QD4, possibly because the drive is busy enough at that point with random writes that it cuts back on background cleanup work. The Samsung 870 QVO reaches full random write performance at QD4 and steadily maintains that performance through the rest of the test.
 |
|||||||||
| Sabrent Rocket Q 8TB | Samsung 870 QVO 8TB | ||||||||
Unlike on the random read test, the Samsung 870 QVO comes across as having reasonably low power consumption on the random write test, especially at higher queue depths. The Sabrent Rocket Q's power consumption is still clearly on the high side, especially the spike at QD4 where it seemed to be doing a lot of background work instead of just directing writes to the SLC cache.


150 Comments
View All Comments
shelbystripes - Thursday, December 10, 2020 - link
Dude, you don't seem to understand how "consumerist capitalism" DOES work. QLC will still be more than good enough for most consumers, or at least, that's what manufacturers are banking on. They still need to sell the hardware, and they're competing in a world where MLC and TLC SSDs still widely exist.The only way to get there will be lower cost... and there will be plenty of consumers who respond to high-capacity QLC SSDs at lower costs than "scale" alone can achieve for MLC or TLC drives, and who won't care about the drop in MTBF because QLC SSDs still have more total writes than they'll ever need. QLC SSDs aren't going to be for everyone, but if TLC (even 3D TLC) is such cheap technology that "scale" is all you need to hit 8TB SSDs with it, why isn't anyone making sub-$1K 8TB 3D TLC drives and competing with these? Shouldn't they be?
You just don't know what you're talking about, yet you have the arrogance of someone prepared to speak for everybody uniformly.
boozed - Saturday, December 5, 2020 - link
The Sabrent appears to perform quite well in real world tests, regardless of its synthetic/theoretical performance. Is this a bad thing?Hixbot - Saturday, December 5, 2020 - link
MLC/TLC is still available at extra cost. Meanwhile QLC is pushing HDDs out of the market.Oxford Guy - Sunday, December 6, 2020 - link
"MLC/TLC is still available at extra cost."Economy of scale. QLC is an attack on TLC and MLC.
Oxford Guy - Sunday, December 6, 2020 - link
Also the article says:"QLC NAND offers just a 33% increase in theoretical storage density, but in practice most QLC NAND is manufactured as 1024Gbit dies while TLC NAND is manufactured as 256Gbit and 512Gbit dies."
Which means manufacturers are trying to kneecap TLC to push QLC.
Spunjji - Monday, December 7, 2020 - link
Or it means that manufacturing TLC at those capacities per die would result in a bloated die size with decreased yields, increased costs, and too-few dies per drive to reach competitive speeds at the most common capacities.The problem with having a conclusion and looking for evidence to support it is that you can come up with all sorts of silly reasons for things that are perfectly explicable by other means.
Oxford Guy - Thursday, December 10, 2020 - link
Speculativeshelbystripes - Thursday, December 10, 2020 - link
It's ironic that you respond to someone calling out your unsubstantiated speculation as "speculative". If you're opposed to speculation, you should retract your statements assuming that manufacturers are out to "kneecap" MLC/TLC like they have some secret agenda against higher-reliability parts...Spunjji - Monday, December 7, 2020 - link
Do you have any evidence that would support that claim? Say, TLC costs rising even as QLC rolls out, in a way that doesn't reflect the usual industry supply/demand fluctations?Oxford Guy - Thursday, December 10, 2020 - link
Yes. The die sizes offered with TLC are 50% smaller at best. That magnifies the 30% density increase of QLC automatically. Maybe this reply will stick. Here’s to hoping.