QLC Goes To 8TB: Samsung 870 QVO and Sabrent Rocket Q 8TB SSDs Reviewed
by Billy Tallis on December 4, 2020 8:00 AM ESTRandom Read Performance
Our first test of random read performance uses very short bursts of operations issued one at a time with no queuing. The drives are given enough idle time between bursts to yield an overall duty cycle of 20%, so thermal throttling is impossible. Each burst consists of a total of 32MB of 4kB random reads, from a 16GB span of the disk. The total data read is 1GB.
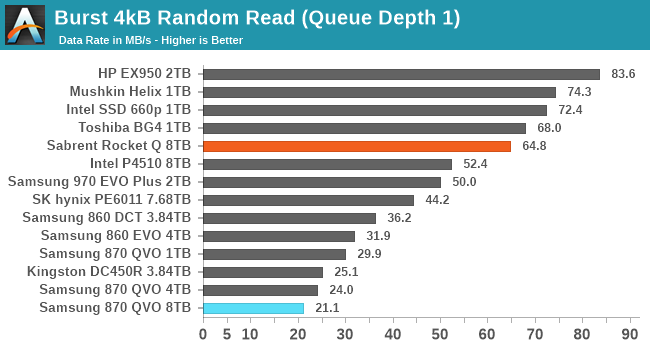
The burst random read performance from the 8TB Samsung 870 QVO is even worse than the smaller 870s; even though these drives have the full amount of DRAM necessary to hold the logical to physical address mapping tables, there are other significant sources of overhead affecting the higher capacity models.
The Sabrent Rocket Q's burst random read performance doesn't quite fall at the opposite end of the spectrum, but it does clearly offer decent random read latency that is comparable to other drives using the Phison E12(S) controller and not too far behind the NVMe drives using Silicon Motion controllers.
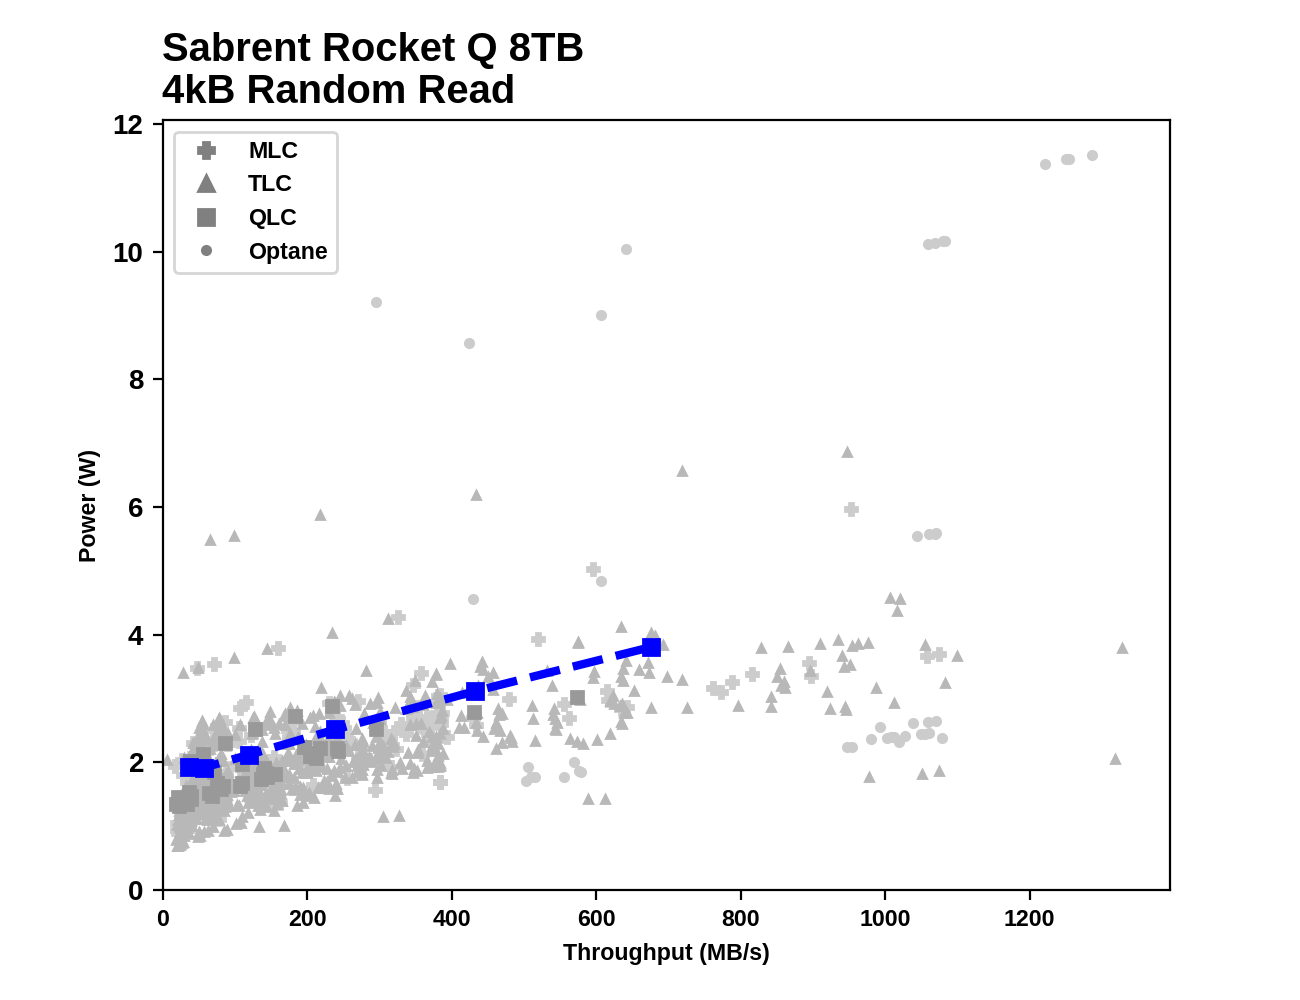
Our sustained random read performance is similar to the random read test from our 2015 test suite: queue depths from 1 to 32 are tested, and the average performance and power efficiency across QD1, QD2 and QD4 are reported as the primary scores. Each queue depth is tested for one minute or 32GB of data transferred, whichever is shorter. After each queue depth is tested, the drive is given up to one minute to cool off so that the higher queue depths are unlikely to be affected by accumulated heat build-up. The individual read operations are again 4kB, and cover a 64GB span of the drive.
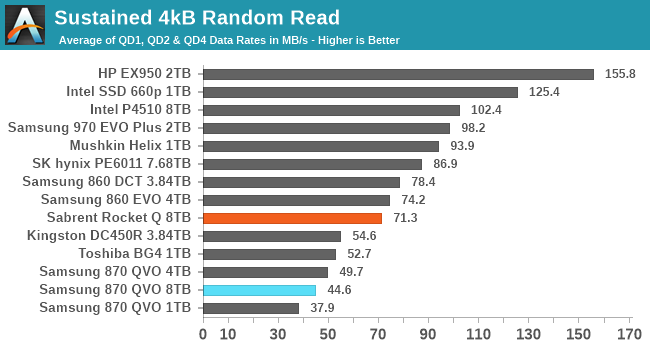
The QLC drives almost all fare poorly on the longer random read test. The Sabrent Rocket Q falls to be the second-slowest NVMe drive in this batch, and a bit slower than Samsung's TLC SATA drives. The 8TB Samsung 870 QVO is no longer the slowest capacity; while it is again a bit slower than the 4TB model, the 1TB 870 QVO takes last place in this test.
 |
|||||||||
| Power Efficiency in MB/s/W | Average Power in W | ||||||||
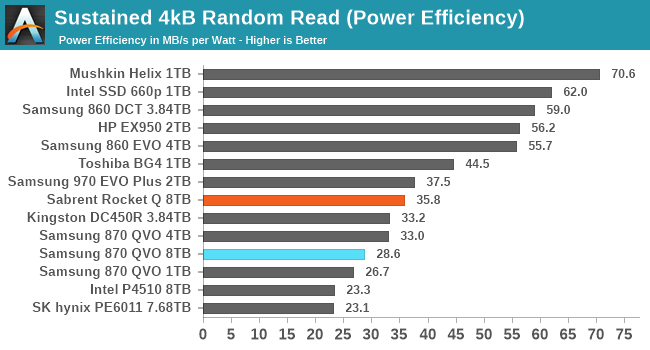
The power efficiency scores are mostly in line with the performance scores, with the slower drives tending to also be less efficient. The QLC drives follow this pattern quite well. The outliers are the particularly efficient Mushkin Helix DRAMless TLC drive, and the enterprise NVMe SSDs that show poor efficiency because they are underutilized by the low queue depths tested here.
 |
|||||||||
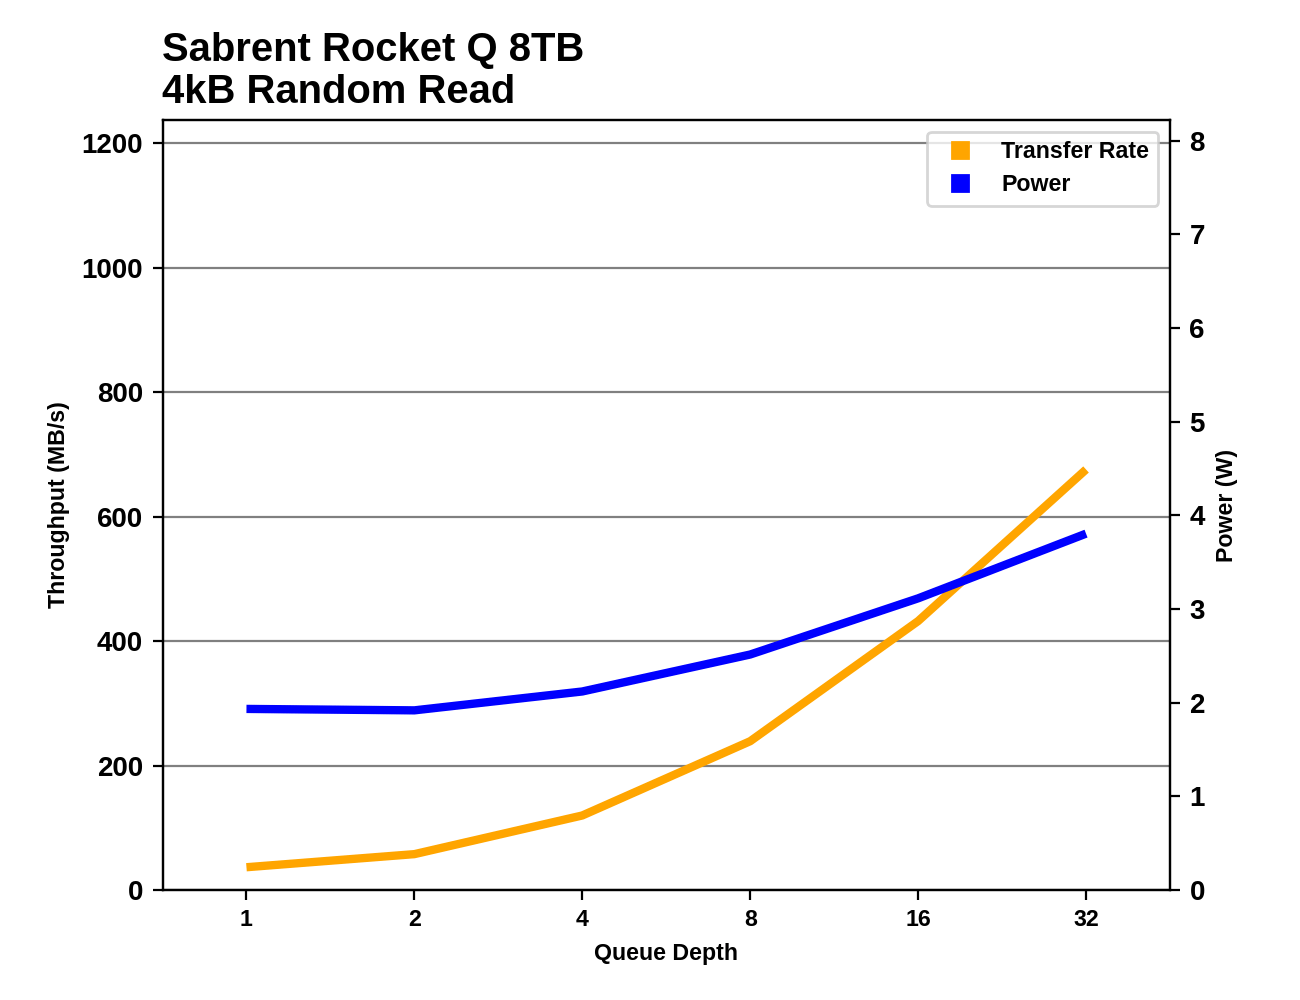
The Sabrent Rocket Q shows good performance scaling as queue depths increase during the random read test. The Samsung 870 QVO seems to be approaching saturation past QD16, even though the SATA interface is capable of delivering higher performance.
 |
|||||||||
| Sabrent Rocket Q 8TB | Samsung 870 QVO 8TB | ||||||||
Comparing the 8TB drives against everything else we've tested, neither is breaking new ground. Both drives have power consumption that's on the high side but not at all unprecedented, and random read performance that doesn't push the limits of their respective interfaces.
Random Write Performance
Our test of random write burst performance is structured similarly to the random read burst test, but each burst is only 4MB and the total test length is 128MB. The 4kB random write operations are distributed over a 16GB span of the drive, and the operations are issued one at a time with no queuing.
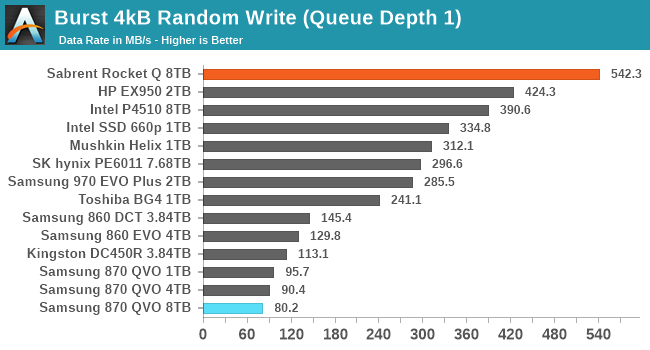
The two 8TB drives have opposite results for the burst random write performance test. The 8TB Sabrent Rocket Q it at the top of the chart with excellent SLC cache write latency, while the 8TB Samsung 870 QVO is a bit slower than the smaller capacities and turns in the worst score in this bunch.
As with the sustained random read test, our sustained 4kB random write test runs for up to one minute or 32GB per queue depth, covering a 64GB span of the drive and giving the drive up to 1 minute of idle time between queue depths to allow for write caches to be flushed and for the drive to cool down.
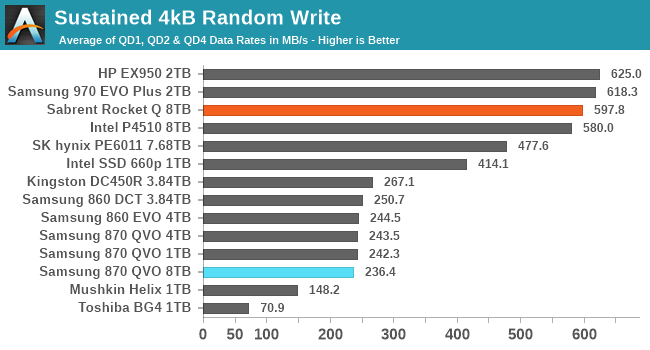
On the longer random write test, the 8TB Rocket Q is still relying mostly on its SLC cache and continues to hang with the high-end NVMe drives. The 8TB 870 QVO is only slightly slower than the other SATA SSDs, and faster than some of the low-end DRAMless TLC NVMe drives.
 |
|||||||||
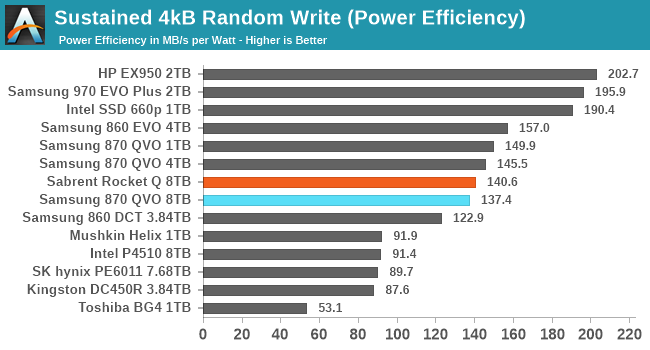
| Power Efficiency in MB/s/W | Average Power in W | ||||||||
Despite their dramatically different random write performance, the two 8TB QLC drives end up with similar power efficiency that's fairly middle of the road: better than the enterprise drives and the slow DRAMless TLC drives, but clearly worse than the better TLC NVMe drives.
 |
|||||||||
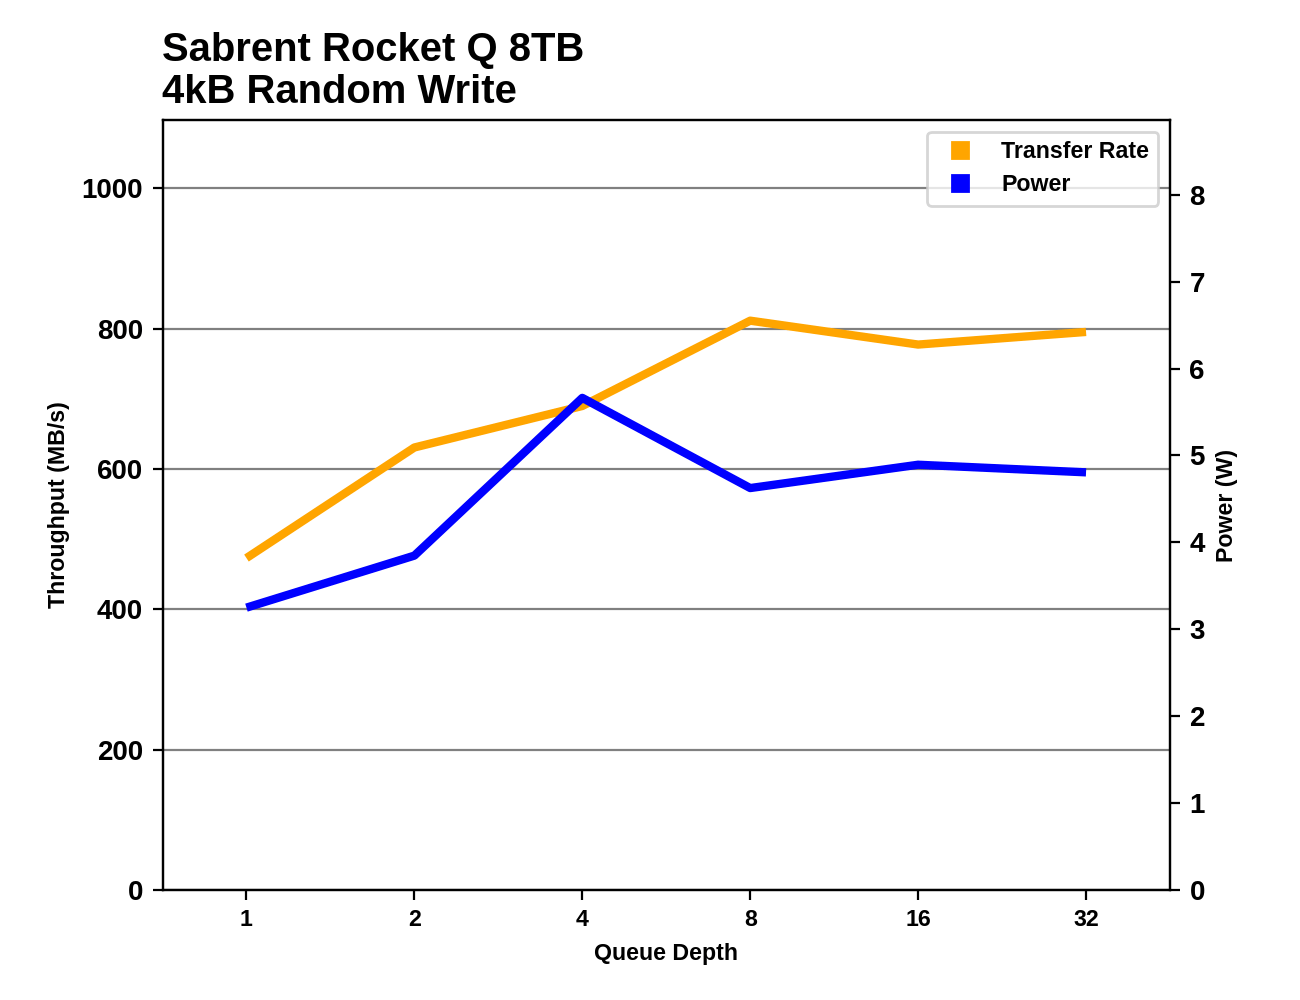
The random write performance of the Rocket Q scales a bit unevenly, but seems to saturate around QD8. Power consumption actually drops after QD4, possibly because the drive is busy enough at that point with random writes that it cuts back on background cleanup work. The Samsung 870 QVO reaches full random write performance at QD4 and steadily maintains that performance through the rest of the test.
 |
|||||||||
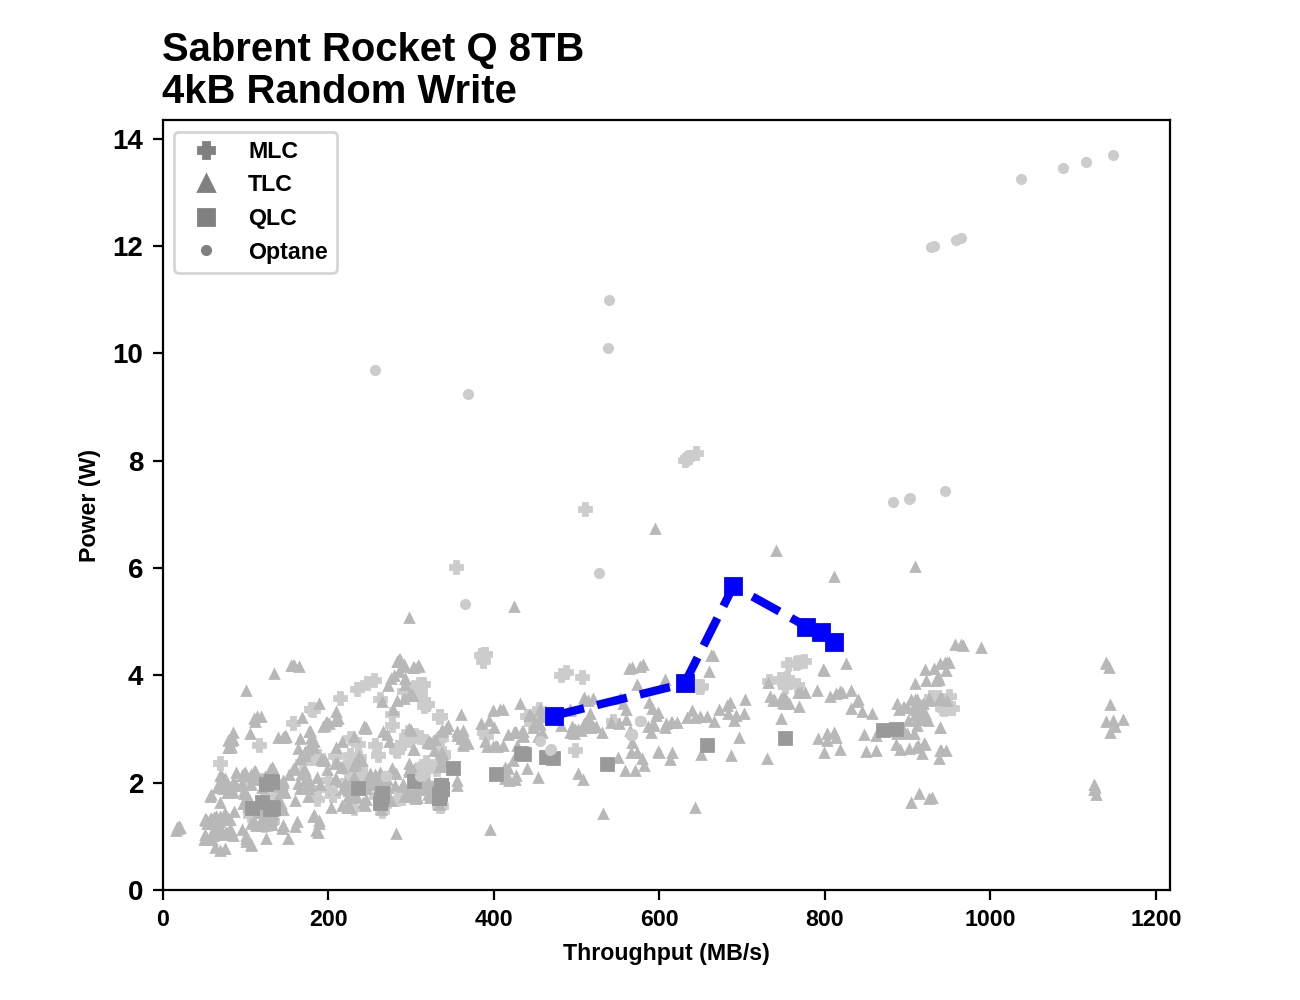
| Sabrent Rocket Q 8TB | Samsung 870 QVO 8TB | ||||||||
Unlike on the random read test, the Samsung 870 QVO comes across as having reasonably low power consumption on the random write test, especially at higher queue depths. The Sabrent Rocket Q's power consumption is still clearly on the high side, especially the spike at QD4 where it seemed to be doing a lot of background work instead of just directing writes to the SLC cache.


150 Comments
View All Comments
Scour - Monday, December 7, 2020 - link
After experiences which some QLC-SSDs from Samsung and Crucial I have to say: Stay away from QLC if you want performance.Maybe it´s OK for ppl who install a windows and store some music or photos on it, but if you want to write larger amount of data you will be faster with HDDs.
It´s a shame that some ppl recommend a QVO because it have a Samsung-controller and DRAM. Don´t agree with them because some cheap TLC-SSDs are much faster.
Oxford Guy - Monday, December 7, 2020 - link
Samsung is often overrated anyway. Their planar TLC drives were so poorly made that they have to periodically rewrite the data that's on the drive to maintain decent performance.I also remember the company's completely bogus power consumption claims, claims that were taken as truth by consumers who would recommend the drives based on the deception.
Scour - Tuesday, December 8, 2020 - link
My 840 (first version) never was good, it was slower than some of my cheapest SSDs in daily use. I use it now for video-recording on a set-top-box. It´s fast enough for the writing-speed and it gets erased all 2-3 weeks.But the 850 and 860 Evo works good and fast.
The QVO-series maybe beats other QLC-products like DRAM-less BX500 (so far never seen benchmarks of new Sandisk Plus with QLC) but is to expensive in capacities less than 8TB
WaltC - Monday, December 7, 2020 - link
This has to be the first NMEe .M2-interface vs. SATA3-interface SSD comparison that ignores the differences in bus connections as if they don't exist--or as if they don't matter. Scratching my head over this one. Max optimal bandwidth for Sata3 SSD's is generally less than 550MB/s. Max optimal bandwidth for an .M2 NVMe 3x4 PCIe 3 drive like the Sabrent here is 3.5-5.x GB/s. And for PCIe 4 3x4 NVMe drives like the 980 Pro from Samsung, the max optimal bandwidth is as much a 7+ GB/s. Comparing the internal drive controllers and the onboard ram between SSD's is fine and should be done--but *never* at the expense of treating the drive interfaces into the system as if they just don't matter, imo...;) If people are merely looking capacities and prices without regard to performance this might be a helpful review. But when is that ever really the case? With SATA3 SSDs, it doesn't really matter about the internals, the performance is caped at < 550MB/s. The bottleneck being the drive's system interface.peevee - Wednesday, December 9, 2020 - link
2TB of SLC is equal to 8TB of QLC. I doubt the SLC flash is separate from QLC, they probably use QLC in SLC mode until 2TB fill up, and then start compressing the data into QLC. So the switch might happen without constant sequential write too.ballsystemlord - Wednesday, December 9, 2020 - link
@Billy , Under "Random Write Performance" (burst and sustained,) you'll notice that you wrote the same comment twice by mistake.zhpenn - Monday, February 8, 2021 - link
About the 8TB version power consumption, I notice in the spec is 5.5W when compare to 860 EVO(4W) Can I put 870 QVO 8TB into a USB 3.0 SATA enclosure and used it without an unstable issue? or it may eject unexpectedly or slow speed due to high power consumption?PushT - Thursday, October 14, 2021 - link
How big is the cache on this drive ? The 32 GB "sustained"transfer falls within that cache, is that right ? Say I wanted to make a backup of my whole system, on this drive, or just move the backup to it, or other large files for that matter. How would the sustained 128KB write performance look ? Why do you test for this rather small transfer size when it only showcases the faster cache ? Am I wrong ? Please tell me why you can't just as well include longer and larger transfers, so as to show what happens when the QLC nand is written to ?PushT - Thursday, October 14, 2021 - link
To be fair this drive has a large dynamic cache. You can transfer a lot of data before you hit the QLC nand directly. But if you look at the review at Tom's you can see how the perfomance actually drops to 200 MB/s after the cache is filled up, about that of a WD black HDD. That is not too impressive. Also I wonder about the heat when you start using these small drives for bulk storage...PushT - Thursday, October 14, 2021 - link
With the Samsung 870 Evo, as an example, you can fill up the whole drive with sequential writes at 500 MB/s. Looking at a potential bulk storage solution, you would write a full hypothetical 8TB Samsung Evo 870 sata ssd in approximately 4,43 hours, whereas filling a Sabrent rocket 8TB would take about 6,2 hours. So depending on your usage, there are trade-offs. If I was to copy drives I don't see why I would use this over a top Sata ssd.