QLC Goes To 8TB: Samsung 870 QVO and Sabrent Rocket Q 8TB SSDs Reviewed
by Billy Tallis on December 4, 2020 8:00 AM ESTRandom Read Performance
Our first test of random read performance uses very short bursts of operations issued one at a time with no queuing. The drives are given enough idle time between bursts to yield an overall duty cycle of 20%, so thermal throttling is impossible. Each burst consists of a total of 32MB of 4kB random reads, from a 16GB span of the disk. The total data read is 1GB.
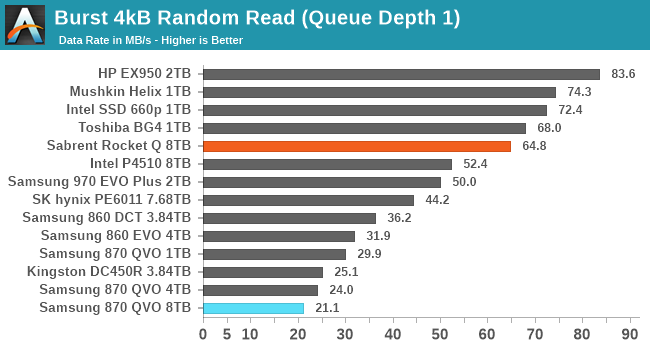
The burst random read performance from the 8TB Samsung 870 QVO is even worse than the smaller 870s; even though these drives have the full amount of DRAM necessary to hold the logical to physical address mapping tables, there are other significant sources of overhead affecting the higher capacity models.
The Sabrent Rocket Q's burst random read performance doesn't quite fall at the opposite end of the spectrum, but it does clearly offer decent random read latency that is comparable to other drives using the Phison E12(S) controller and not too far behind the NVMe drives using Silicon Motion controllers.
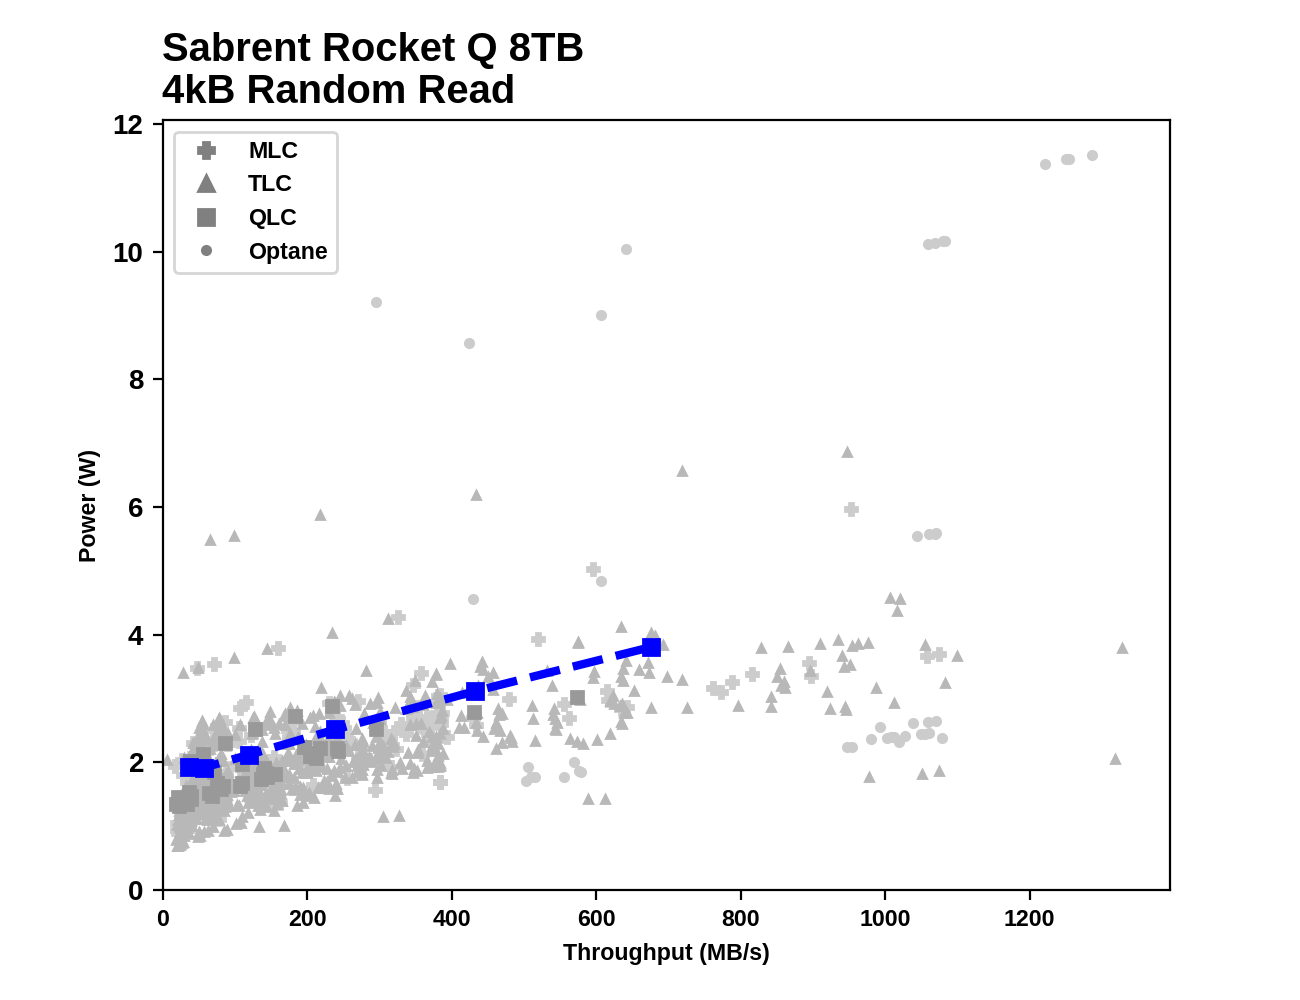
Our sustained random read performance is similar to the random read test from our 2015 test suite: queue depths from 1 to 32 are tested, and the average performance and power efficiency across QD1, QD2 and QD4 are reported as the primary scores. Each queue depth is tested for one minute or 32GB of data transferred, whichever is shorter. After each queue depth is tested, the drive is given up to one minute to cool off so that the higher queue depths are unlikely to be affected by accumulated heat build-up. The individual read operations are again 4kB, and cover a 64GB span of the drive.
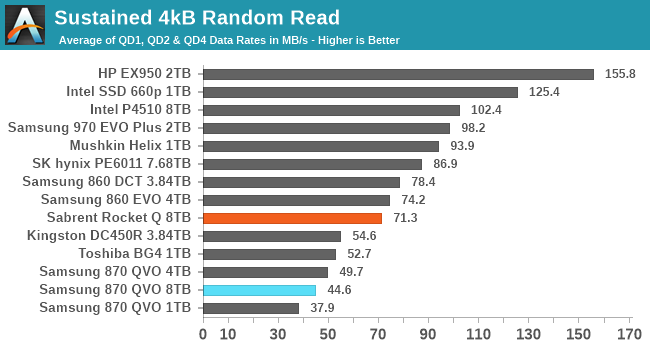
The QLC drives almost all fare poorly on the longer random read test. The Sabrent Rocket Q falls to be the second-slowest NVMe drive in this batch, and a bit slower than Samsung's TLC SATA drives. The 8TB Samsung 870 QVO is no longer the slowest capacity; while it is again a bit slower than the 4TB model, the 1TB 870 QVO takes last place in this test.
 |
|||||||||
| Power Efficiency in MB/s/W | Average Power in W | ||||||||
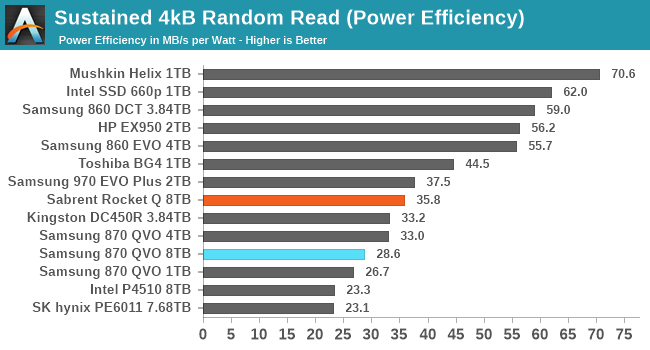
The power efficiency scores are mostly in line with the performance scores, with the slower drives tending to also be less efficient. The QLC drives follow this pattern quite well. The outliers are the particularly efficient Mushkin Helix DRAMless TLC drive, and the enterprise NVMe SSDs that show poor efficiency because they are underutilized by the low queue depths tested here.
 |
|||||||||
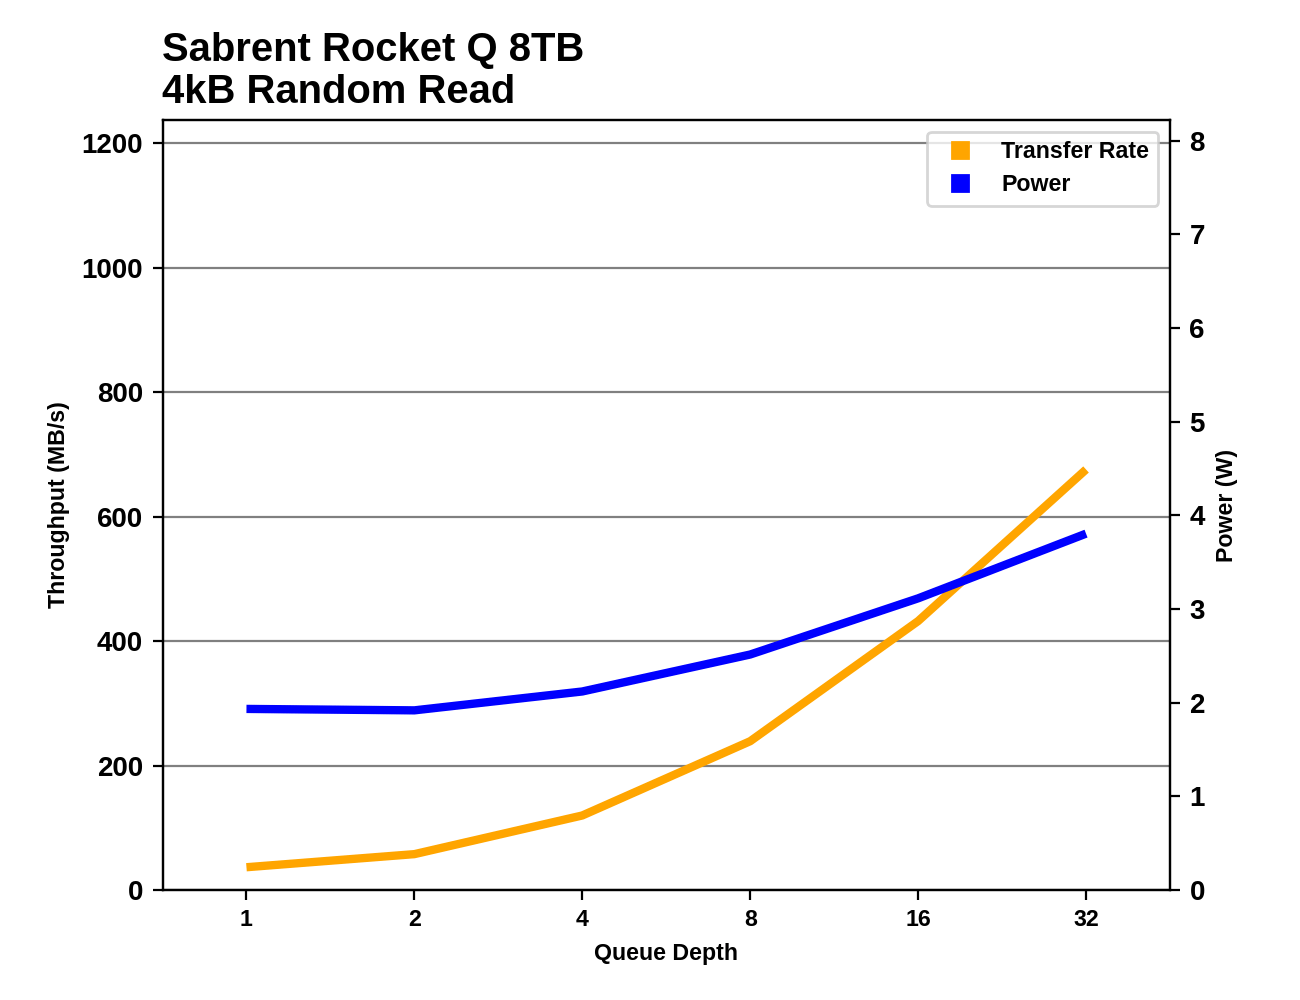
The Sabrent Rocket Q shows good performance scaling as queue depths increase during the random read test. The Samsung 870 QVO seems to be approaching saturation past QD16, even though the SATA interface is capable of delivering higher performance.
 |
|||||||||
| Sabrent Rocket Q 8TB | Samsung 870 QVO 8TB | ||||||||
Comparing the 8TB drives against everything else we've tested, neither is breaking new ground. Both drives have power consumption that's on the high side but not at all unprecedented, and random read performance that doesn't push the limits of their respective interfaces.
Random Write Performance
Our test of random write burst performance is structured similarly to the random read burst test, but each burst is only 4MB and the total test length is 128MB. The 4kB random write operations are distributed over a 16GB span of the drive, and the operations are issued one at a time with no queuing.
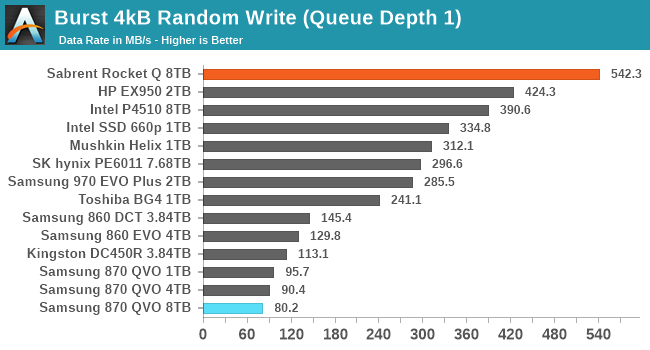
The two 8TB drives have opposite results for the burst random write performance test. The 8TB Sabrent Rocket Q it at the top of the chart with excellent SLC cache write latency, while the 8TB Samsung 870 QVO is a bit slower than the smaller capacities and turns in the worst score in this bunch.
As with the sustained random read test, our sustained 4kB random write test runs for up to one minute or 32GB per queue depth, covering a 64GB span of the drive and giving the drive up to 1 minute of idle time between queue depths to allow for write caches to be flushed and for the drive to cool down.
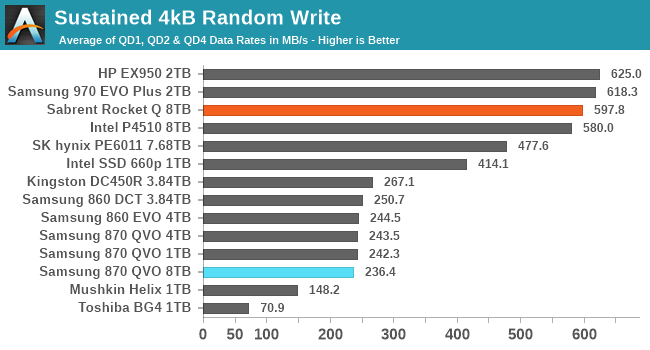
On the longer random write test, the 8TB Rocket Q is still relying mostly on its SLC cache and continues to hang with the high-end NVMe drives. The 8TB 870 QVO is only slightly slower than the other SATA SSDs, and faster than some of the low-end DRAMless TLC NVMe drives.
 |
|||||||||
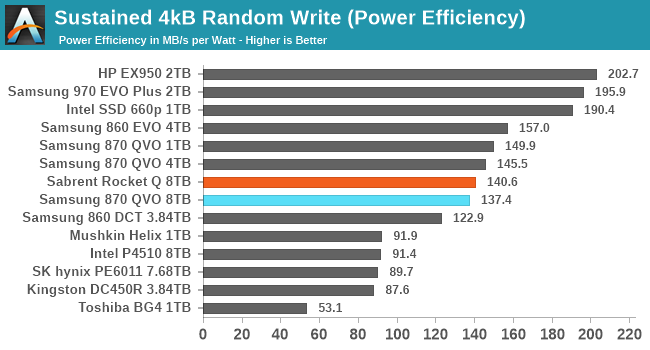
| Power Efficiency in MB/s/W | Average Power in W | ||||||||
Despite their dramatically different random write performance, the two 8TB QLC drives end up with similar power efficiency that's fairly middle of the road: better than the enterprise drives and the slow DRAMless TLC drives, but clearly worse than the better TLC NVMe drives.
 |
|||||||||
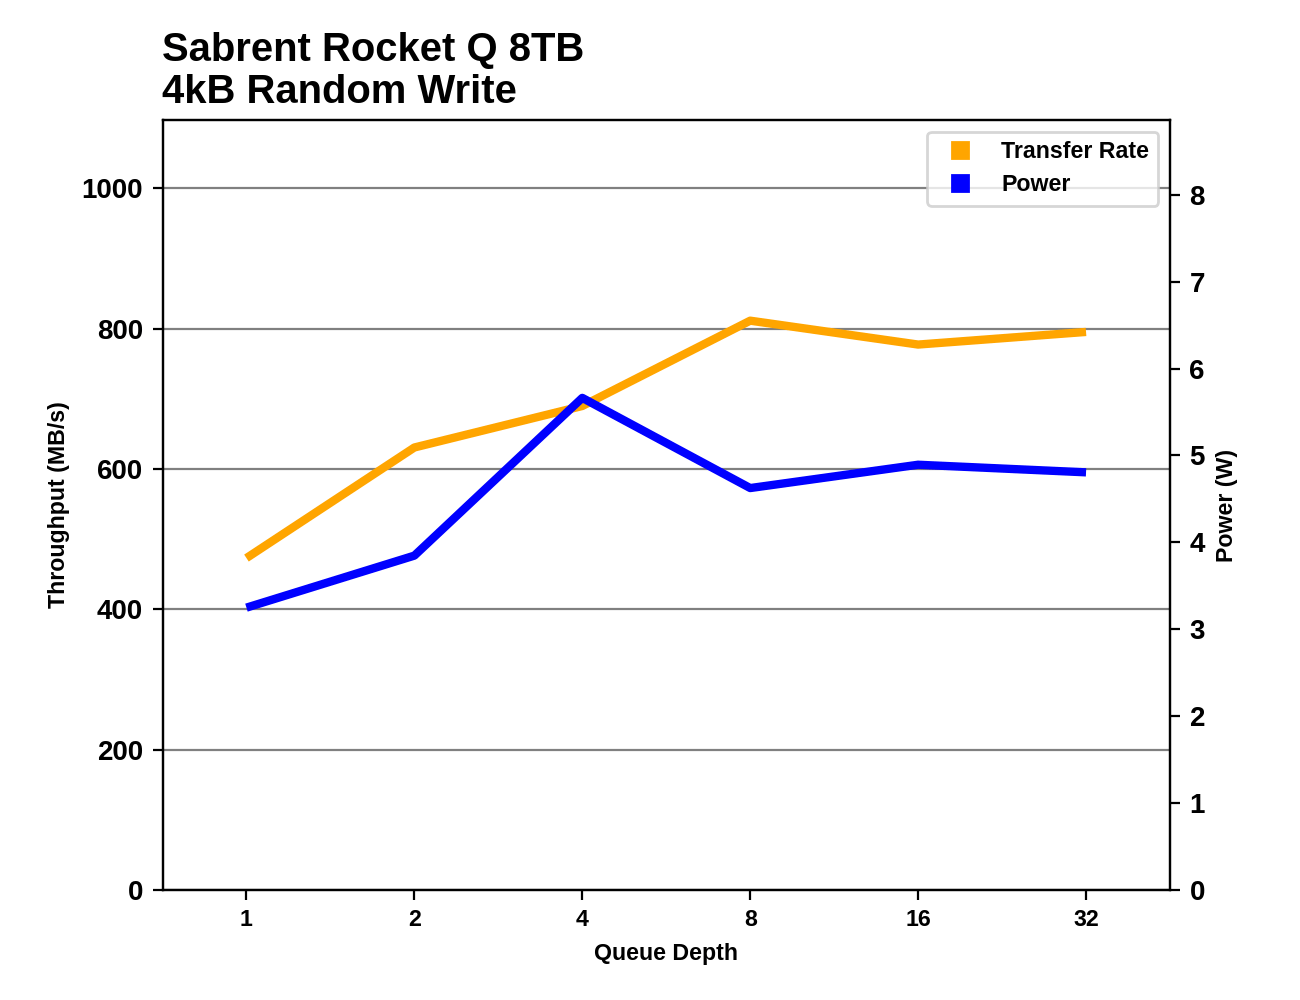
The random write performance of the Rocket Q scales a bit unevenly, but seems to saturate around QD8. Power consumption actually drops after QD4, possibly because the drive is busy enough at that point with random writes that it cuts back on background cleanup work. The Samsung 870 QVO reaches full random write performance at QD4 and steadily maintains that performance through the rest of the test.
 |
|||||||||
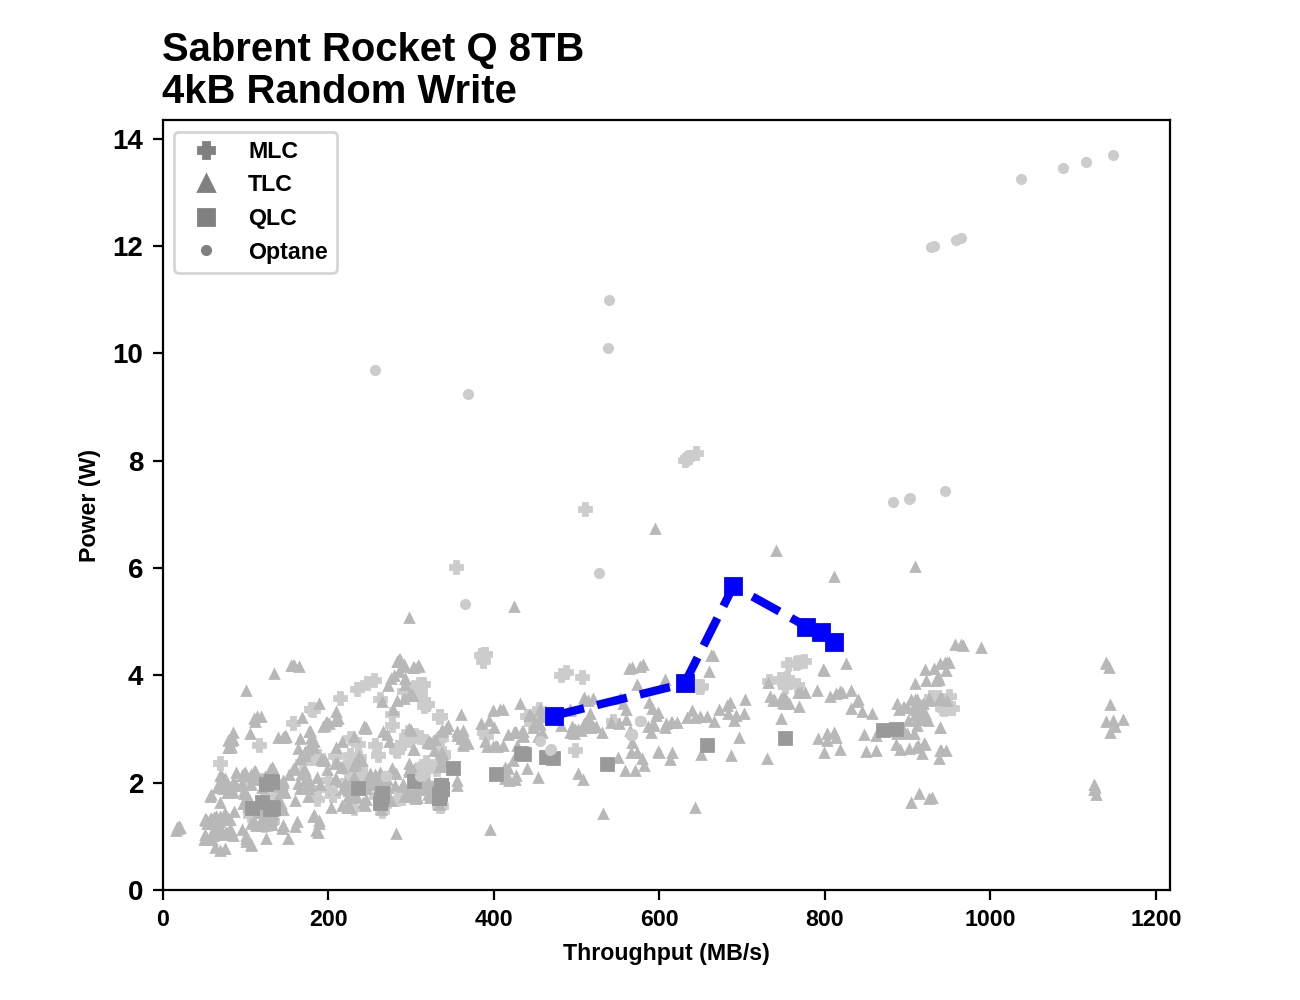
| Sabrent Rocket Q 8TB | Samsung 870 QVO 8TB | ||||||||
Unlike on the random read test, the Samsung 870 QVO comes across as having reasonably low power consumption on the random write test, especially at higher queue depths. The Sabrent Rocket Q's power consumption is still clearly on the high side, especially the spike at QD4 where it seemed to be doing a lot of background work instead of just directing writes to the SLC cache.


150 Comments
View All Comments
heffeque - Friday, December 4, 2020 - link
"Of course we hope that firmwares don't have such bugs, but how would we know unless someone looked at the numbers?"Well on a traditional HDD you also have to hope that they put Helium in it and not Mustard gas by mistake. It "can" happen, but how would we know if nobody opens every single HDD drive?
In a serious note, if a drive has such a serious firmware bug, rest assured that someone will notice, that it will go public quite fast and that it will end up getting fixed (like it has in the past).
Spunjji - Monday, December 7, 2020 - link
Thanks for responding to that "how do you know unless you look" post appropriately. That kind of woolly thinking really gets my goat.joesiv - Monday, December 7, 2020 - link
Well, I for one would rather not be the one that discovers the bug, and lose my data.I didn't experience this one, but it's an example of a firmware bug:
https://www.engadget.com/2020-03-25-hpe-ssd-bricke...
Where I work, I'm involved in SSD evaluation. A drive we used in the field had a nasty firmware bug, that took out dozens of our SSD's after a couple years of operation (that was well within their specs), The manufacturer fixed it in a firmware update, but not until a year + after release, so we shipped hundreds of product.
Knowing that, I evaluate them now. But for my personal use, where my needs are different, I'd love it if at least a very simple check was done in the reviews. It's not that hard, review the SSD, then check to see if the writes to NAND is reasonable given the workload you gave it. It's right there in the smart data, it'll be in block sizes, so you might have to multiply it by the block size, but it'll tell you a lot.
Just by doing something similar, we were able to vet a drive that was writing 100x more to NAND than it should have been, essentially it was using up it's life expectancy 1% per day! Working with the manufacturer, they eventually decided we should just move to another product, they weren't much into firmware fixes.
Anyways, someone should keep the manufactuers honest, why not start with the reviews?
Also, no offence, but what is the "wolly thinking" are you talking about? I'm just trying to protect my investment and data.
heffeque - Tuesday, December 8, 2020 - link
As if HDD didn't have their share of problems, both firmware and HW (especially the HW). I've seen loads of HDD die in the first 48 hours, then a huge percentage of them no later than a year afterwards.My experience is that SDD last A LOT longer and are A LOT more reliable than HDD.
While HDD had been braking every 1-3 years (and changing them was a high cost due to the remote location, and the high wages of Scandinavian countries), when we changed to SSD we had literally ZERO replacements to perform since then so... can't say that the experience with hundreds of SSD not failing vs hundreds of HDD that barely last a few years goes in favor of HDD in any kind of measure.
In the end, paying to send to those countries a slightly more expensive device (the SSD) has payed for itself several-fold in just a couple of years.
MDD1963 - Friday, December 4, 2020 - link
I've only averaged .8 TB per *month* over 3.5 years....joesiv - Monday, December 7, 2020 - link
Out of curiousity, how did you come to this number?Just be aware that SMART data will track different things. You're probably right, but SMART data is manufactuer and model dependant, and sometimes they'll use the attributes differently. You really have to look up the smart documentation for your drive, to be sure they are calculating and using the attributes the way your smart data utility is labeling them as. Some manfacturers also don't track writes to NAND.
I would look at:
"writes to nand" or "lifetime writes to flash" - which for some kingston drives is attribute 233
"SSD Life Left" - which for some ADATA drives is 232 (ADATA), and Micron/Crucial might be is 202), this is actually usually calculated based on average block erase count against the rated block erase counts the NAND is rated for (3000ish for MLC, much less for 3d nand)
A lot of maufactuers haven't included the actual NAND writes in their SMART data, so it'd be hard to get to, and should be called out for it (Delkin, Crucial).
"Total host writes" is what the OS wrote, and what most viewers assume is what manufactuers are stating when they're talking about drive writes per day or TB a day. That's the amount of data that is fed to the SSD, not what is actually written to NAND.
Also realize that wear leveling routines can eat up SSD life as well. I'm not sure how SLC mode that newer firmwars have affects life expectancy/nand writes actually.
stanleyipkiss - Friday, December 4, 2020 - link
Honestly, if the prices of these QLC high-capacity drives would drop a bit, I would be all over them -- especially for NAS use. I just want to move away from spinning mechanical drives but when I can get a 18 TB drive at the same price of a 4-8 TB SSD, I will choose the larger drive.Just make them cheaper.
Also: I would love HIGHER capacity, and I WOULD pay for it... Micron had some drives and I'm sure some mainstream drives could be made available -- if you can squeeze 8TB onto M.2 then you could certainly put 16TB on a 2.5 inch drive.
DigitalFreak - Monday, December 7, 2020 - link
Ask and ye shall receive.https://www.pcgamer.com/sabrent-is-close-to-launch...
Xex360 - Friday, December 4, 2020 - link
The prices don't make any sense, you can get multiple drives for the same capacity but less money and more performance and reliability, and should cost more because they use more material.inighthawki - Friday, December 4, 2020 - link
At least for the sabrent drive, M.2 slots can be at a premium, so it makes perfect sense for a single drive to cost more than two smaller ones. On many systems being able to hook up that many drives would require a PCIe expansion card, and if you're not just bifurcating an existing 8x or 16x lane you would need a PCIe switch which is going to cost you hundreds of dollars at minimum.