Intel Ghost Canyon NUC9i9QNX Review: NUC 9 Extreme Realizes the SFF Dream
by Ganesh T S on April 16, 2020 8:05 AM ESTUL Benchmarks - PCMark, 3DMark, and VRMark
This section deals with a selection of the UL Futuremark benchmarks - PCMark 10, PCMark 8, and 3DMark. While the first two evaluate the system as a whole, 3DMark focuses on the graphics capabilities.
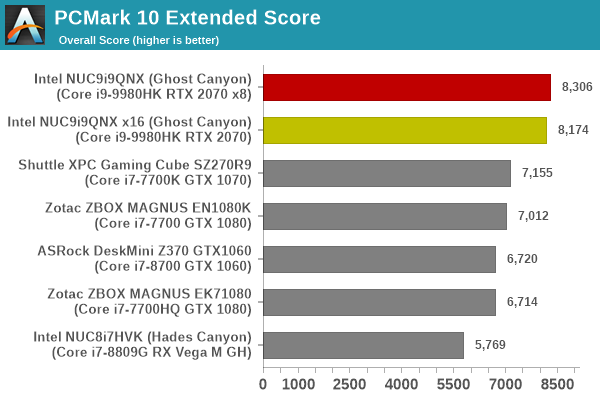
PCMark 10
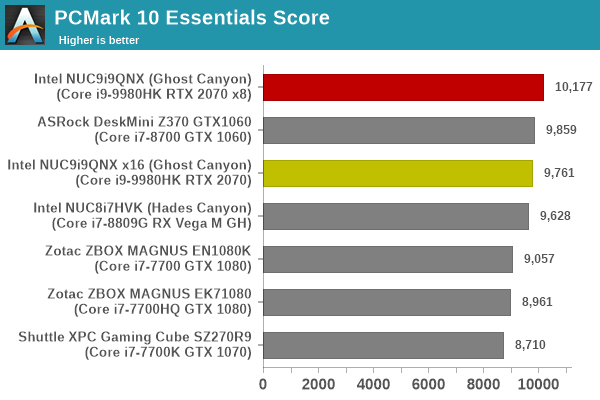
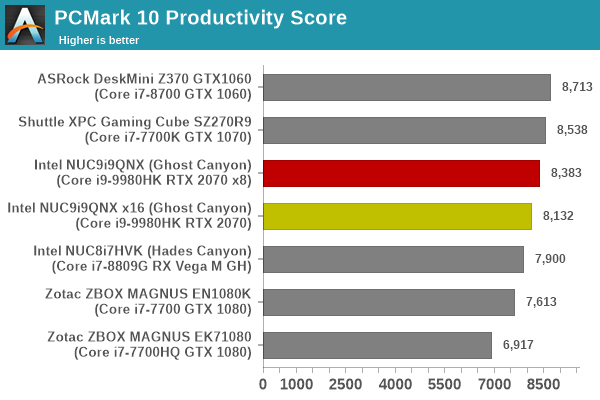
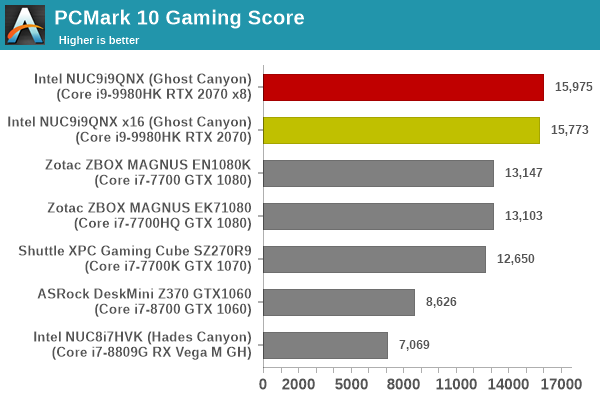
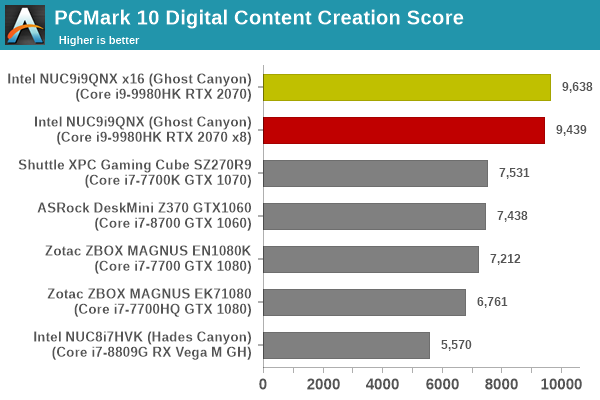
UL's PCMark 10 evaluates computing systems for various usage scenarios (generic / essential tasks such as web browsing and starting up applications, productivity tasks such as editing spreadsheets and documents, gaming, and digital content creation). We benchmarked select PCs with the PCMark 10 Extended profile and recorded the scores for various scenarios. These scores are heavily influenced by the CPU and GPU in the system, though the RAM and storage device also play a part. The power plan was set to Balanced for all the PCs while processing the PCMark 10 benchmark.
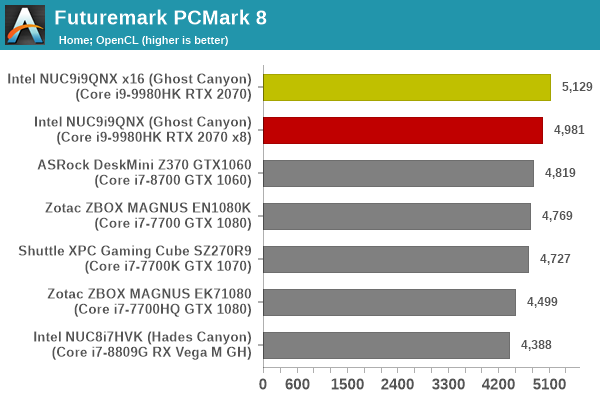
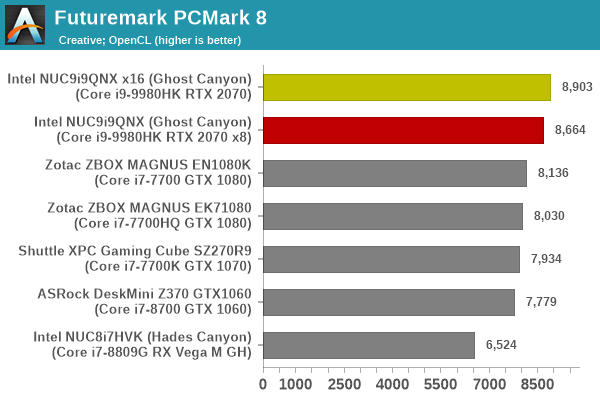
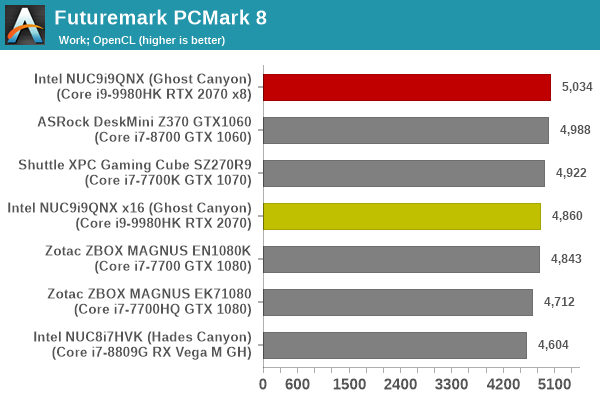
PCMark 8
We continue to present PCMark 8 benchmark results (as those have more comparison points) while our PCMark 10 scores database for systems grows in size. PCMark 8 provides various usage scenarios (home, creative and work) and offers ways to benchmark both baseline (CPU-only) as well as OpenCL accelerated (CPU + GPU) performance. We benchmarked select PCs for the OpenCL accelerated performance in all three usage scenarios.
UL's 3DMark comes with a diverse set of graphics workloads that target different Direct3D feature levels. Correspondingly, the rendering resolutions are also different. The VRMark benchmark targets virtual reality specifically. Its workloads are termed as 'rooms', with each one being a piece of VR content designed to require a specific level of VR performance. We used 3DMark 2.4.4264 and VRMark 1.2.1701 to get an idea of the graphics capabilities of various systems. In this section, we take a look at the performance of the Intel NUC9i9QNX (Ghost Canyon) on a comparative basis across the different workloads.
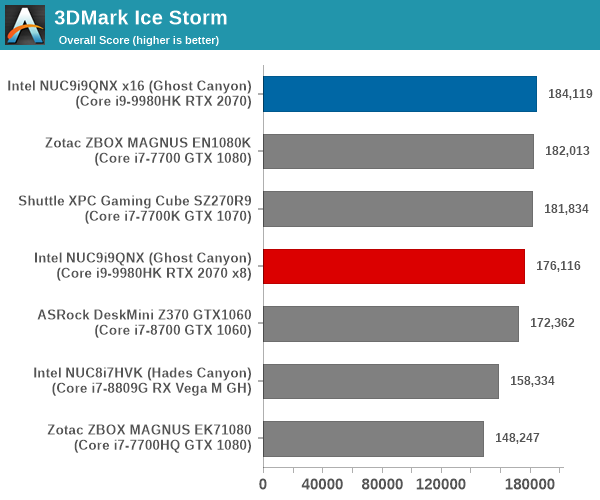
3DMark Ice Storm
This workload has three levels of varying complexity - the vanilla Ice Storm, Ice Storm Unlimited, and Ice Storm Extreme. It is a cross-platform benchmark (which means that the scores can be compared across different tablets and smartphones as well). All three use DirectX 11 (feature level 9) / OpenGL ES 2.0. While the Extreme renders at 1920 x 1080, the other two render at 1280 x 720. The graphs below present the various Ice Storm worloads' numbers for different systems that we have evaluated.
| UL 3DMark - Ice Storm Workloads | |||
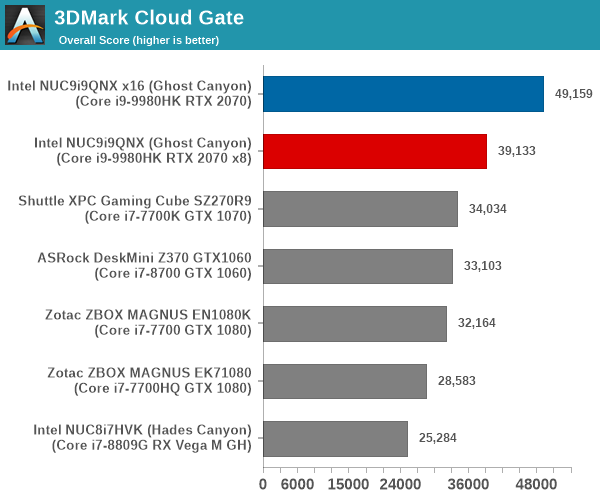
3DMark Cloud Gate
The Cloud Gate workload is meant for notebooks and typical home PCs, and uses DirectX 11 (feature level 10) to render frames at 1280 x 720. The graph below presents the overall score for the workload across all the systems that are being compared.
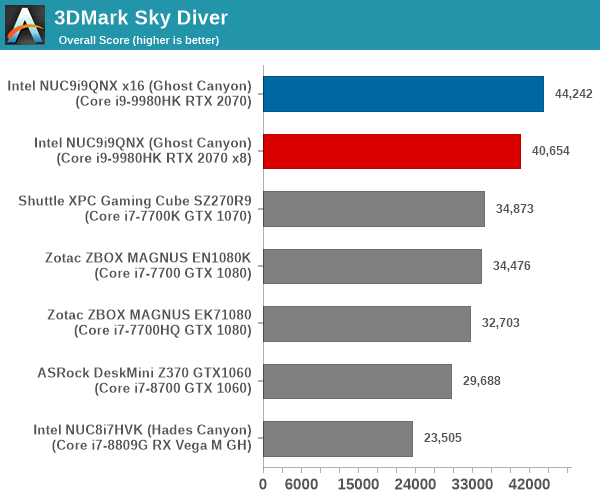
3DMark Sky Diver
The Sky Diver workload is meant for gaming notebooks and mid-range PCs, and uses DirectX 11 (feature level 11) to render frames at 1920 x 1080. The graph below presents the overall score for the workload across all the systems that are being compared.
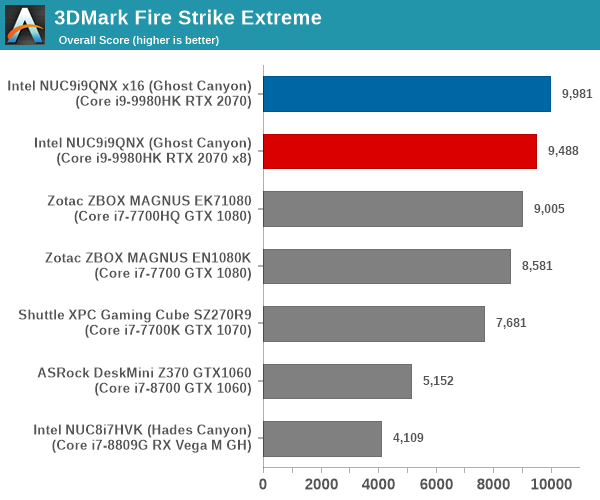
3DMark Fire Strike Extreme
The Fire Strike benchmark has three workloads. The base version is meant for high-performance gaming PCs. Similar to Sky Diver, it uses DirectX 11 (feature level 11) to render frames at 1920 x 1080. The Ultra version targets 4K gaming system, and renders at 3840 x 2160. However, we only deal with the Extreme version in our benchmarking - It renders at 2560 x 1440, and targets multi-GPU systems and overclocked PCs. The graph below presents the overall score for the Fire Strike Extreme benchmark across all the systems that are being compared.
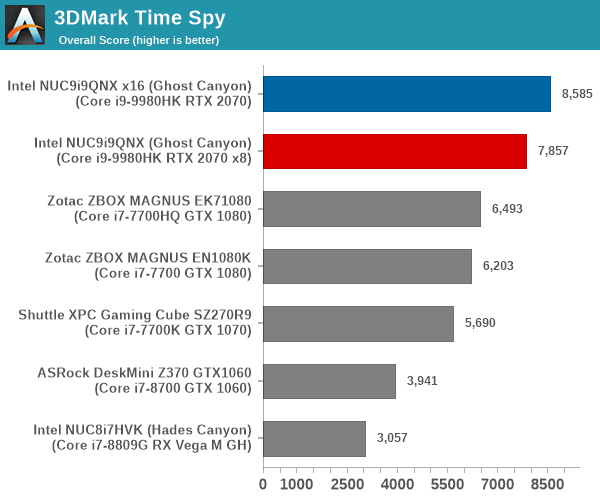
3DMark Time Spy
The Time Spy workload has two levels with different complexities. Both use DirectX 12 (feature level 11). However, the plain version targets high-performance gaming PCs with a 2560 x 1440 render resolution, while the Extreme version renders at 3840 x 2160 resolution. The graphs below present both numbers for all the systems that are being compared in this review.
| UL 3DMark - Time Spy Workloads | |||
The VRMark Professional Edition comes with three rooms. Each room can be run either in desktop or HMD mode, with varying minimum requirements for the same workload. The benchmark results include the average FPS achieved, and a score based on the FPS. A pass or fail indicator is also provided based on whether the average FPS exceeds the required FPS. In this section, we take a look at the performance of the Intel NUC9i9QNX (Ghost Canyon) on a comparative basis across the three workloads in desktop mode.
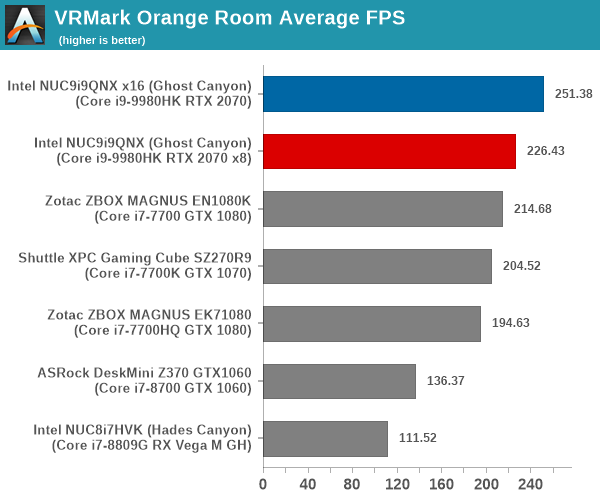
VRMark Orange Room
The Orange Room is meant to test the effectiveness of a system for handling the requirements of the HTC Vive and the Oculus Rift. The recommended hardware for both VR HMDs should be able to easily achieve the desired target FPS (88.9 fps). However, in the desktop mode, the target performance is 109 fps without any frame drops. Systems benching with an average FPS lesser than that are deemed to have failed the VRMark Orange Room benchmark. The graphs below present the average FPS and score for the different systems being considered today.
| UL VRMark - Orange Room | |||
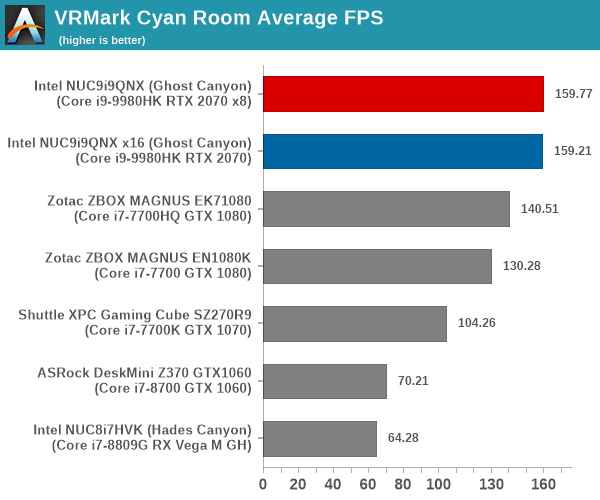
VRMark Cyan Room
The Cyan Room sits between the Orange and Blue rooms in complexity. It is a DirectX 12 benchmark. Similar to the Orange room, the target metrics are 88.9 fps on HMDs and 109 fps on the desktop monitor. The graphs below present the average FPS and score for the different systems being considered today.
| UL VRMark - Cyan Room | |||
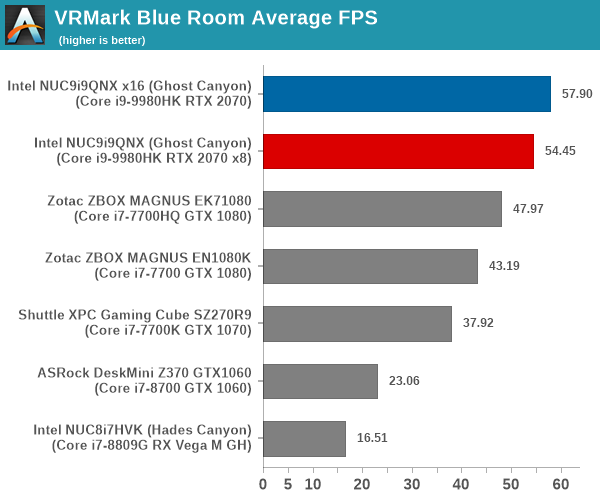
VRMark Blue Room
The Blue Room is the most demanding of the three workloads. At the time of introduction of VRMark in October 2016, no publicly available system running as sold was able to pass the test. The Ghost Canyon NUC configuration with the RTX 2070 performs better than any previously benchmarked system, but it still doesn't meet the requirements to pass the VRMark Blue Room test.
The performance of a system in this benchmark is an indicator of its VR-readiness for future generation of HMDs. Similar to the other workloads, the passing performance metrics are 88.9 fps on HMDs and 109 fps on desktop monitors. The complexity of the workload is due to the higher resolution (5012 x 2880) and additional geometry making it necessary to increase the number of Direct3D API calls. The graphs below present the average FPS and score for the different systems being considered today.
| UL VRMark - Blue Room | |||


109 Comments
View All Comments
Namisecond - Friday, April 17, 2020 - link
Thirded, the sandwich design the Dancase A4 popularized really revolutionized the DIY SFF world. We are living in the golden age of DIY SFF. :)Namisecond - Friday, April 17, 2020 - link
In this case, what is Intel offering for their for their roughly $500-$600 plastic chassis and proprietary unbranded PSU? Superior Intel marketing? I feel your Dan A4 analogy sarcasm is spot on, but I think the reasons it's spot on does not extend to the NUC 9.imaheadcase - Thursday, April 16, 2020 - link
Unless you got some very specific need for this, not worth getting. Lots of these are used for home media streaming setups, so needing something this powerful is overkill. You can get 4k streaming/movies or whatever on the price of a low end 5 year old NUC or more.BlazingDragon - Thursday, April 16, 2020 - link
Agreed.The seems like the result of a "hey, we could do this" thought process, rather than "we should do this"...
Massively overpriced for home use.... Enthusiasts will build their own, much cheaper and more capable system, and normal buyers will never pay this much... they could just buy a much cheaper standard PC [for GPU], or a much cheaper Intel NUC8 or NUC10 [or Zotac, etc., equivalent] if gfx performance is not important.
GamersNexus has a detailed review on Youtube which aligns with the above.
Maybe the Xeon based Quartz Canyon will find business customers who need/value the small size, but I'm not convinced...
For anyone interested, prices for all NUC9 models are available [and for pre-order] here: shopblt.com
Deicidium369 - Friday, April 17, 2020 - link
Agreed - like I said I have no clue what the use case for this is. Even the Xeon unit...erinadreno - Thursday, April 16, 2020 - link
There are plenty of sff itx case, I mean really sff case(4~6L), out there. They cost from $30 to $200, plus a $120 Enhanced 7660b, which is a 600w PSU instead of 500. Standard high end itx boards costs $300 at best. If you spend the same $1500 on those stuff, you'd left south of 1000 bucks. Heck, you can even get a Xeon 8136 28c CPU at this point (although your only option for motherboard is that ONE ASRock server board and some janky coolers).I just don't see the value of this okay-sized box in 2020. As in the past couple years the itx market just expand that much. Just give up on graphics and buy a regular nuc or build your own stuff.
pixelstuff - Thursday, April 16, 2020 - link
That seems really large for a "Next Unit of Computing" classification.Deicidium369 - Friday, April 17, 2020 - link
Agreed - for me the NUC is the 4.5"x4.5" units - even the Hades Canyon to me doesn't meet the classification.Oxford Guy - Friday, April 17, 2020 - link
My dream is for people to mature enough to demand that Intel not be idiotic enough to put skulls on things.Cullinaire - Friday, April 17, 2020 - link
How about a pelvis instead?