Intel Ghost Canyon NUC9i9QNX Review: NUC 9 Extreme Realizes the SFF Dream
by Ganesh T S on April 16, 2020 8:05 AM ESTUL Benchmarks - PCMark, 3DMark, and VRMark
This section deals with a selection of the UL Futuremark benchmarks - PCMark 10, PCMark 8, and 3DMark. While the first two evaluate the system as a whole, 3DMark focuses on the graphics capabilities.
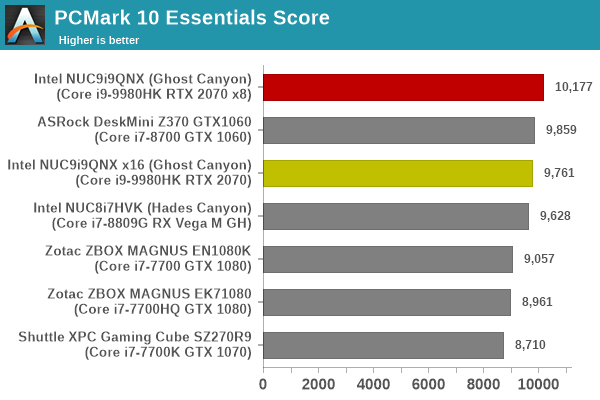
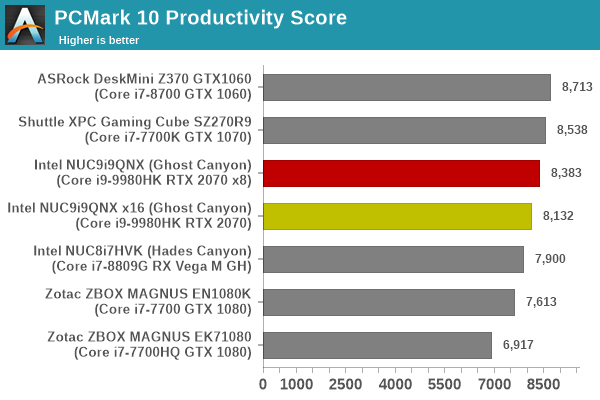
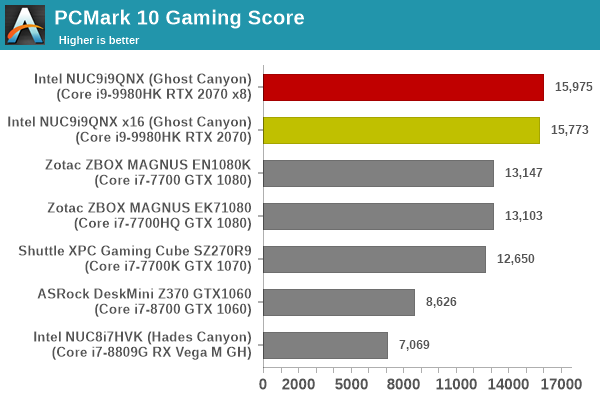
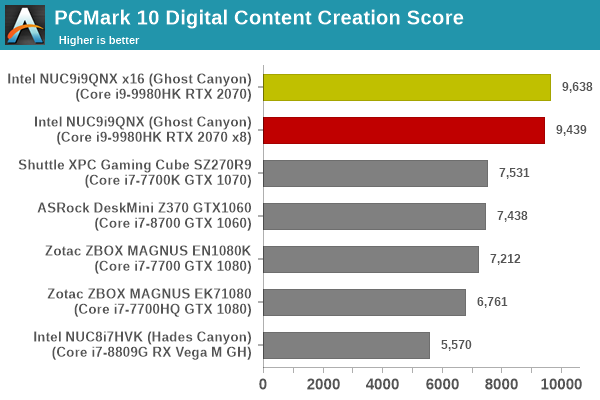
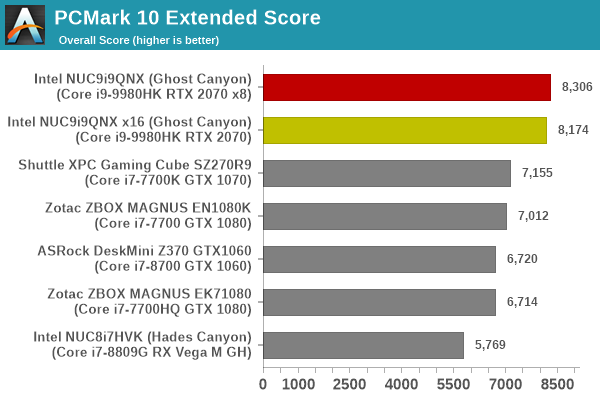
PCMark 10
UL's PCMark 10 evaluates computing systems for various usage scenarios (generic / essential tasks such as web browsing and starting up applications, productivity tasks such as editing spreadsheets and documents, gaming, and digital content creation). We benchmarked select PCs with the PCMark 10 Extended profile and recorded the scores for various scenarios. These scores are heavily influenced by the CPU and GPU in the system, though the RAM and storage device also play a part. The power plan was set to Balanced for all the PCs while processing the PCMark 10 benchmark.
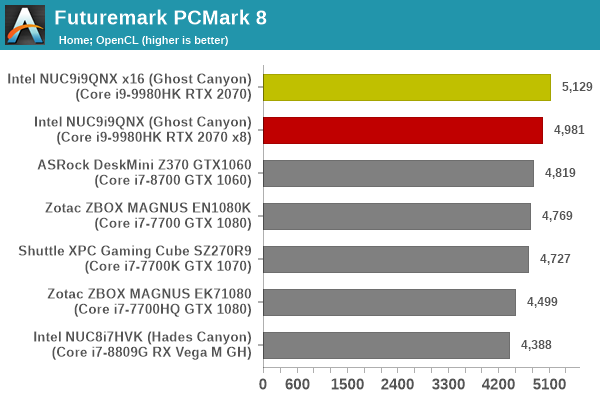
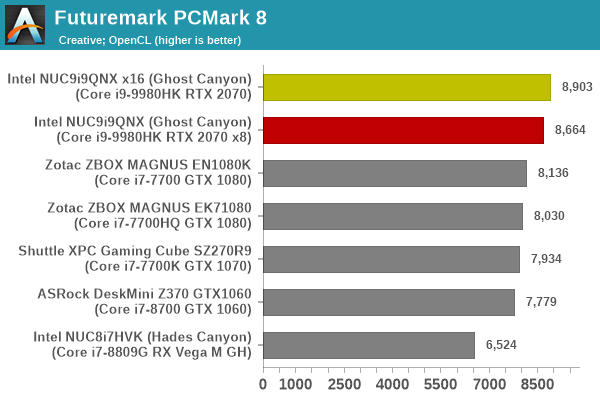
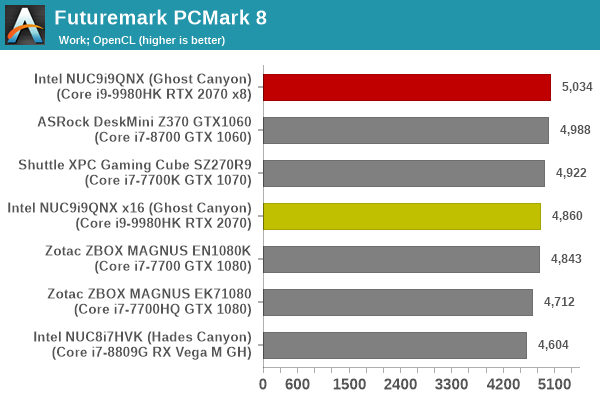
PCMark 8
We continue to present PCMark 8 benchmark results (as those have more comparison points) while our PCMark 10 scores database for systems grows in size. PCMark 8 provides various usage scenarios (home, creative and work) and offers ways to benchmark both baseline (CPU-only) as well as OpenCL accelerated (CPU + GPU) performance. We benchmarked select PCs for the OpenCL accelerated performance in all three usage scenarios.
UL's 3DMark comes with a diverse set of graphics workloads that target different Direct3D feature levels. Correspondingly, the rendering resolutions are also different. The VRMark benchmark targets virtual reality specifically. Its workloads are termed as 'rooms', with each one being a piece of VR content designed to require a specific level of VR performance. We used 3DMark 2.4.4264 and VRMark 1.2.1701 to get an idea of the graphics capabilities of various systems. In this section, we take a look at the performance of the Intel NUC9i9QNX (Ghost Canyon) on a comparative basis across the different workloads.
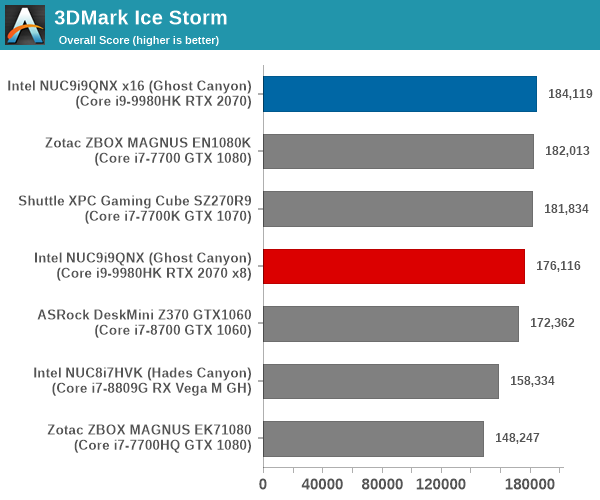
3DMark Ice Storm
This workload has three levels of varying complexity - the vanilla Ice Storm, Ice Storm Unlimited, and Ice Storm Extreme. It is a cross-platform benchmark (which means that the scores can be compared across different tablets and smartphones as well). All three use DirectX 11 (feature level 9) / OpenGL ES 2.0. While the Extreme renders at 1920 x 1080, the other two render at 1280 x 720. The graphs below present the various Ice Storm worloads' numbers for different systems that we have evaluated.
| UL 3DMark - Ice Storm Workloads | |||
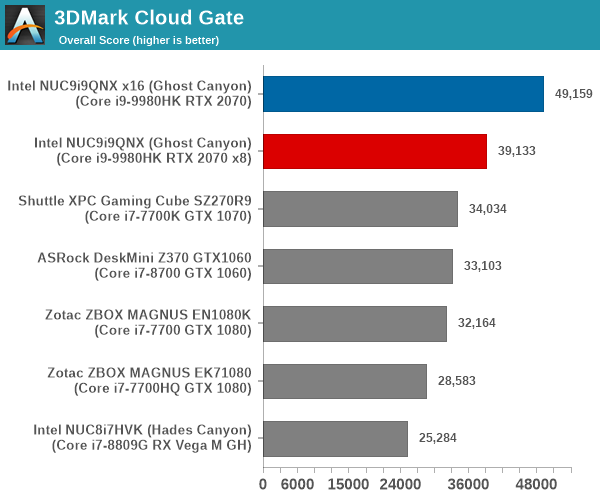
3DMark Cloud Gate
The Cloud Gate workload is meant for notebooks and typical home PCs, and uses DirectX 11 (feature level 10) to render frames at 1280 x 720. The graph below presents the overall score for the workload across all the systems that are being compared.
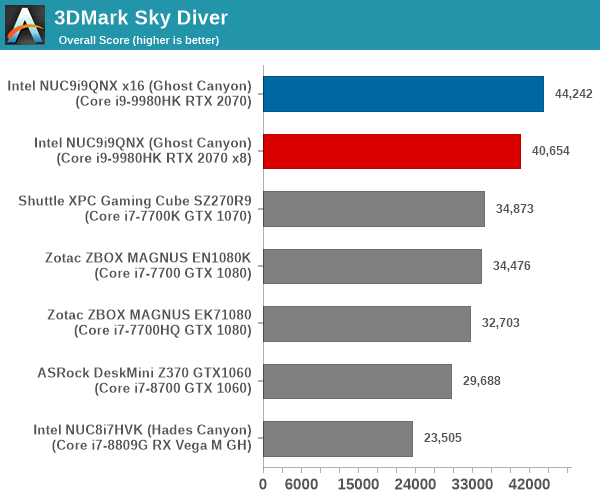
3DMark Sky Diver
The Sky Diver workload is meant for gaming notebooks and mid-range PCs, and uses DirectX 11 (feature level 11) to render frames at 1920 x 1080. The graph below presents the overall score for the workload across all the systems that are being compared.
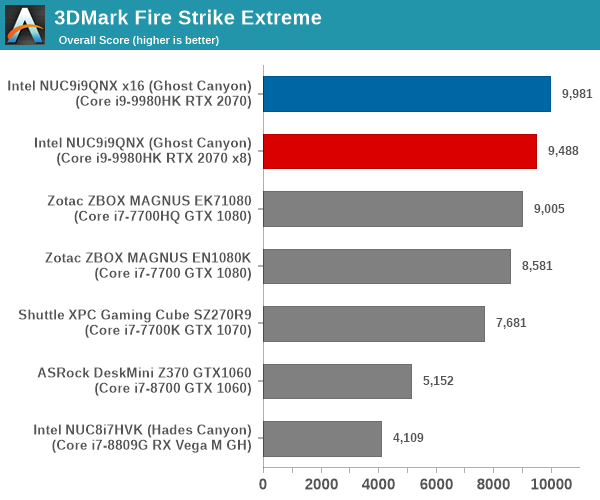
3DMark Fire Strike Extreme
The Fire Strike benchmark has three workloads. The base version is meant for high-performance gaming PCs. Similar to Sky Diver, it uses DirectX 11 (feature level 11) to render frames at 1920 x 1080. The Ultra version targets 4K gaming system, and renders at 3840 x 2160. However, we only deal with the Extreme version in our benchmarking - It renders at 2560 x 1440, and targets multi-GPU systems and overclocked PCs. The graph below presents the overall score for the Fire Strike Extreme benchmark across all the systems that are being compared.
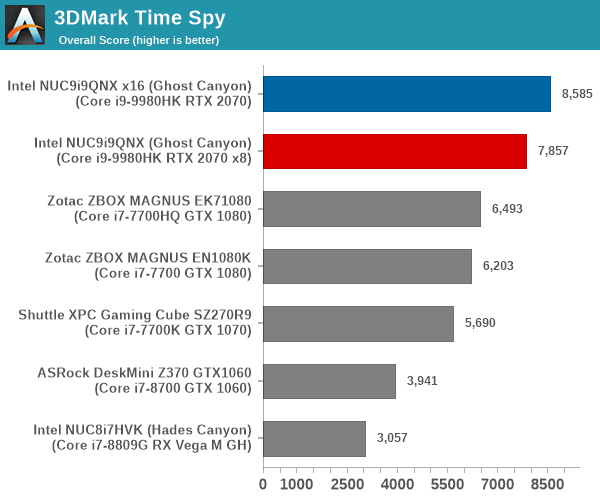
3DMark Time Spy
The Time Spy workload has two levels with different complexities. Both use DirectX 12 (feature level 11). However, the plain version targets high-performance gaming PCs with a 2560 x 1440 render resolution, while the Extreme version renders at 3840 x 2160 resolution. The graphs below present both numbers for all the systems that are being compared in this review.
| UL 3DMark - Time Spy Workloads | |||
The VRMark Professional Edition comes with three rooms. Each room can be run either in desktop or HMD mode, with varying minimum requirements for the same workload. The benchmark results include the average FPS achieved, and a score based on the FPS. A pass or fail indicator is also provided based on whether the average FPS exceeds the required FPS. In this section, we take a look at the performance of the Intel NUC9i9QNX (Ghost Canyon) on a comparative basis across the three workloads in desktop mode.
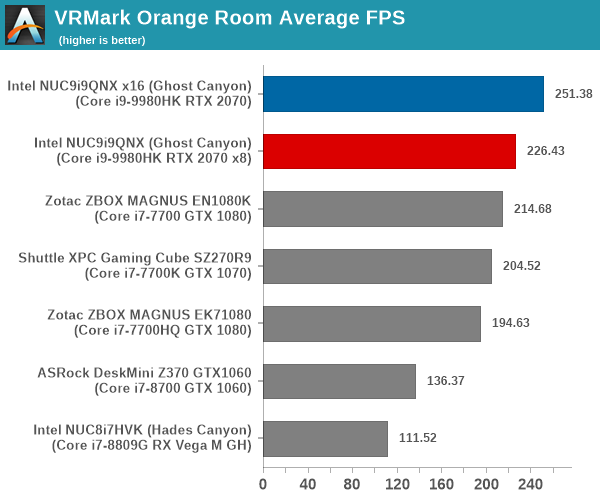
VRMark Orange Room
The Orange Room is meant to test the effectiveness of a system for handling the requirements of the HTC Vive and the Oculus Rift. The recommended hardware for both VR HMDs should be able to easily achieve the desired target FPS (88.9 fps). However, in the desktop mode, the target performance is 109 fps without any frame drops. Systems benching with an average FPS lesser than that are deemed to have failed the VRMark Orange Room benchmark. The graphs below present the average FPS and score for the different systems being considered today.
| UL VRMark - Orange Room | |||
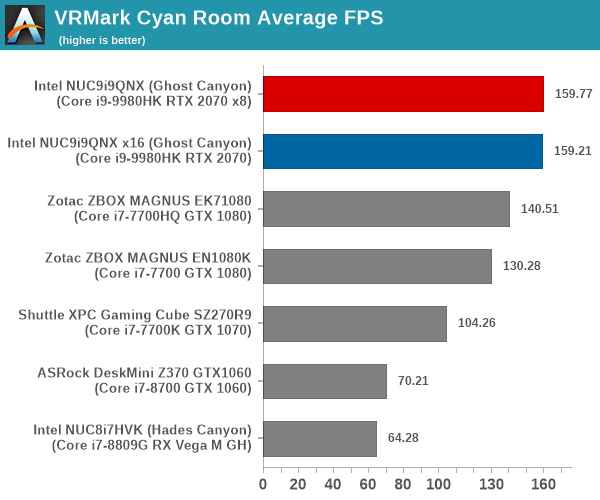
VRMark Cyan Room
The Cyan Room sits between the Orange and Blue rooms in complexity. It is a DirectX 12 benchmark. Similar to the Orange room, the target metrics are 88.9 fps on HMDs and 109 fps on the desktop monitor. The graphs below present the average FPS and score for the different systems being considered today.
| UL VRMark - Cyan Room | |||
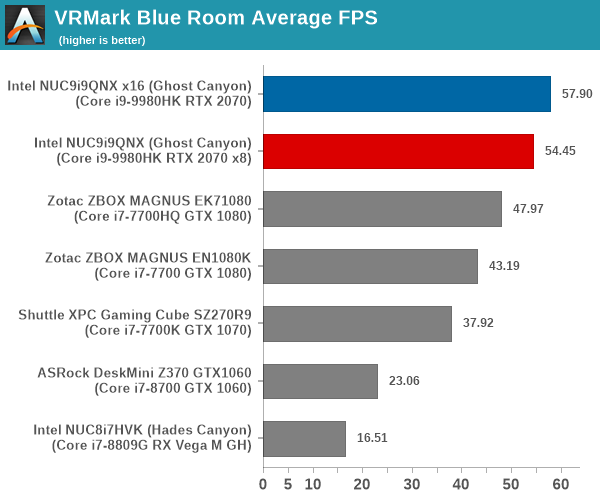
VRMark Blue Room
The Blue Room is the most demanding of the three workloads. At the time of introduction of VRMark in October 2016, no publicly available system running as sold was able to pass the test. The Ghost Canyon NUC configuration with the RTX 2070 performs better than any previously benchmarked system, but it still doesn't meet the requirements to pass the VRMark Blue Room test.
The performance of a system in this benchmark is an indicator of its VR-readiness for future generation of HMDs. Similar to the other workloads, the passing performance metrics are 88.9 fps on HMDs and 109 fps on desktop monitors. The complexity of the workload is due to the higher resolution (5012 x 2880) and additional geometry making it necessary to increase the number of Direct3D API calls. The graphs below present the average FPS and score for the different systems being considered today.
| UL VRMark - Blue Room | |||


109 Comments
View All Comments
ganeshts - Friday, April 17, 2020 - link
Let me indulge you. Where are the positives exaggerated? In the concluding remarks section, number of pros = number of cons. The last paragraph even mentions the pricing aspect that is not touched upon in the pros and cons. Where are the negatives that I have not dwelt upon?Deicidium369 - Friday, April 17, 2020 - link
You did fine Ganesh -The kiddies won't be happy unless you totally crap on Intel and exalt the wonderfulness that is AMD.
I am a huge NUC fan - the 4.5"x4.5" NUCs - the reviewed unit is NUC in name only - and I have no clue what the use case is.
Korguz - Friday, April 17, 2020 - link
and a huge intel fan, obviously, in your posts on tom's show this. thats why you exalt the wonderfulness that is intelDeicidium369 - Sunday, April 19, 2020 - link
Admins - can you have a talk with Jimmy, he is becoming unhinged, and is stalking me.Korguz - Sunday, April 19, 2020 - link
its just funny, you get called out on your BS there, so you come here, and try to spread your bs here as well.GreenReaper - Sunday, May 10, 2020 - link
Come now. His name is clearly Korguz, not Jimmy.Reflex - Thursday, April 16, 2020 - link
I have one of these: https://www.dan-cases.com/Full mITX in only 7.2L. It's fantastic, and I was able to build a Ryzen with full length GTX1080 no problem last year.
1_rick - Thursday, April 16, 2020 - link
The Dan A4 is $220. What a ripoff, when I can buy a Rosewill case AND get a PSU for $50!(Not really, but that's the same thing a lot of people are saying.)
jtd871 - Friday, April 17, 2020 - link
That's what they will say until they own one.I was a KS backer of the DAN A4 v1 (silver). The KS price ended up very close to USD$280 after conversion from EUR, which did give me some pause at the time, but I really wanted it (and IIRC the initial KS run met goal in like 10 minutes after it opened). Still totally worth it IMO.
I dare Rosewill to ever produce anything this classy.
The DAN A4 KS cases shipped about this time *4 years ago*. So Intel really dropped the ball with their thermal design on this one, as far as I am concerned as the "sandwich" design has been in the wild for a long time. Keep up the mediocrity, Intel.
Reflex - Friday, April 17, 2020 - link
Going to second this. The Dan case is incredibly high quality, can accomodate water cooling (not my thing), is well thought out internally with lots of places to stash SSD's and so on, has great airflow/heat characteristics and can be built to be nearly silent even with a powerful CPU/GPU combo.I'm incredibly happy with mine. And unless a person upgrades thier case routinely, the price isn't a big deal