Intel Ghost Canyon NUC9i9QNX Review: NUC 9 Extreme Realizes the SFF Dream
by Ganesh T S on April 16, 2020 8:05 AM ESTUL Benchmarks - PCMark, 3DMark, and VRMark
This section deals with a selection of the UL Futuremark benchmarks - PCMark 10, PCMark 8, and 3DMark. While the first two evaluate the system as a whole, 3DMark focuses on the graphics capabilities.
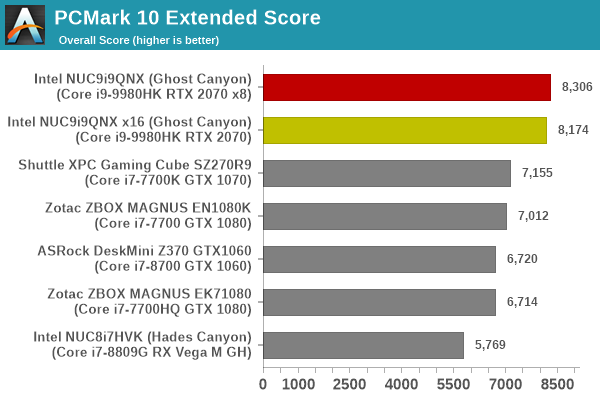
PCMark 10
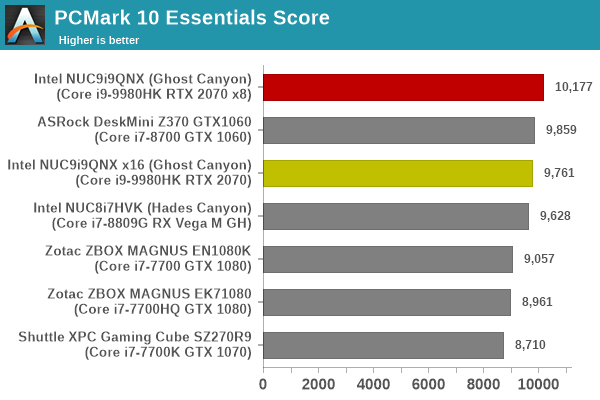
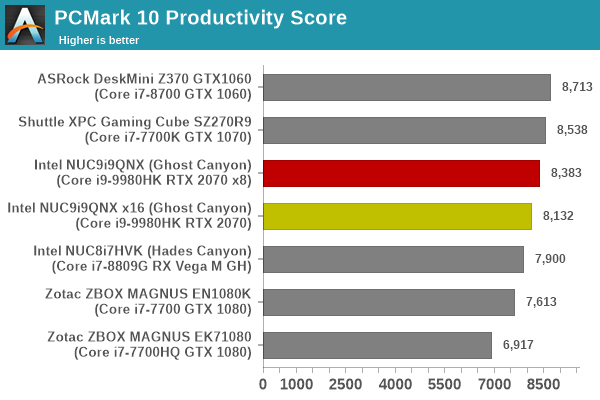
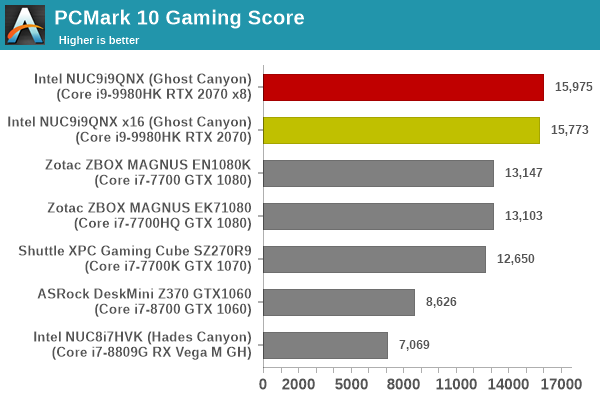
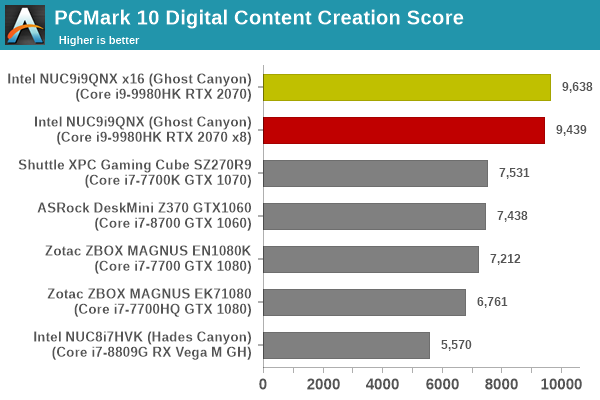
UL's PCMark 10 evaluates computing systems for various usage scenarios (generic / essential tasks such as web browsing and starting up applications, productivity tasks such as editing spreadsheets and documents, gaming, and digital content creation). We benchmarked select PCs with the PCMark 10 Extended profile and recorded the scores for various scenarios. These scores are heavily influenced by the CPU and GPU in the system, though the RAM and storage device also play a part. The power plan was set to Balanced for all the PCs while processing the PCMark 10 benchmark.
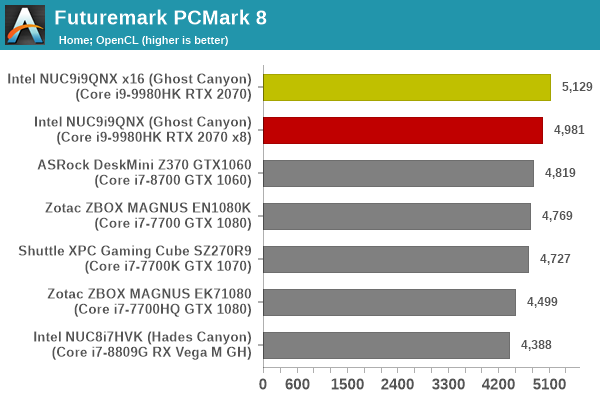
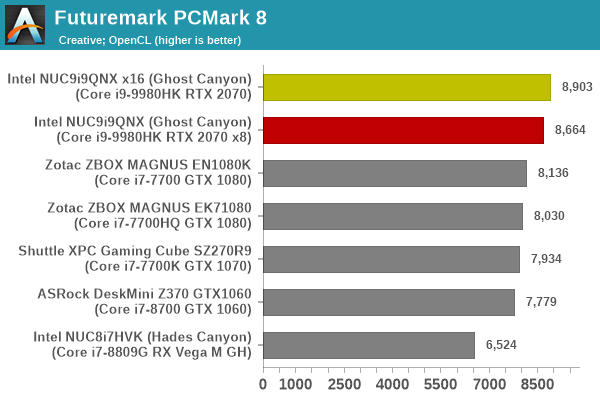
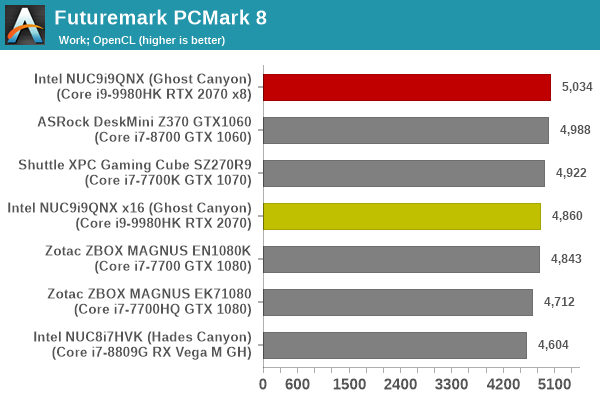
PCMark 8
We continue to present PCMark 8 benchmark results (as those have more comparison points) while our PCMark 10 scores database for systems grows in size. PCMark 8 provides various usage scenarios (home, creative and work) and offers ways to benchmark both baseline (CPU-only) as well as OpenCL accelerated (CPU + GPU) performance. We benchmarked select PCs for the OpenCL accelerated performance in all three usage scenarios.
UL's 3DMark comes with a diverse set of graphics workloads that target different Direct3D feature levels. Correspondingly, the rendering resolutions are also different. The VRMark benchmark targets virtual reality specifically. Its workloads are termed as 'rooms', with each one being a piece of VR content designed to require a specific level of VR performance. We used 3DMark 2.4.4264 and VRMark 1.2.1701 to get an idea of the graphics capabilities of various systems. In this section, we take a look at the performance of the Intel NUC9i9QNX (Ghost Canyon) on a comparative basis across the different workloads.
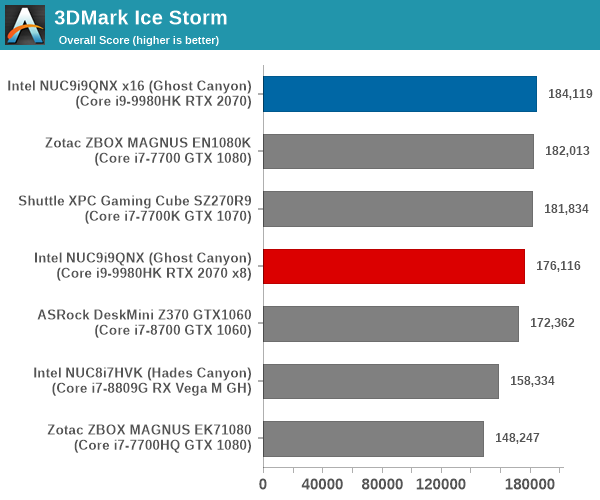
3DMark Ice Storm
This workload has three levels of varying complexity - the vanilla Ice Storm, Ice Storm Unlimited, and Ice Storm Extreme. It is a cross-platform benchmark (which means that the scores can be compared across different tablets and smartphones as well). All three use DirectX 11 (feature level 9) / OpenGL ES 2.0. While the Extreme renders at 1920 x 1080, the other two render at 1280 x 720. The graphs below present the various Ice Storm worloads' numbers for different systems that we have evaluated.
| UL 3DMark - Ice Storm Workloads | |||
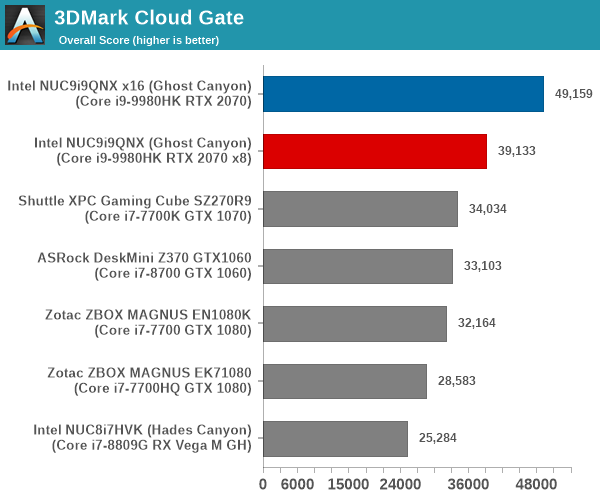
3DMark Cloud Gate
The Cloud Gate workload is meant for notebooks and typical home PCs, and uses DirectX 11 (feature level 10) to render frames at 1280 x 720. The graph below presents the overall score for the workload across all the systems that are being compared.
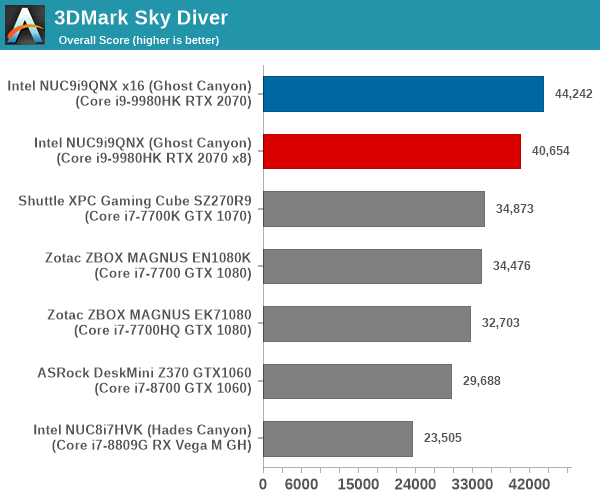
3DMark Sky Diver
The Sky Diver workload is meant for gaming notebooks and mid-range PCs, and uses DirectX 11 (feature level 11) to render frames at 1920 x 1080. The graph below presents the overall score for the workload across all the systems that are being compared.
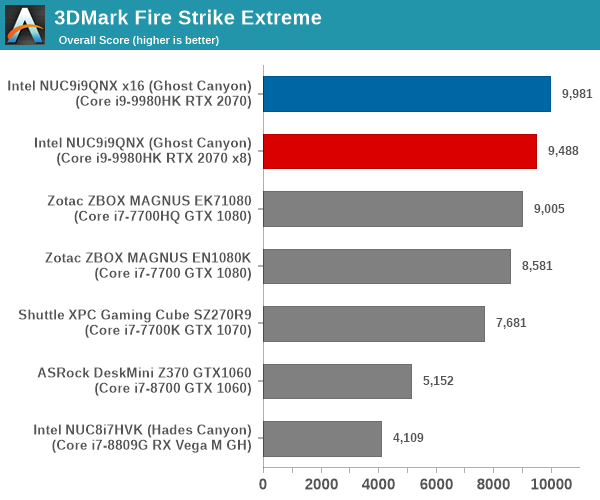
3DMark Fire Strike Extreme
The Fire Strike benchmark has three workloads. The base version is meant for high-performance gaming PCs. Similar to Sky Diver, it uses DirectX 11 (feature level 11) to render frames at 1920 x 1080. The Ultra version targets 4K gaming system, and renders at 3840 x 2160. However, we only deal with the Extreme version in our benchmarking - It renders at 2560 x 1440, and targets multi-GPU systems and overclocked PCs. The graph below presents the overall score for the Fire Strike Extreme benchmark across all the systems that are being compared.
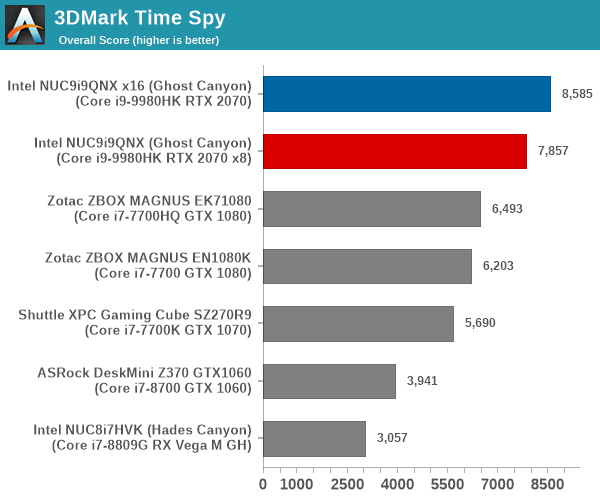
3DMark Time Spy
The Time Spy workload has two levels with different complexities. Both use DirectX 12 (feature level 11). However, the plain version targets high-performance gaming PCs with a 2560 x 1440 render resolution, while the Extreme version renders at 3840 x 2160 resolution. The graphs below present both numbers for all the systems that are being compared in this review.
| UL 3DMark - Time Spy Workloads | |||
The VRMark Professional Edition comes with three rooms. Each room can be run either in desktop or HMD mode, with varying minimum requirements for the same workload. The benchmark results include the average FPS achieved, and a score based on the FPS. A pass or fail indicator is also provided based on whether the average FPS exceeds the required FPS. In this section, we take a look at the performance of the Intel NUC9i9QNX (Ghost Canyon) on a comparative basis across the three workloads in desktop mode.
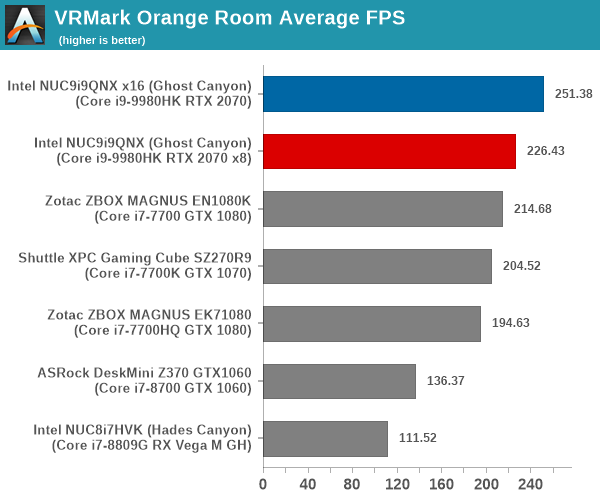
VRMark Orange Room
The Orange Room is meant to test the effectiveness of a system for handling the requirements of the HTC Vive and the Oculus Rift. The recommended hardware for both VR HMDs should be able to easily achieve the desired target FPS (88.9 fps). However, in the desktop mode, the target performance is 109 fps without any frame drops. Systems benching with an average FPS lesser than that are deemed to have failed the VRMark Orange Room benchmark. The graphs below present the average FPS and score for the different systems being considered today.
| UL VRMark - Orange Room | |||
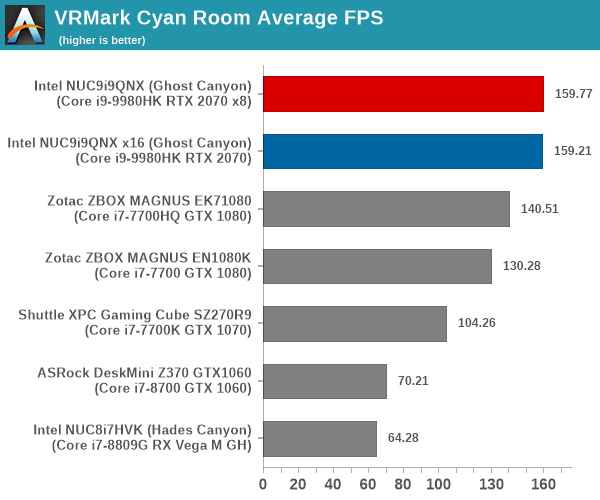
VRMark Cyan Room
The Cyan Room sits between the Orange and Blue rooms in complexity. It is a DirectX 12 benchmark. Similar to the Orange room, the target metrics are 88.9 fps on HMDs and 109 fps on the desktop monitor. The graphs below present the average FPS and score for the different systems being considered today.
| UL VRMark - Cyan Room | |||
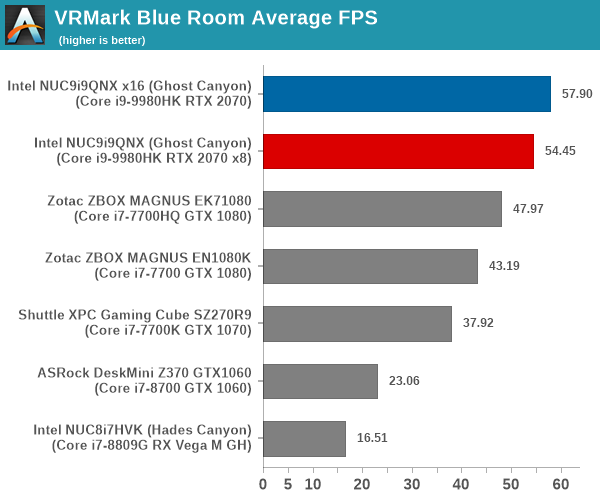
VRMark Blue Room
The Blue Room is the most demanding of the three workloads. At the time of introduction of VRMark in October 2016, no publicly available system running as sold was able to pass the test. The Ghost Canyon NUC configuration with the RTX 2070 performs better than any previously benchmarked system, but it still doesn't meet the requirements to pass the VRMark Blue Room test.
The performance of a system in this benchmark is an indicator of its VR-readiness for future generation of HMDs. Similar to the other workloads, the passing performance metrics are 88.9 fps on HMDs and 109 fps on desktop monitors. The complexity of the workload is due to the higher resolution (5012 x 2880) and additional geometry making it necessary to increase the number of Direct3D API calls. The graphs below present the average FPS and score for the different systems being considered today.
| UL VRMark - Blue Room | |||


109 Comments
View All Comments
AdditionalPylons - Thursday, April 16, 2020 - link
The statement about noise is in the second last paragraph on page 3, here: https://www.servethehome.com/intel-nuc9vxqnx-nuc-r...but now that I read it again I realise it was probably without GPU, which naturally adds power draw and noise.
Ganesh, would it be possible for you to measure the noise with and without the GPU?
Spunjji - Friday, April 24, 2020 - link
I was interested in this aspect, too. The thermal module on the CPU doesn't look very promising, but the TDP is fairly low...leonlee - Thursday, April 16, 2020 - link
Thanks for putting this article together. Regarding optimizing for power delivery, what sort of approaches are in the works now? I imagine the low hanging fruit might be encouraging case manufacturers to integrate PSU wiring for space efficiency or aesthetics.cyrusfox - Thursday, April 16, 2020 - link
Biggest take away I see is at half the lanes, you still have 97% of the GPU performance in terms of frame rates. Thanks for the testing.For those looking for pictures, I would recommend Storage reviews write up - https://www.storagereview.com/review/intel-nuc-9-p...
If you want this in video form, where they specifically talked about noise from the NUC(It is surprisingly quiet even at load), I would say go check out Gamers Nexus video review - https://www.youtube.com/watch?v=CCoLJeUbZTc
Thank you Anandtech for getting out your review!
Operandi - Thursday, April 16, 2020 - link
Over priced Intel Junk. I know its trendy to dump on Intel but man this is just poorly designed overpriced garbage and thats too bad because the industry needs new ideas and form factors.Instead of the tiny blower heatsink being built into the compute element the cooling aspect should be part of the case. A front mounted 80 or 92mm fan that channels the air across a short heatpipe equipped heatsink, something like what is done in 1 and 2U servers. There could even be different tiers of chassis that would support larger cooling solutions that would support more powerful compute elements and larger GPUs. A design like this would create a new ecosystem with a wide variety or products for different uses and provide a way for partners to differentiate themselves.
AMD; work with some partners and build this.
Deicidium369 - Thursday, April 16, 2020 - link
The "partners" would rather work on something that would, you know, sell.Korguz - Friday, April 17, 2020 - link
man you are such an intel fanboy the way you bash AMD. looks like you gave up on the other thread you kept posing in cause the others put too much proof, and you had nothing else left to pro intel BS about.Deicidium369 - Friday, April 17, 2020 - link
Jimmy, go clean the basement. And you are such an AMD Fanboi.FACT - Intel sells 10:1 vs AMD - so do you go for 90% of the market or 10% of the market
I would BET that I have more and more current AMD systems than you do.
Korguz - Friday, April 17, 2020 - link
your " facts " are BS, just like was pointed out on the toms forums" I would BET that I have more and more current AMD systems than you do." and that is supposed to impress me ? or prove something ? who cares your post, regardless of what computers you claim to have, reek with anti AMD and are pro intel.
Korguz - Friday, April 17, 2020 - link
thats why you havent replied to any of the comments on the other thread about the 4900hs review, because your facts are BS, and you know it