Intel NUC10i7FNH Frost Canyon Review: Hexa-Core NUC Delivers a Mixed Bag
by Ganesh T S on March 2, 2020 9:00 AM ESTUL Benchmarks: PCMark and 3DMark
This section deals with a selection of the UL Futuremark benchmarks - PCMark 10, PCMark 8, and 3DMark. While the first two evaluate the system as a whole, 3DMark focuses on the graphics capabilities.
PCMark 10
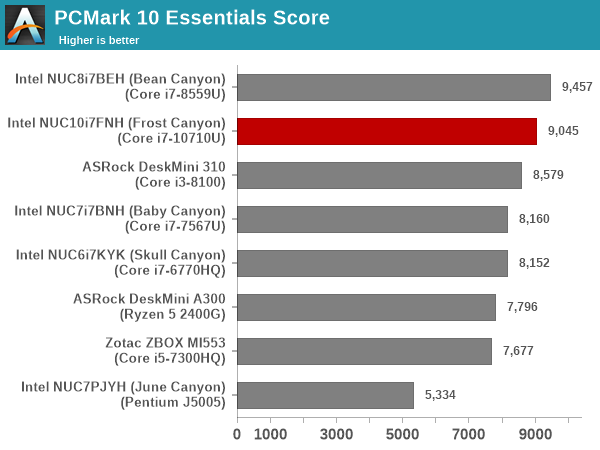
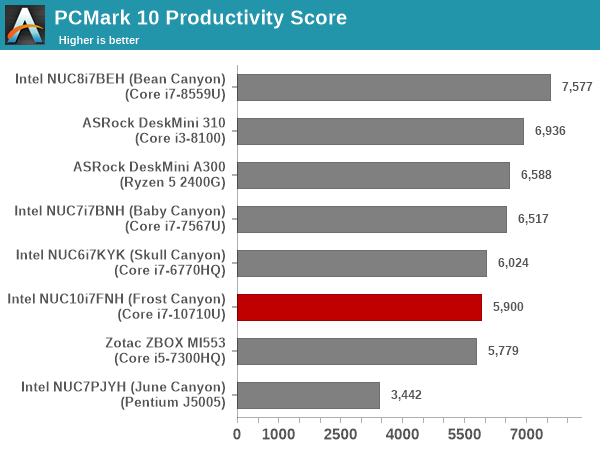
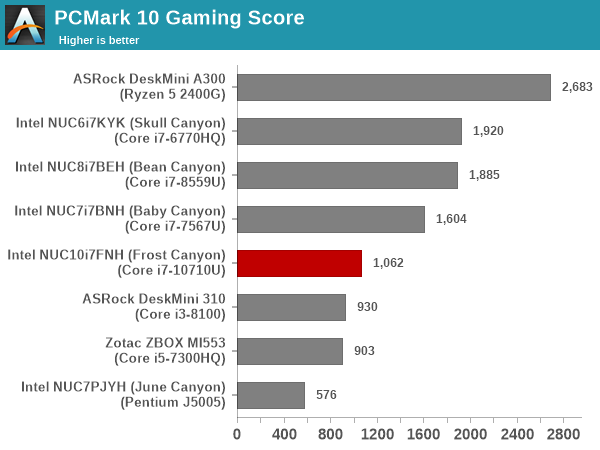
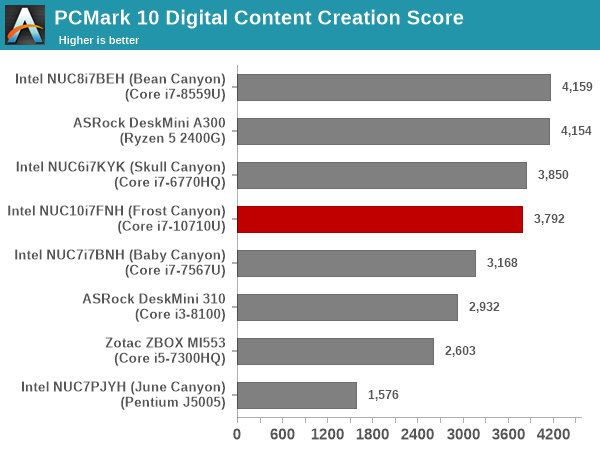
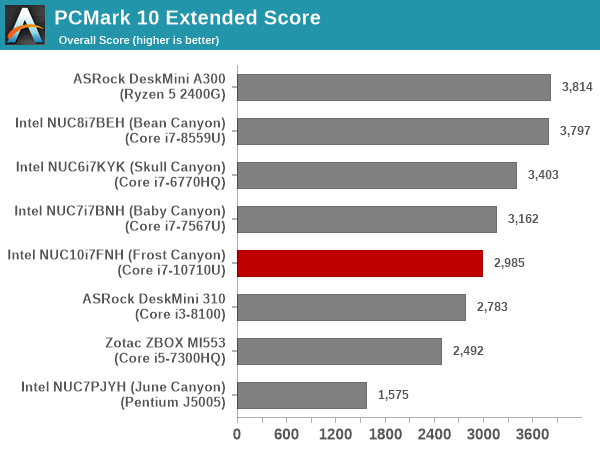
UL's PCMark 10 evaluates computing systems for various usage scenarios (generic / essential tasks such as web browsing and starting up applications, productivity tasks such as editing spreadsheets and documents, gaming, and digital content creation). We benchmarked select PCs with the PCMark 10 Extended profile and recorded the scores for various scenarios. These scores are heavily influenced by the CPU and GPU in the system, though the RAM and storage device also play a part. The power plan was set to Balanced for all the PCs while processing the PCMark 10 benchmark.
The Frost Canyon NUC comes in the middle of the pack, getting bettered by either systems with CPUs capable of higher TDP or better-performing storage. The hexa-core capabilities do not deliver any substantial benefits across various PCMark 10 scenarios, and the absence of Iris Plus Graphics / eDRAM pulls down the 'Gaming Score'.
PCMark 8
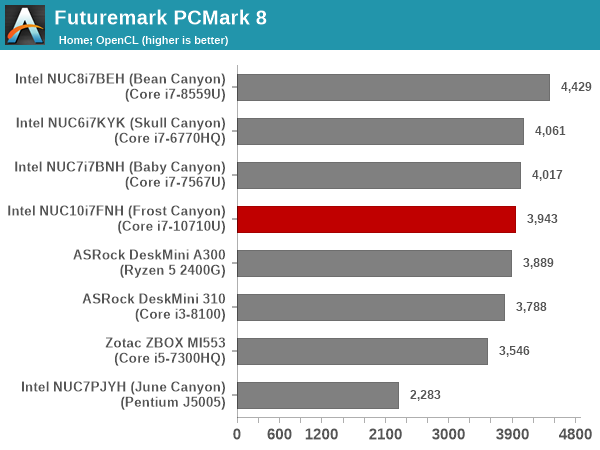
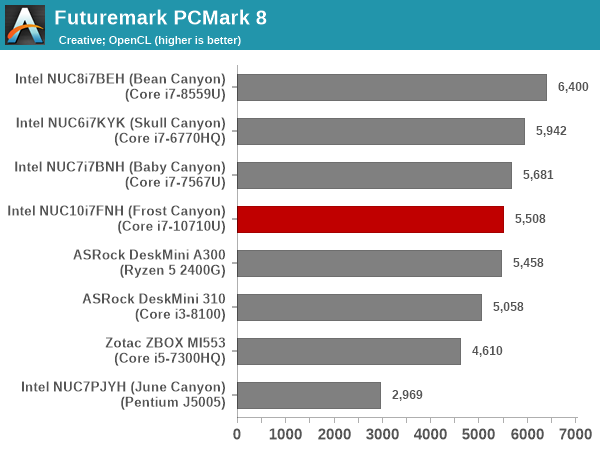
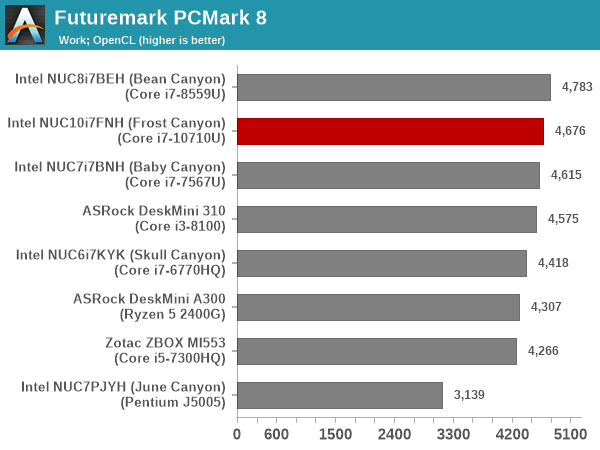
We continue to present PCMark 8 benchmark results (as those have more comparison points) while our PCMark 10 scores database for systems grows in size. PCMark 8 provides various usage scenarios (home, creative and work) and offers ways to benchmark both baseline (CPU-only) as well as OpenCL accelerated (CPU + GPU) performance. We benchmarked select PCs for the OpenCL accelerated performance in all three usage scenarios. These scores are heavily influenced by the CPU in the system, and the scores roughly track what was observed in the PCMark 10 workloads.
3DMark
UL's 3DMark comes with a diverse set of graphics workloads that target different Direct3D feature levels. Correspondingly, the rendering resolutions are also different. We use 3DMark 2.4.4264 to get an idea of the graphics capabilities of the system. In this section, we take a look at the performance of the Intel NUC10i7FNH (Frost Canyon) across the different 3DMark workloads.
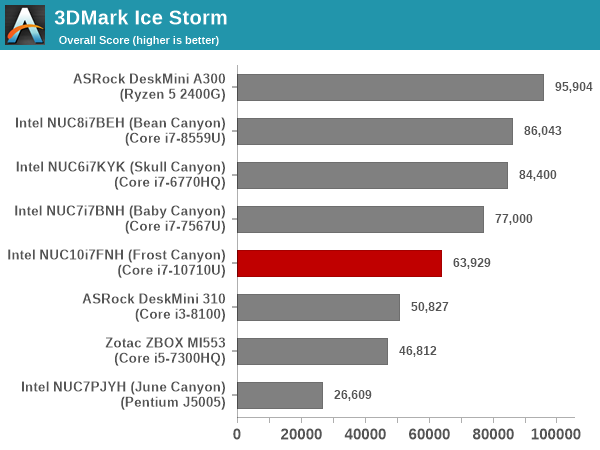
3DMark Ice Storm
This workload has three levels of varying complexity - the vanilla Ice Storm, Ice Storm Unlimited, and Ice Storm Extreme. It is a cross-platform benchmark (which means that the scores can be compared across different tablets and smartphones as well). All three use DirectX 11 (feature level 9) / OpenGL ES 2.0. While the Extreme renders at 1920 x 1080, the other two render at 1280 x 720. The graphs below present the various Ice Storm worloads' numbers for different systems that we have evaluated.
| UL 3DMark - Ice Storm Workloads | |||
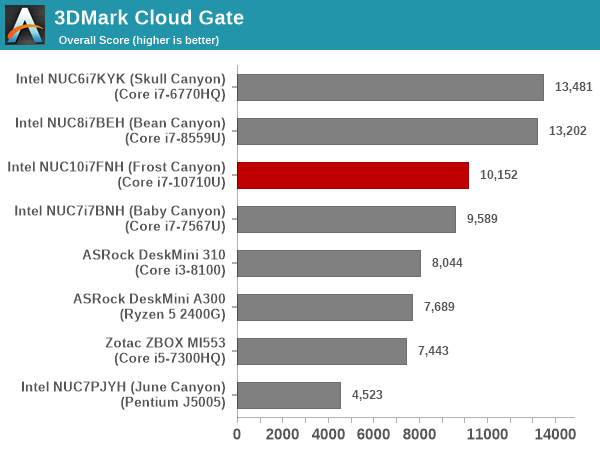
3DMark Cloud Gate
The Cloud Gate workload is meant for notebooks and typical home PCs, and uses DirectX 11 (feature level 10) to render frames at 1280 x 720. The graph below presents the overall score for the workload across all the systems that are being compared. The absence of eDRAM / Iris Plus Graphics results in the Frost Canyon performing significantly worse compared to the Bean Canyon.
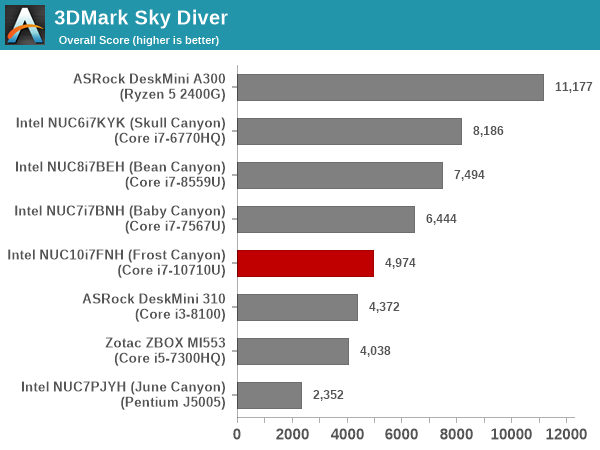
3DMark Sky Diver
The Sky Diver workload is meant for gaming notebooks and mid-range PCs, and uses DirectX 11 (feature level 11) to render frames at 1920 x 1080. The graph below presents the overall score for the workload across all the systems that are being compared. At 1080p, Frost Canyon falls further behind, and is below Baby Canyon's performance - pointing to the lack of GPU prowess.
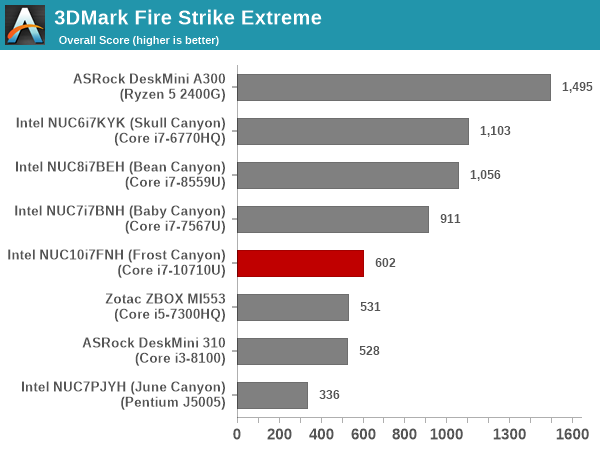
3DMark Fire Strike Extreme
The Fire Strike benchmark has three workloads. The base version is meant for high-performance gaming PCs. Similar to Sky Diver, it uses DirectX 11 (feature level 11) to render frames at 1920 x 1080. The Ultra version targets 4K gaming system, and renders at 3840 x 2160. However, we only deal with the Extreme version in our benchmarking - It renders at 2560 x 1440, and targets multi-GPU systems and overclocked PCs. The graph below presents the overall score for the Fire Strike Extreme benchmark across all the systems that are being compared. The results are similar to the Sky Diver workload.
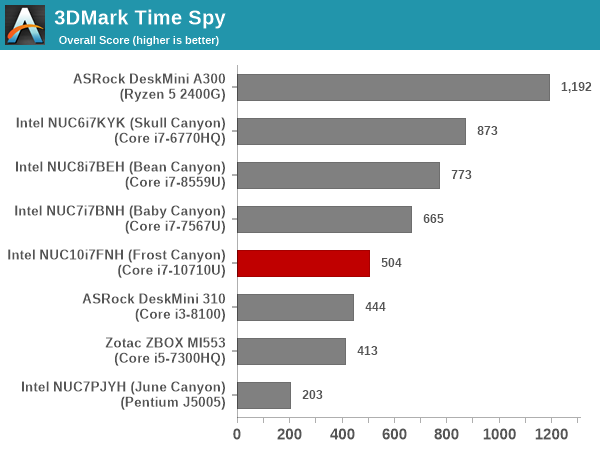
3DMark Time Spy
The Time Spy workload has two levels with different complexities. Both use DirectX 12 (feature level 11). However, the plain version targets high-performance gaming PCs with a 2560 x 1440 render resolution, while the Extreme version renders at 3840 x 2160 resolution. The graphs below present both numbers for all the systems that are being compared in this review, with results being similar to the 1080p Sky Diver workload.
| UL 3DMark - Time Spy Workloads | |||
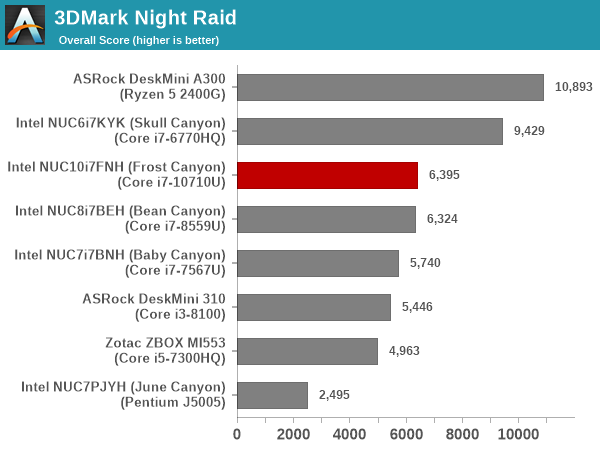
3DMark Night Raid
The Night Raid workload is a DirectX 12 benchmark test. It is less demanding than Time Spy, and is optimized for integrated graphics. The graph below presents the overall score in this workload for different system configurations.
Overall, for CPU-bound graphics workloads, the Frost Canyon performs well, but, in other cases, the absence of eDRAM and the need to share the TDP with a hexa-core CPU block shows its effects. In almost all cases, the Bean Canyon NUC either vastly overperforms the Frost Canyon NUC, or, is neck-to-neck with it.


85 Comments
View All Comments
TMCHouse - Tuesday, March 3, 2020 - link
Hmm, I was expecting a real review with benchmarks, not just a system / specifications description. As a note, the people commenting on the graphics are spot on, I purchased one of these systems and the graphics performance is sub par to a NUC8I5BEH system. I've based this upon running multiple benchmarks and the frame rates are better on the older system with the Iris graphics. Unless you require loads of processor cores, you are better off with the older systems.GreenReaper - Monday, March 9, 2020 - link
I think perhaps you missed the other pages of the article? There are links and a combo box dropdown at the bottom, above the comments.not_anton - Saturday, March 7, 2020 - link
$600 barebone and they give you a huge ugly generic power brick to save like $10?Intel should but one of those Apple NUC minis to see how it should be done.
crashtech - Sunday, March 8, 2020 - link
I can't believe they would regress in GPU! I question the value of the extra cores in such a device instead of improved graphics.fishjie - Monday, November 29, 2021 - link
Ok I'm glad I read this before buying. I own a NUC 6 skull canyon with i7 6770 and was shocked to see some of the benchmarks beat the new NUC 10. granted my use case is mostly watching netflix on my tv but i would want to game occasionally on it. going to explore some other options. Maybe the NUC 8 i guess. The explanation in the concluding remarks was helpful:"However, while the NUC8 was an upgrade over NUC7 in every respect, the Frost Canyon NUC10 slips up a little. Intel's 10th generation U-series processors come in two different versions – the 10nm Ice Lake and the 14nm Comet Lake. Intel's high-end Iris Graphics is available only on Ice Lake, and unfortunately, the Frost Canyon is based on Comet Lake. This means that, for a variety of graphics intensive workloads, the NUC10 actually performs worse than the Iris Plus graphics-equipped NUC8."