The ASRock DeskMini A300 Review: An Affordable DIY AMD Ryzen mini-PC
by Ganesh T S on April 26, 2019 8:00 AM ESTGPU Performance for Workstation Workloads - SPECviewperf 13
The SPECviewperf benchmark from SPEC provides an idea of the capabilities of the GPU in a workstation from the perspective of different CAD, content creation, and visual data analysis tools. It makes more sense to process these benchmarks on workstations with professional GPUs, but, consumer GPUs are often the choice for machines that need to handle both gaming and professional workloads. Since the Radeon RX Vega 11 performs admirably for an integrated GPU in our gaming tests, we wanted to give the DeskMini A300 a go with the SPECviewperf 13 workloads also.
SPECviewperf 13 includes nine different workloads representative of graphics content and behavior of actual applications. They make use of the OpenGL 4.0 and DirectX 12 APIs under Windows. SPECviewperf 13's workloads (termed viewsets) can officially be run only at two desktop resolutions (1920 x 1080, and 3840 x 2160), and need the display scaling to be set to 100% (DPI of 96). The available viewsets are listed below.
- 3ds Max (3dsmax-06)
- CATIA (catia-05)
- Creo (creo-02)
- Energy (energy-02)
- Maya (maya-05)
- Medical (medical-02)
- Showcase (showcase-02)
- Siemens NX (snx-03)
- Solidworks (sw-04)
The 3ds Max and Showcase viewsets are available only when processing at 1920 x 1080. The rest are available at both resolutions.
We processed SPECviewperf 13 at both resolutions on the ASRock DeskMini A300. The benchmark measures the frame rate at which the GPU renders the scenes in a viewset. Each viewset is composed of different scenes and rendering modes, and the composite score for the viewset is a weighted geometric mean of the FPS measured for the different scenes. In this section, we take a look at how its composite scores stack up against other systems targeting this market segment.
3ds Max (3dsmax-06)
The 3dsmax-06 viewset comprises of 11 different scenes. They have been created from traces of the graphics workload generated by Autodesk 3ds Max 2016 using the default Nitrous DX11 driver. Additional details are available here.
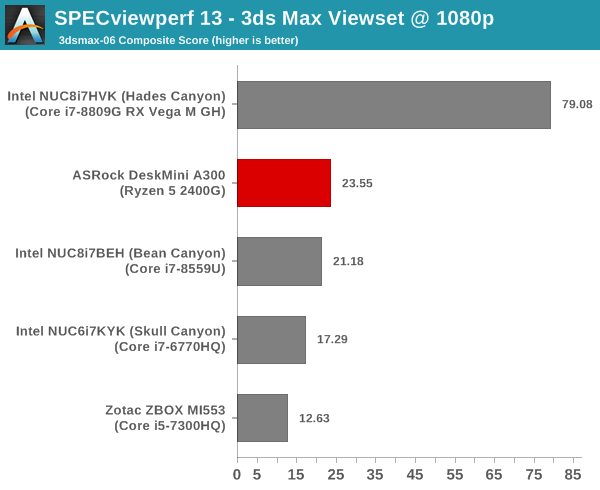
The DeskMini A300 is again the leading iGPU-only system, but, the Bean Canyon NUC's performance is quite close.
CATIA (catia-05)
The catia-05 viewset comprises of 14 different tests created from traces of the graphics workload generated by the CATIA V6 R2012 application from Dassault Systemes. Additional details are available here.
| SPECviewperf 13: CATIA Viewset Composite Scores | |||
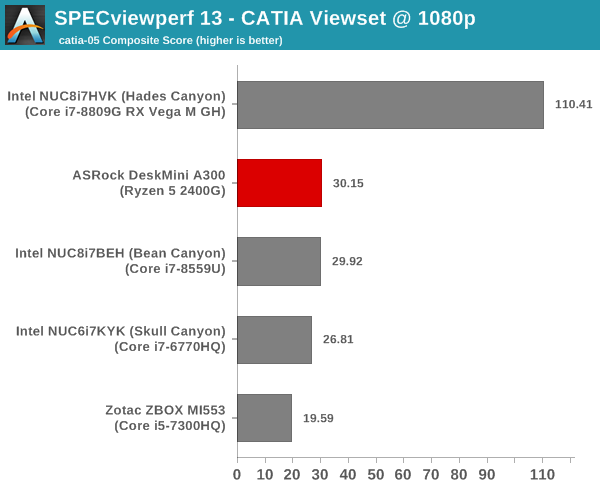
The DeskMini A300 and the Bean Canyon NUC are essentially tied in this workload.
Creo (creo-02)
The creo-02 viewset comprises of 16 different tests created from traces of the graphics workload generated by the Creo 3 and Creo 4 applications from PTC. Additional details are available here.
| SPECviewperf 13: Creo Viewset Composite Scores | |||
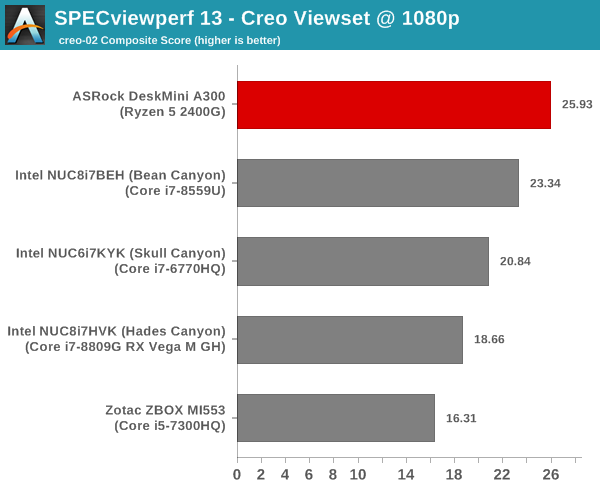
The Ryzen system is ahead at 1080p, but, falls slightly behind the Bean Canyon NUC at 2160p.
Energy (energy-02)
The energy-02 viewset comprises of 6 different tests based on techniques used by the OpendTect seismic visualization application. Additional details are available here.
| SPECviewperf 13: Energy Viewset Composite Scores | |
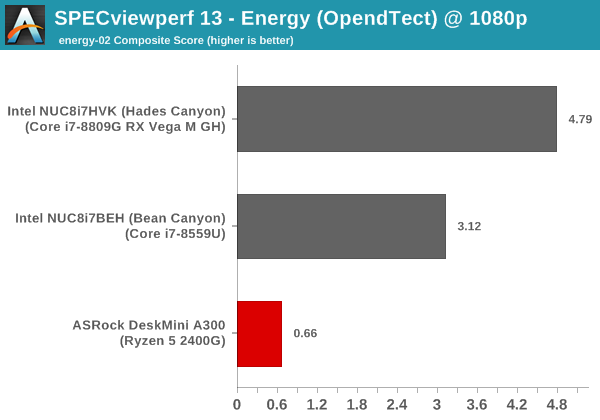
The energy-02 workload is a tough nut to crack for SFF systems, and the DeskMini A300 seems to have some trouble in completing the workload properly. At 2160p, all the systems that we are comparing the A300 against had trouble with the workload - hence, we do not have a graph for the workload at that resolution.
Maya (maya-05)
The maya-05 viewset comprises of 10 different tests based on traces of the graphics workload generated by Autodesk Maya 2017. Additional details are available here.
| SPECviewperf 13: Maya Viewset Composite Scores | |||
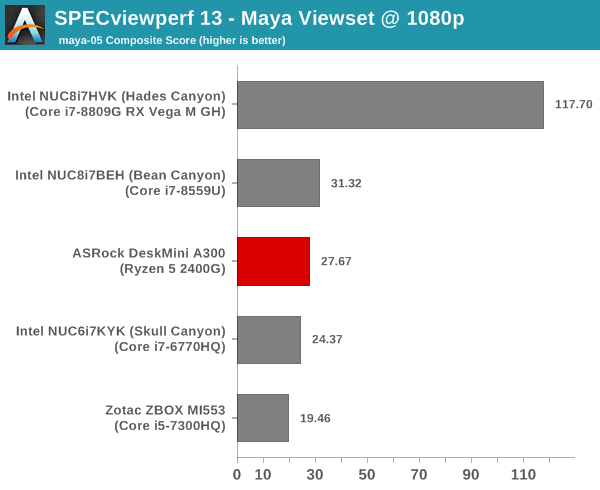
The Bean Canyon NUC edges ahead of the DeskMini A300 for the maya-05 workload at both resolutions.
Medical (medical-02)
The medical-02 viewset comprises of 8 different tests derived from 4 distinct datasets. Each test uses the ImageVis3D volume visualization program's Tuvok rendering core for 2D projections of 3D volumetric grids. Additional details are available here.
| SPECviewperf 13: Medical Viewset Composite Scores | |||
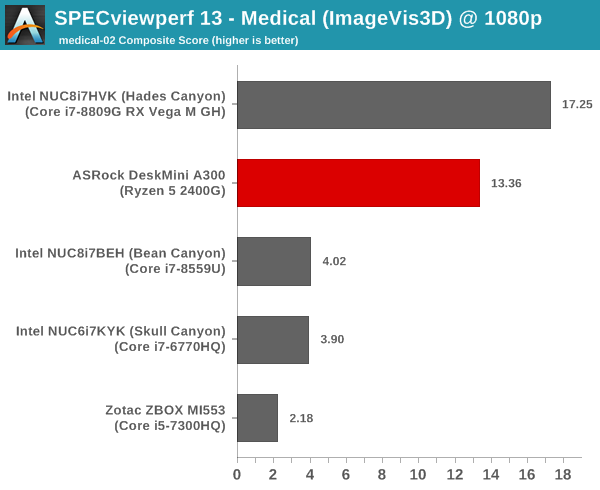
The medical-02 viewset represents a clear victory for the DeskMini A300 over other iGPU-only systems.
Showcase (showcase-02)
The showcase-02 viewset comprises of 4 tests created from traces of the Autodesk Showcase 2013 application rendering a racecar model with 8 million vertices using different modes. Additional details are available here.
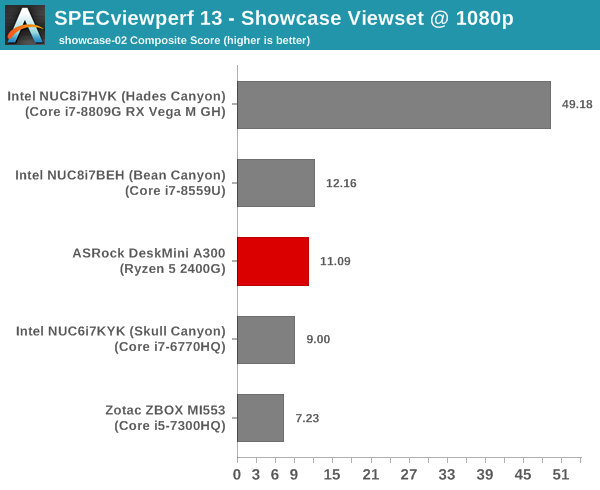
The showcase-02 viewset sees the Bean Canyon NUC edge slightly ahead of the DeskMini A300.
Siemens NX (snx-03)
The snx-03 viewset comprises of 10 tests created with traces from the graphics workload generated by the NX 8.0 application from Siemens PLM. Additional details are available here.
| SPECviewperf 13: Siemens NX Viewset Composite Scores | |||
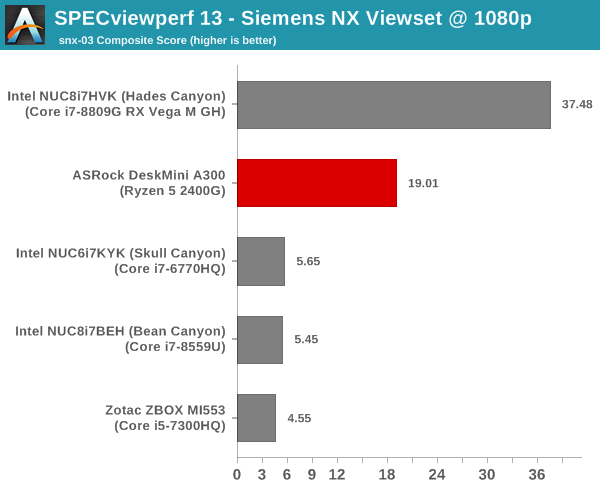
The snx-03 viewset is similar to the medical-02 viewset in terms of the DeskMini A300 enjoying a clear lead.
Solidworks (sw-04)
The sw-04 viewset comprises of 11 tests created from traces of Dassault Systemes’ SolidWorks 2013 SP1 application. Additional details are available here.
| SPECviewperf 13: Solidworks Viewset Composite Scores | |||
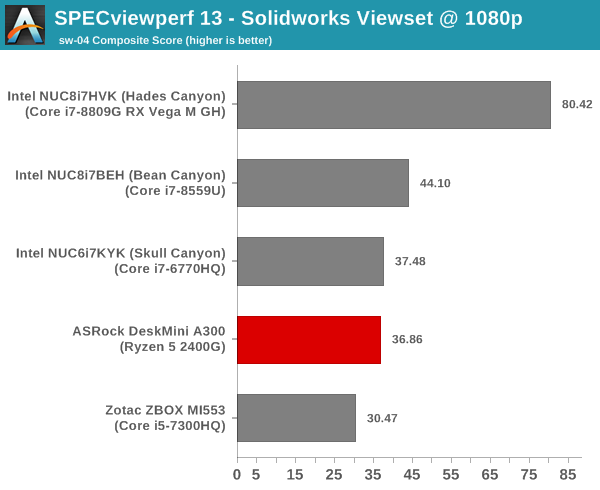
In this viewset, we see the Bean Canyon NUC come out on top, with the DeskMini A300 tussling it out with the Skull Canyon NUC for the second place amongst the iGPU-only systems.
Overall, for the SPECviewperf 13 workloads, we see that the DeskMini A300 is not a clear winner. There are a couple of viewsets in which the A300 performs significantly better, but, for the most part, the Bean Canyon NUC mounts an excellent challenge. The reasons for this could be two-fold - on one hand, the Radeon drivers for the RX Vega 11 might not be really optimized for these kinds of workloads. On the other, the Bean Canyon NUC employs an Iris Plus 655 GPU which comes with 128MB of eDRAM cache. It is likely that the eDRAM is beneficial for SPECviewperf 13 workloads.


88 Comments
View All Comments
ganeshts - Friday, April 26, 2019 - link
Actually, it is OK with Kodi (XBMC) and Microsoft Edge / VideoUI app on Windows. It is only VLC and LAV Video Decoder having issues.DigitalFreak - Friday, April 26, 2019 - link
" The hardware itself is actually rather capable (as noted above), but the the current state of the Radeon drivers holds it back."Same old story that's been going on for a decade or more with ATI/AMD.
Irata - Friday, April 26, 2019 - link
Some more power consumption numbers: (A300 vs. A310)Idle power: 81%
Max power consumption (stressing CPU+GPU): 131%.
But this gives us:
- Gaming performance: no numbers for the A310, however the A300 has an average gaming performance of 204 % vs. Bean Canyon (using the fps shown as default) at 126 of its power consumption, so again it is more power efficient.
Cinebench Muti-threaded rendering: 137% of he A310's performance @ (using the max power consumption as a guideline) 131% of the power consumption.
Note: It would be nice to show the power consumption for all benchmarks, i.e. gaming, 7-zip, cinebench....
Mil0 - Sunday, April 28, 2019 - link
I was thinking along this lines, thanks for doing the math. It seems the A300 is basically always more power efficient.Especially given that machines like this will spend a lot of time at or near idle. If the light load scenario comes close to the 81% power usage, in the long run this could save quite a bit of power.
niva - Monday, April 29, 2019 - link
So you guys are reaching a different conclusion than what the article stated in terms of efficiency?In the conclusions paragraph it stated that this machine is "not particularly energy efficent."
I also glanced at the numbers initially and was confused as to how they reached that conclusion but didn't do math. Why did the author use that language?
mikato - Tuesday, April 30, 2019 - link
The language you refer to is the author comparing it to the Intel Mini-PC competitors, and not just the other ASRock DeskMini. Commenters Irata and Mil0 above were comparing DeskMini A300 vs DeskMini A310.Irata - Wednesday, May 1, 2019 - link
That is correct, although in the case of gaming results, I had to compare it to another system since there was no data for the A310.The thought was, how does the performance delta align with the power consumption delta. Now it seems that Ganesh disagrees as I am using linear values but imho this approach seems valid to me as well.
So if it has 10% less performance but uses 10% less power, at least for me the energy efficieny is identical. Same if it has 10% more performance but uses 10% more power.
plonk420 - Saturday, May 4, 2019 - link
never had an issue with drivers on AMD except for an edge case: trying to install newer ones on Windows Server 2008 R2 Enterprise.sadly this might be an issue with the disconnect between OEM and AMD's drivers
Irata - Friday, April 26, 2019 - link
I found this a bit odd:"For traditional office and business workloads, it gets the job done; and while it's not particularly energy efficient, the upfront cost itself is lower".
Looking at the Bapco Sysmark overall power consumption numbers, the DeskMini A300 and 310 have basically identical numbers (32.26 vs. 31.62 Wh). Seeing the the performance delta is not considerable I find this statement a bit odd. And these are Bapco Sysmark numbers which need to be taken with a rock of salt.
davie887 - Friday, April 26, 2019 - link
Intel CAN'T be shown in anything other that their best light.Anyone who questions them has to prepare for the consequences :D