The ASRock DeskMini A300 Review: An Affordable DIY AMD Ryzen mini-PC
by Ganesh T S on April 26, 2019 8:00 AM ESTMiscellaneous Performance Metrics
This section looks at some of the other commonly used benchmarks representative of the performance of specific real-world applications.
3D Rendering - CINEBENCH R15
We use CINEBENCH R15 for 3D rendering evaluation. The program provides three benchmark modes - OpenGL, single threaded and multi-threaded. Evaluation of different PC configurations in all three modes provided us the following results.
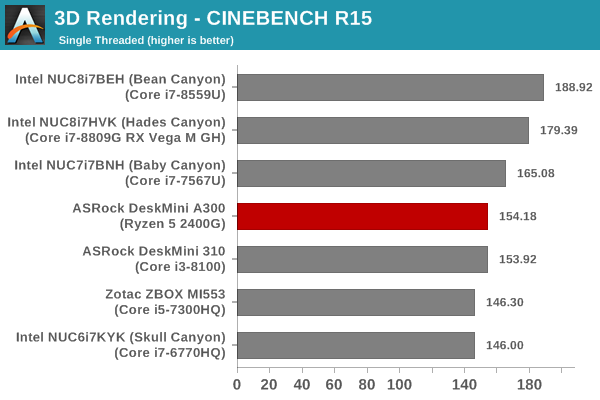
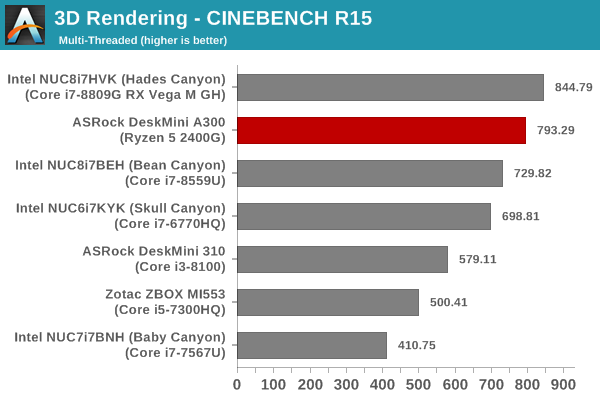
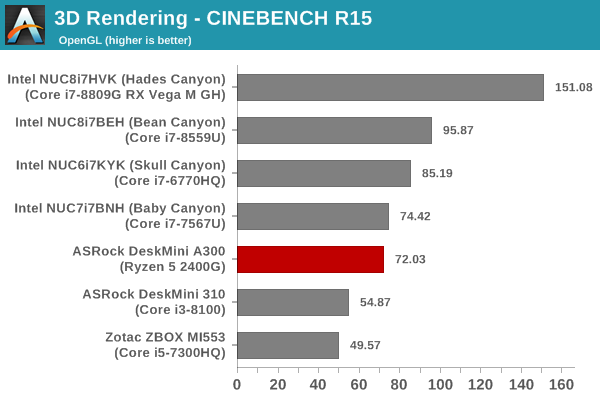
In the single-threaded mode, the performance of the Ryzen 5 2400G in the DeskMini A300 is pretty much equivalent to the Core i3-8100 in the DeskMini 310. The Ryzen system pulls ahead by a significant margin in the multi-threaded case, even surpassing other 4C/8T systems such as the Bean Canyon NUC (admittedly featuring a CPU with almost half the TDP of the Ryzen 5 2400G). OpenGL performance is not as good as expected, though it is much better than the DeskMini 310.
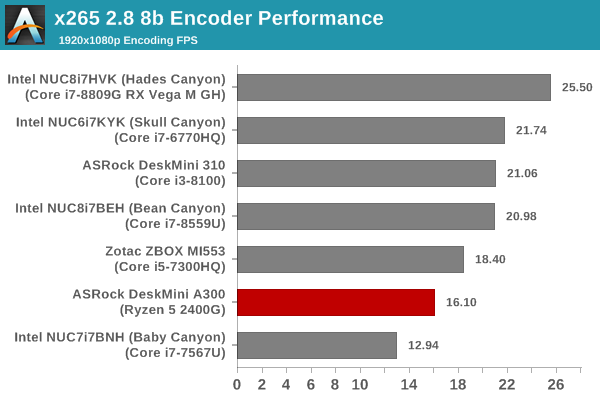
x265 Benchmark
Next up, we have some video encoding benchmarks using x265 v2.8. The appropriate encoder executable is chosen based on the supported CPU features. In the first case, we encode 600 1080p YUV 4:2:0 frames into a 1080p30 HEVC Main-profile compatible video stream at 1 Mbps and record the average number of frames encoded per second.
Our second test case is 1200 4K YUV 4:2:0 frames getting encoded into a 4Kp60 HEVC Main10-profile video stream at 35 Mbps. The encoding FPS is recorded.
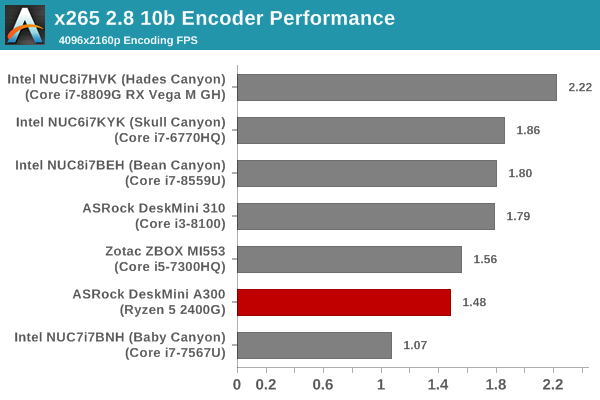
The x265 benchmarks have the A300 coming in the lower half of the graphs, and it is highly likely to be due to the Intel-optimized x265 encoder executable used in the benchmark. We are attempting to source an x265 executable version optimized for Ryzen. However, we couldn't find one in time for this review.
7-Zip
7-Zip is a very effective and efficient compression program, often beating out OpenCL accelerated commercial programs in benchmarks even while using just the CPU power. 7-Zip has a benchmarking program that provides tons of details regarding the underlying CPU's efficiency. In this subsection, we are interested in the compression and decompression rates when utilizing all the available threads for the LZMA algorithm.
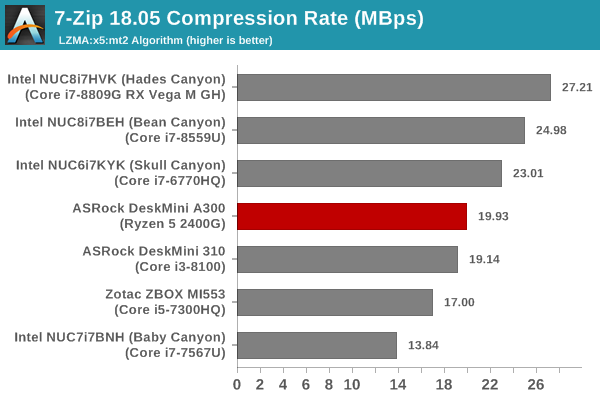
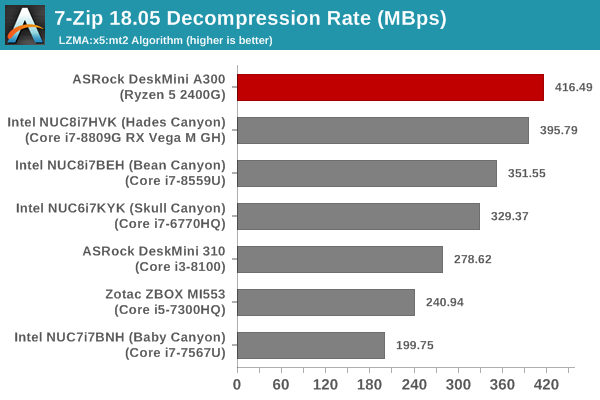
The compression rates of the DeskMini 310 and DeskMini A300 are similar, but, the Ryzen system has a significant lead in the decompression rate.
Cryptography Benchmarks
Cryptography has become an indispensable part of our interaction with computing systems. Almost all modern systems have some sort of hardware-acceleration for making cryptographic operations faster and more power efficient. In this sub-section, we look at two different real-world applications that may make use of this acceleration.
BitLocker is a Windows features that encrypts entire disk volumes. While drives that offer encryption capabilities are dealt with using that feature, most legacy systems and external drives have to use the host system implementation. Windows has no direct benchmark for BitLocker. However, we cooked up a BitLocker operation sequence to determine the adeptness of the system at handling BitLocker operations. We start off with a 2.5GB RAM drive in which a 2GB VHD (virtual hard disk) is created. This VHD is then mounted, and BitLocker is enabled on the volume. Once the BitLocker encryption process gets done, BitLocker is disabled. This triggers a decryption process. The times taken to complete the encryption and decryption are recorded. This process is repeated 25 times, and the average of the last 20 iterations is graphed below.
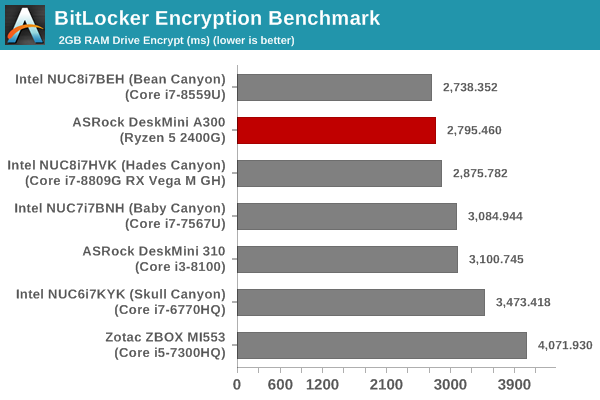
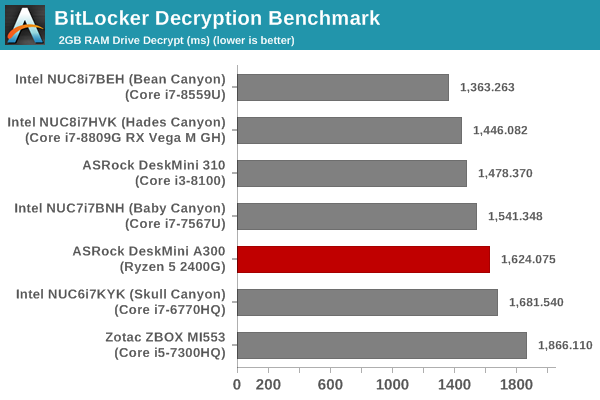
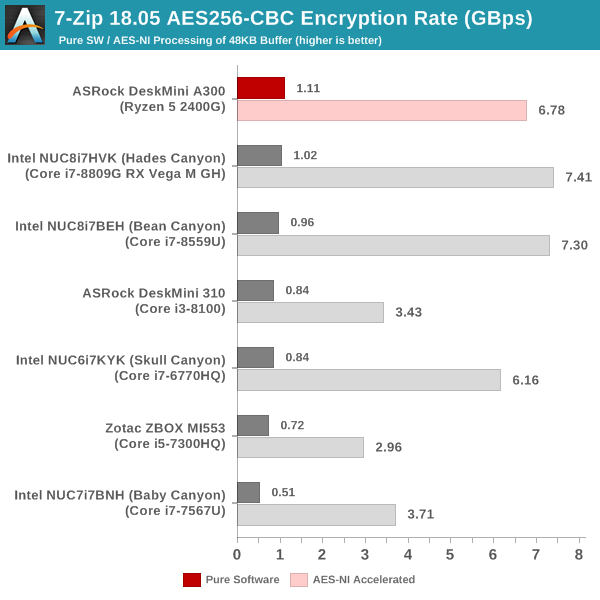
The higher memory speed (DDR4-3000) gives the DeskMini A300 a leg up, but, the core cryptographic operations seem to be accelerated better in the Intel-based systems. This is also seen in the 7-Zip AES encryption benchmark below.
Creation of secure archives is best done through the use of AES-256 as the encryption method while password protecting ZIP files. We re-use the benchmark mode of 7-Zip to determine the AES256-CBC encryption and decryption rates using pure software as well as AES-NI. Note that the 7-Zip benchmark uses a 48KB buffer for this purpose.
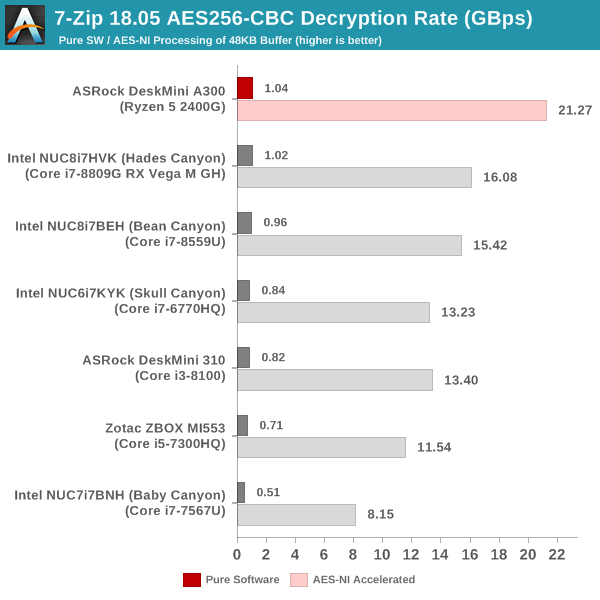
On the decryption side, the Ryzen system has a significant advantage, which could be related to the buffer sizing and organization of the benchmark data.
Yet another cryptography application is secure network communication. OpenSSL can take advantage of the acceleration provided by the host system to make operations faster. It also has a benchmark mode that can use varying buffer sizes. We recorded the processing rate for a 8KB buffer using the hardware-accelerated AES256-CBC-HAC-SHA1 feature.
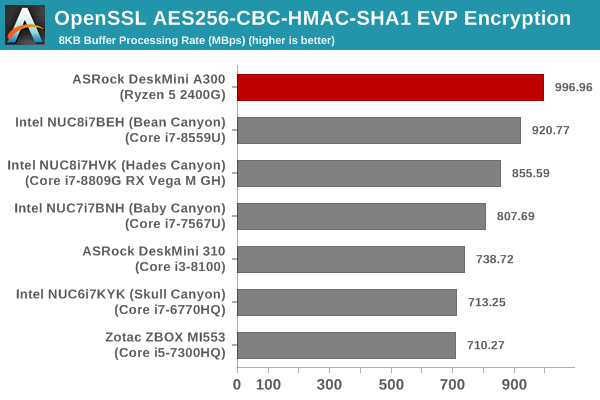
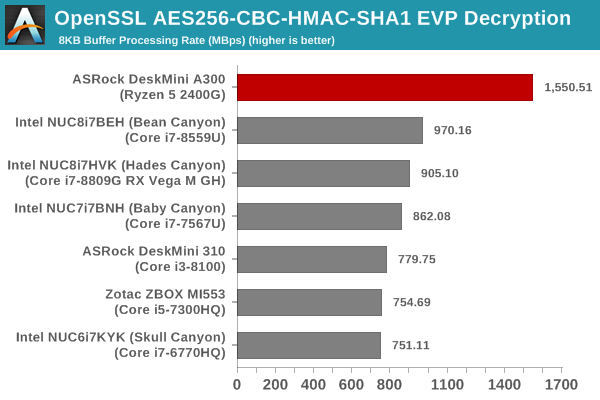
The Ryzen system performs significantly better than the rest of the systems, particularly in the decryption benchmark.
Agisoft Photoscan
Agisoft PhotoScan is a commercial program that converts 2D images into 3D point maps, meshes and textures. The program designers sent us a command line version in order to evaluate the efficiency of various systems that go under our review scanner. The command line version has two benchmark modes, one using the CPU and the other using both the CPU and GPU (via OpenCL). We present the results from our evaluation using the CPU mode only. The benchmark (v1.3) takes 84 photographs and does four stages of computation:
- Stage 1: Align Photographs (capable of OpenCL acceleration)
- Stage 2: Build Point Cloud (capable of OpenCL acceleration)
- Stage 3: Build Mesh
- Stage 4: Build Textures
We record the time taken for each stage. Since various elements of the software are single threaded, and others multithreaded, it is interesting to record the effects of CPU generations, speeds, number of cores, and DRAM parameters using this software.
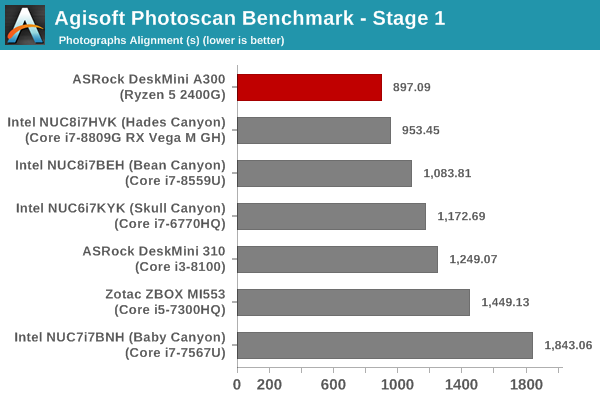
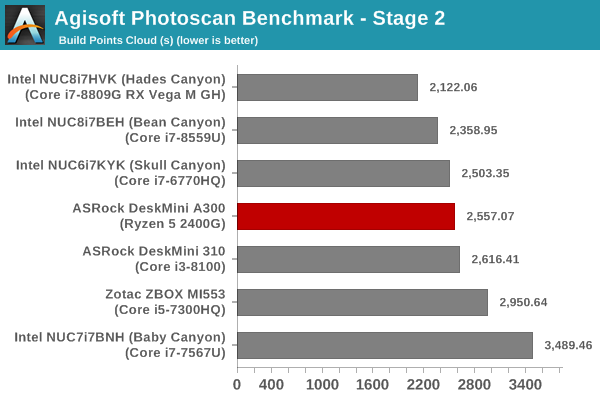
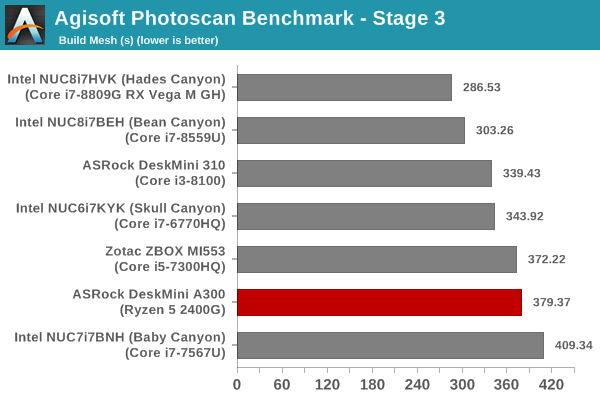
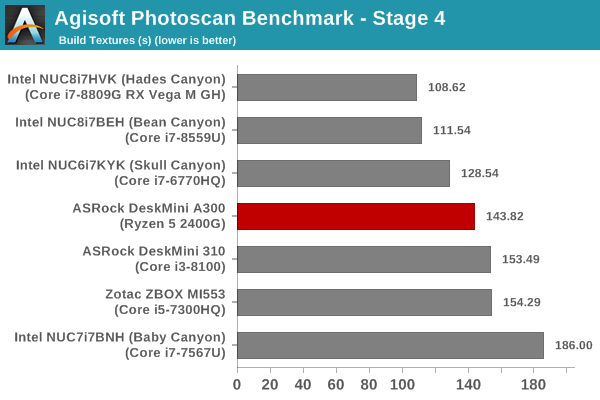
The DeskMini A300 takes the least time of all for the first stage, but, the other stages see it in the middle of the graph. Overall, the Ryzen system is ahead of the DeskMini 310 in this benchmark.
Dolphin Emulator
Wrapping up our application benchmark numbers is the new Dolphin Emulator (v5) benchmark mode results. This is again a test of the CPU capabilities.
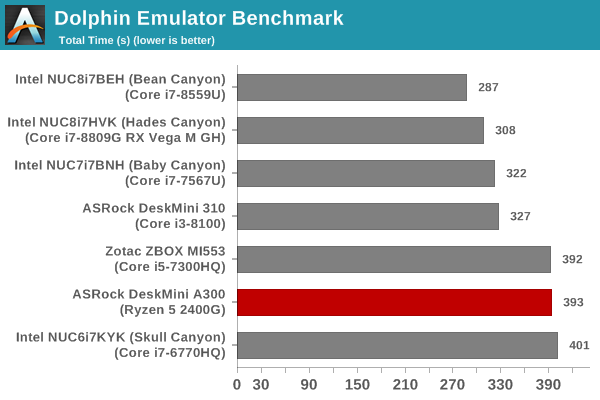
Here, the Ryzen system doesn't fare as well as expected, coming in with the same amount of time as the Zotac MI553 with the Core i5-7300HQ. All the other modern systems (including the DeskMini 310) complete the benchmark sooner by a minute or more.
Storage Performance
On the storage side, one option would be repetition of our strenuous SSD review tests on the drive(s) in the PC. Fortunately, to avoid that overkill, PCMark 8 has a storage bench where certain common workloads such as loading games and document processing are replayed on the target drive. Results are presented in two forms, one being a benchmark number and the other, a bandwidth figure. We ran the PCMark 8 storage bench on selected PCs and the results are presented below.
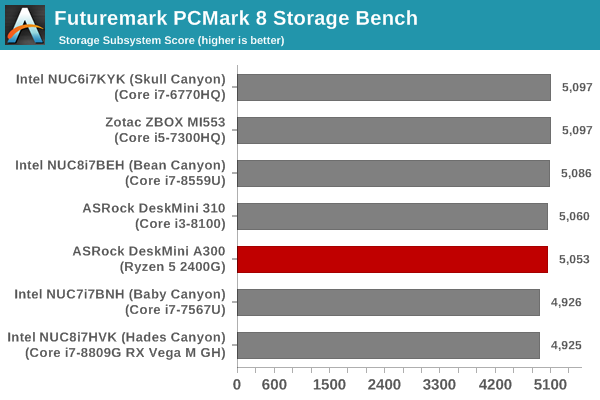
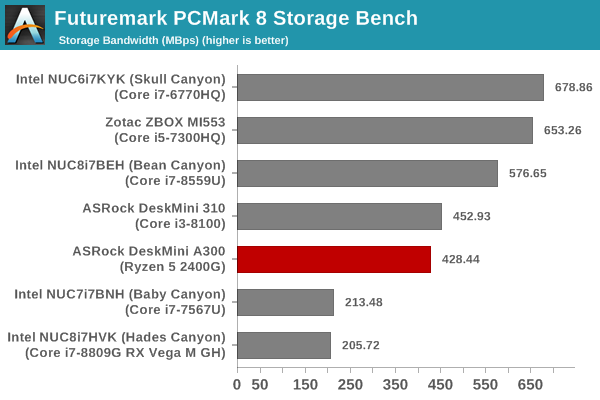
Despite the usage of a budget PCIe 3.0 x2 SSD, we see the storage bench numbers almost approaching systems equipped with PCIe 3.0 x4 SSDs. In any case, as a budget play (the 500GB WD SN500 can be sourced for as low as $65), the numbers above are quite good.


88 Comments
View All Comments
ganeshts - Friday, April 26, 2019 - link
Actually, it is OK with Kodi (XBMC) and Microsoft Edge / VideoUI app on Windows. It is only VLC and LAV Video Decoder having issues.DigitalFreak - Friday, April 26, 2019 - link
" The hardware itself is actually rather capable (as noted above), but the the current state of the Radeon drivers holds it back."Same old story that's been going on for a decade or more with ATI/AMD.
Irata - Friday, April 26, 2019 - link
Some more power consumption numbers: (A300 vs. A310)Idle power: 81%
Max power consumption (stressing CPU+GPU): 131%.
But this gives us:
- Gaming performance: no numbers for the A310, however the A300 has an average gaming performance of 204 % vs. Bean Canyon (using the fps shown as default) at 126 of its power consumption, so again it is more power efficient.
Cinebench Muti-threaded rendering: 137% of he A310's performance @ (using the max power consumption as a guideline) 131% of the power consumption.
Note: It would be nice to show the power consumption for all benchmarks, i.e. gaming, 7-zip, cinebench....
Mil0 - Sunday, April 28, 2019 - link
I was thinking along this lines, thanks for doing the math. It seems the A300 is basically always more power efficient.Especially given that machines like this will spend a lot of time at or near idle. If the light load scenario comes close to the 81% power usage, in the long run this could save quite a bit of power.
niva - Monday, April 29, 2019 - link
So you guys are reaching a different conclusion than what the article stated in terms of efficiency?In the conclusions paragraph it stated that this machine is "not particularly energy efficent."
I also glanced at the numbers initially and was confused as to how they reached that conclusion but didn't do math. Why did the author use that language?
mikato - Tuesday, April 30, 2019 - link
The language you refer to is the author comparing it to the Intel Mini-PC competitors, and not just the other ASRock DeskMini. Commenters Irata and Mil0 above were comparing DeskMini A300 vs DeskMini A310.Irata - Wednesday, May 1, 2019 - link
That is correct, although in the case of gaming results, I had to compare it to another system since there was no data for the A310.The thought was, how does the performance delta align with the power consumption delta. Now it seems that Ganesh disagrees as I am using linear values but imho this approach seems valid to me as well.
So if it has 10% less performance but uses 10% less power, at least for me the energy efficieny is identical. Same if it has 10% more performance but uses 10% more power.
plonk420 - Saturday, May 4, 2019 - link
never had an issue with drivers on AMD except for an edge case: trying to install newer ones on Windows Server 2008 R2 Enterprise.sadly this might be an issue with the disconnect between OEM and AMD's drivers
Irata - Friday, April 26, 2019 - link
I found this a bit odd:"For traditional office and business workloads, it gets the job done; and while it's not particularly energy efficient, the upfront cost itself is lower".
Looking at the Bapco Sysmark overall power consumption numbers, the DeskMini A300 and 310 have basically identical numbers (32.26 vs. 31.62 Wh). Seeing the the performance delta is not considerable I find this statement a bit odd. And these are Bapco Sysmark numbers which need to be taken with a rock of salt.
davie887 - Friday, April 26, 2019 - link
Intel CAN'T be shown in anything other that their best light.Anyone who questions them has to prepare for the consequences :D