Upgrading from an Intel Core i7-2600K: Testing Sandy Bridge in 2019
by Ian Cutress on May 10, 2019 10:30 AM EST- Posted in
- CPUs
- Intel
- Sandy Bridge
- Overclocking
- 7700K
- Coffee Lake
- i7-2600K
- 9700K
CPU Performance: System Tests
Our System Test section focuses significantly on real-world testing, user experience, with a slight nod to throughput. In this section we cover application loading time, image processing, simple scientific physics, emulation, neural simulation, optimized compute, and 3D model development, with a combination of readily available and custom software. For some of these tests, the bigger suites such as PCMark do cover them (we publish those values in our office section), although multiple perspectives is always beneficial. In all our tests we will explain in-depth what is being tested, and how we are testing.
All of our benchmark results can also be found in our benchmark engine, Bench.
Application Load: GIMP 2.10.4
One of the most important aspects about user experience and workflow is how fast does a system respond. A good test of this is to see how long it takes for an application to load. Most applications these days, when on an SSD, load fairly instantly, however some office tools require asset pre-loading before being available. Most operating systems employ caching as well, so when certain software is loaded repeatedly (web browser, office tools), then can be initialized much quicker.
In our last suite, we tested how long it took to load a large PDF in Adobe Acrobat. Unfortunately this test was a nightmare to program for, and didn’t transfer over to Win10 RS3 easily. In the meantime we discovered an application that can automate this test, and we put it up against GIMP, a popular free open-source online photo editing tool, and the major alternative to Adobe Photoshop. We set it to load a large 50MB design template, and perform the load 10 times with 10 seconds in-between each. Due to caching, the first 3-5 results are often slower than the rest, and time to cache can be inconsistent, we take the average of the last five results to show CPU processing on cached loading.
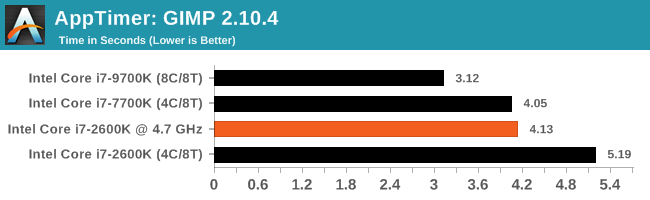
Even overclocked, the 2600K doesn't quite reach the 7700K performance, while the 9700K with the higher single thread frequency takes a healthy lead.
FCAT: Image Processing
The FCAT software was developed to help detect microstuttering, dropped frames, and run frames in graphics benchmarks when two accelerators were paired together to render a scene. Due to game engines and graphics drivers, not all GPU combinations performed ideally, which led to this software fixing colors to each rendered frame and dynamic raw recording of the data using a video capture device.
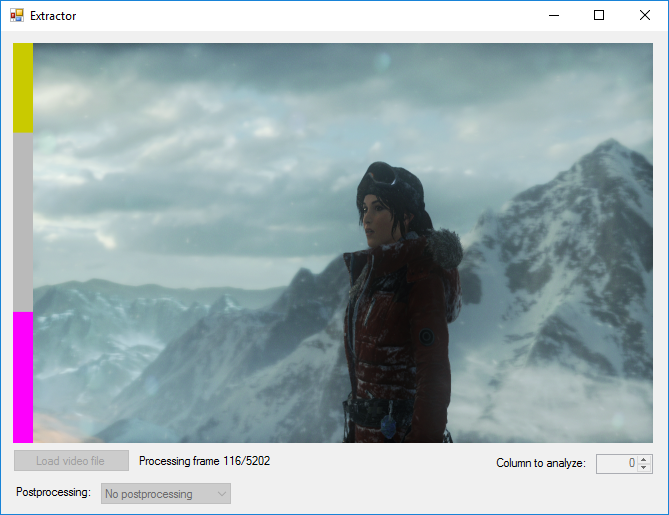
The FCAT software takes that recorded video, which in our case is 90 seconds of a 1440p run of Rise of the Tomb Raider, and processes that color data into frame time data so the system can plot an ‘observed’ frame rate, and correlate that to the power consumption of the accelerators. This test, by virtue of how quickly it was put together, is single threaded. We run the process and report the time to completion.
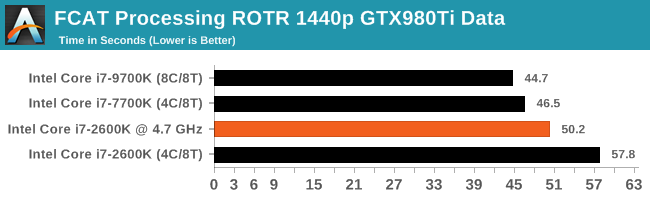
FCAT is another single threaded test, so we're seeing the same performance differences: the 2600K overclocked can't quite match the 7700K at stock, while the 9700K goes out into the lead.
3D Particle Movement v2.1: Brownian Motion
Our 3DPM test is a custom built benchmark designed to simulate six different particle movement algorithms of points in a 3D space. The algorithms were developed as part of my PhD., and while ultimately perform best on a GPU, provide a good idea on how instruction streams are interpreted by different microarchitectures.
A key part of the algorithms is the random number generation – we use relatively fast generation which ends up implementing dependency chains in the code. The upgrade over the naïve first version of this code solved for false sharing in the caches, a major bottleneck. We are also looking at AVX2 and AVX512 versions of this benchmark for future reviews.
For this test, we run a stock particle set over the six algorithms for 20 seconds apiece, with 10 second pauses, and report the total rate of particle movement, in millions of operations (movements) per second. We have a non-AVX version and an AVX version, with the latter implementing AVX512 and AVX2 where possible.
3DPM v2.1 can be downloaded from our server: 3DPMv2.1.rar (13.0 MB)
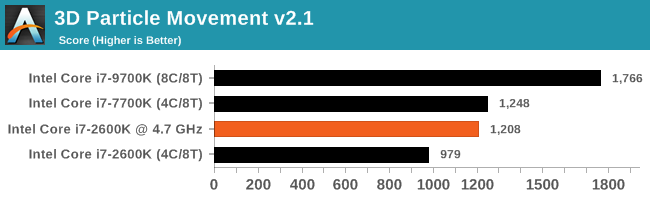
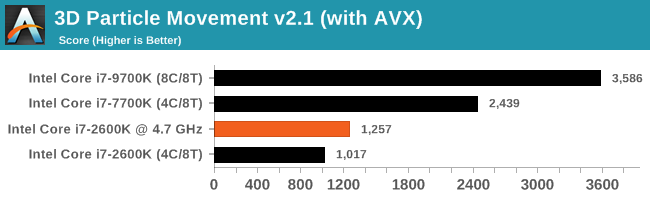
As the 2600K does not have AVX2, it ends up severely lacking behind the 7700K/9700K when the program is optimized for the new instructions.
Dolphin 5.0: Console Emulation
One of the popular requested tests in our suite is to do with console emulation. Being able to pick up a game from an older system and run it as expected depends on the overhead of the emulator: it takes a significantly more powerful x86 system to be able to accurately emulate an older non-x86 console, especially if code for that console was made to abuse certain physical bugs in the hardware.
For our test, we use the popular Dolphin emulation software, and run a compute project through it to determine how close to a standard console system our processors can emulate. In this test, a Nintendo Wii would take around 1050 seconds.
The latest version of Dolphin can be downloaded from https://dolphin-emu.org/
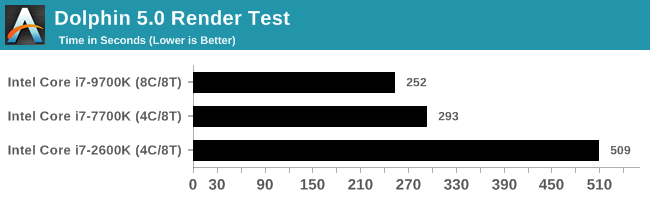
Dolphin gained substantial performance around the Haswell/Broadwell era, hence the incredible performance gain from 2600K to 7700K. Unfortunaetly for some reason the overclocked CPU failed this test.
DigiCortex 1.20: Sea Slug Brain Simulation
This benchmark was originally designed for simulation and visualization of neuron and synapse activity, as is commonly found in the brain. The software comes with a variety of benchmark modes, and we take the small benchmark which runs a 32k neuron / 1.8B synapse simulation, equivalent to a Sea Slug.

Example of a 2.1B neuron simulation
We report the results as the ability to simulate the data as a fraction of real-time, so anything above a ‘one’ is suitable for real-time work. Out of the two modes, a ‘non-firing’ mode which is DRAM heavy and a ‘firing’ mode which has CPU work, we choose the latter. Despite this, the benchmark is still affected by DRAM speed a fair amount.
DigiCortex can be downloaded from http://www.digicortex.net/
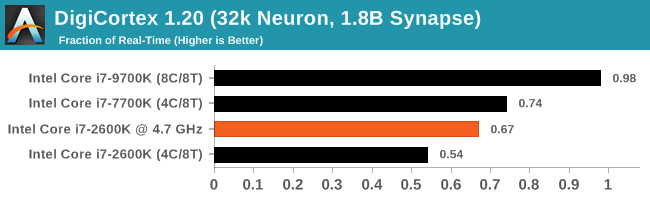
For memory related tests, we ran the systems at their Intel designated supported frequencies, except for the OC system, which got a healthy boost from DDR3-1333 to DDR3-2400. The results show the bump in performance, but even a 7700K at stock wins out. Jumping up to the 9700K gets added core performance.
y-Cruncher v0.7.6: Microarchitecture Optimized Compute
I’ve known about y-Cruncher for a while, as a tool to help compute various mathematical constants, but it wasn’t until I began talking with its developer, Alex Yee, a researcher from NWU and now software optimization developer, that I realized that he has optimized the software like crazy to get the best performance. Naturally, any simulation that can take 20+ days can benefit from a 1% performance increase! Alex started y-cruncher as a high-school project, but it is now at a state where Alex is keeping it up to date to take advantage of the latest instruction sets before they are even made available in hardware.
For our test we run y-cruncher v0.7.6 through all the different optimized variants of the binary, single threaded and multi-threaded, including the AVX-512 optimized binaries. The test is to calculate 250m digits of Pi, and we use the single threaded and multi-threaded versions of this test.
Users can download y-cruncher from Alex’s website: http://www.numberworld.org/y-cruncher/
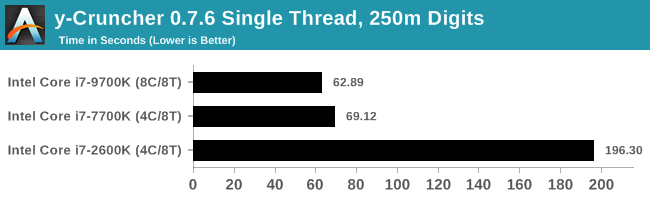
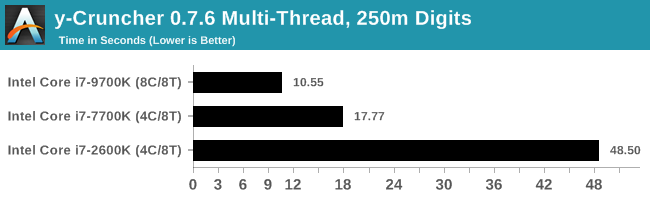
y-cruncher is another benchmark that implements as many AVX acceleration functions as possible, showcasing how newer chips than Sandy Bridge have additional benefits.
Agisoft Photoscan 1.3.3: 2D Image to 3D Model Conversion
One of the ISVs that we have worked with for a number of years is Agisoft, who develop software called PhotoScan that transforms a number of 2D images into a 3D model. This is an important tool in model development and archiving, and relies on a number of single threaded and multi-threaded algorithms to go from one side of the computation to the other.
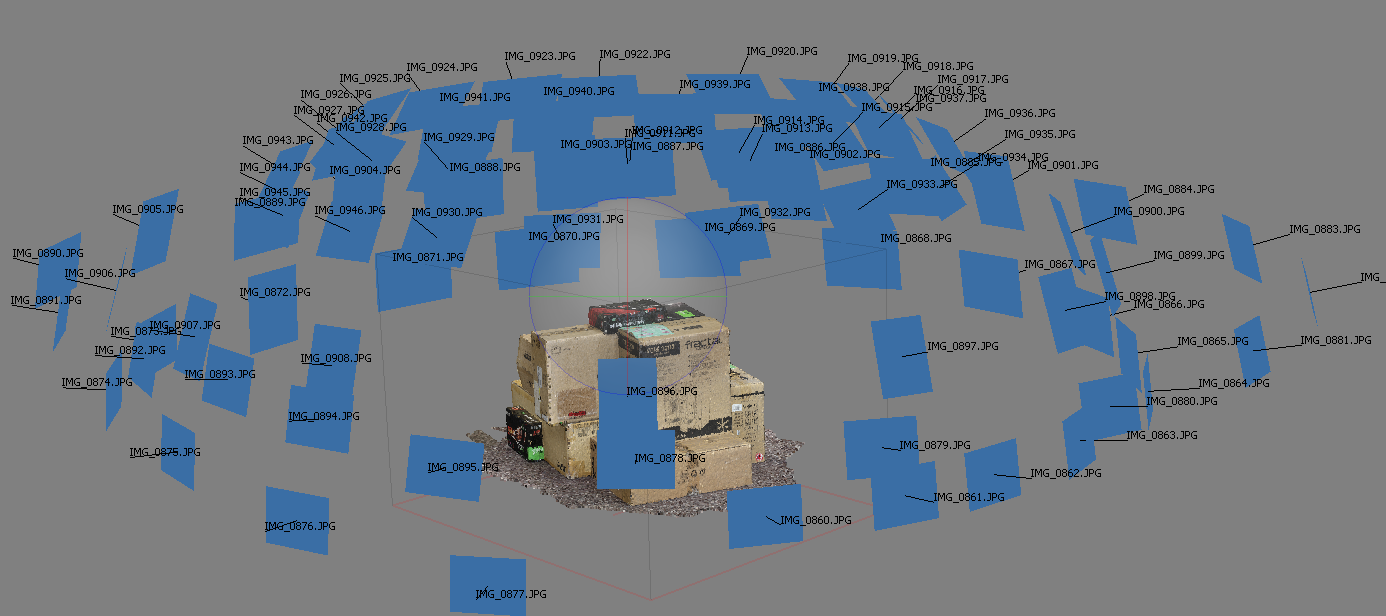
In our test, we take v1.3.3 of the software with a good sized data set of 84 x 18 megapixel photos and push it through a reasonably fast variant of the algorithms, but is still more stringent than our 2017 test. We report the total time to complete the process.
Agisoft’s Photoscan website can be found here: http://www.agisoft.com/
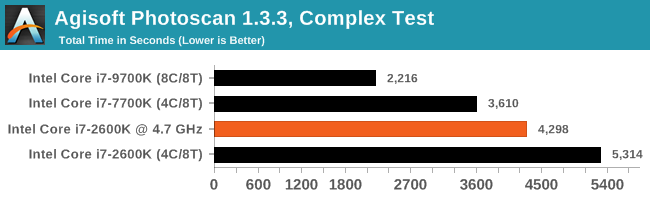
As a variable threaded test, the overclock on the 2600K gives a sizeable performance jump over the stock performance, however the 7700K at stock gets almost the same size jump again. Having more cores in the 9700K just laughs at the rest of the chips in this comparison.


213 Comments
View All Comments
Midwayman - Monday, May 13, 2019 - link
I think the biggest thing I noticed moving to a 8700k from a 2600k was the same thing I noticed moving from a core 2 duo to a 2600k. Less weird pauses. The 2600k would get weird hitches in games. System processes would pop up and tank the frame rate for an instant, or just an explosion would trigger a physics event that would make it stutter. I see that a lot less with a couple extra cores and some performance overhead.tmanini - Monday, May 13, 2019 - link
I agree, the user experience is definitely improved in those ways. Granted, many of us think our time is a bit more important than it likely really is. (does waiting 3 seconds really ruin my day?)ochadd - Monday, May 13, 2019 - link
Enjoyed the article very much.Magnus101 - Monday, May 13, 2019 - link
You get about 3Xperformance when going from an upclocked 2600k@4.5GHz to a 8700k@4.5GHz when working in DAW:s (Digital Audio Workstation), i.e running dozens and dozens of virtual instruments and plugins when making music.The thing is that it is a combination of applications that:
1. Use all the SSE/AVX or whatever all the streaming extensions that makes parallell flotaing point calculations go much faster. DAW is all about floating point calculations.
2. Are extremely real-time dependent to get ultra low latency (milliseconds in single digits).
This makes even the 7700 k about double in performance in some scenarios when compared to an equally clocked 2600k.
mikato - Monday, May 13, 2019 - link
"and Intel’s final quad-core with HyperThreading chip for desktop, the 7700K""the Core i7-7700K, Intel’s final quad-core with HyperThreading processor"
Did I miss some big news?
mapesdhs - Monday, May 13, 2019 - link
"... the best chips managed 5.0 GHz or 5.1 GHz in a daily system."Worth noting that with the refined 2700K, *all* of them run fine at 5GHz in a daily system, sensible temps, a TRUE and one fan is plenty for cooling. Threaded performance is identical to a stock 6700K, IPC is identical to a stock 2700X (880 and 177 for CB R15 Nt/1t resp.)
Also, various P67/Z68 mbds support NVMe boot via modded BIOS files. The ROG forum has a selection for ASUS, search for "ASUS bolts4breakfast"; he's added support for the M4E and M4EZ, and I think others asked the same for the Pro Gen3, etc. I'm sure there are equivalent BIOS mod threads for GIgabyte, MSI, etc. My 5GHz 2700K on an M4E has a 1TB SM961 and a 1TB 970 EVO Plus (photo/video archive), though the C-drive is still a venerable Vector 256GB which holds up well even today.
Also, RAM support runs fine with 2133 CL9 on the M4E, which is pretty good (16GB GSkill TridentX, two modules).
However, after using this for a great many years, I do find myself wanting better performance for processing images & video, so I'll likely be stepping up to a Ryzen 3000 system, at least 8 cores.
mapesdhs - Monday, May 13, 2019 - link
Forgot to mention, someting else interesting about SB is the low cost of the sibling SB-E. Would be a laugh to see how all those tests pan with with a 3930K stock/oc'd thrown into the mix. It's a pity good X79 boards are hard to find now given how cheap one can get 3930Ks for these days. If stock performance is ok though, there are some cheap Chinese boards which work pretty well, and some of them do support NVMe boot.tezcan - Monday, May 13, 2019 - link
I am still running 3930k, prices for it are still very high ~$500. Not much cheaper then what I paid for it in 2011. I am yet to really test my GTX 680's in SLI. Kind of a waste, but they are driving many displays throughout my house. There was an article where some Australian bloke guy runs an 8 core sandy bridge - e (server chip) vs all modern intel 8 core chips. It actually had the lowest latency so was best for pro gamers, lagged a little behind on everything else- but definitely good enough.dad_at - Tuesday, May 14, 2019 - link
I run 3960X at ~ 4 GHz on X79 ASUS P9X79 and have nvme boot drive with modified BIOS. So it is really interesting to compare 2011/2012 6c/12t to 8700K or 9900K. I guess it's about 7700K stock, so modern 4c/8t is like old 6c/12t. Per core perf is about 20-30% up on average and this includes higher frequency ... So IPC is only about 15% up: not impressive. Of course in some loads like AVX2 heavy apps IPC could be 50% up, but such case is not common.martixy - Monday, May 13, 2019 - link
Oh man... I just upgraded my 2600K to a 9900K and a couple days later this article drops...The timing is impeccable!
If I ever had a shred of buyer's remorse, the article conclusion eradicated it thoroughly. Give me more FPS.
I saw a screenshot of StarCraft 2. On a mission which I, again, coincidentally (this is uncanny) played today. I can now report that the 9900K can FINALLY feed my graphics card in SC2 properly. With the 2600K I'd be around 20-60 FPS depending on load and intensity of the action. With the new processors, it barely ever drops below 60 and usually hovers around 90FPS. Ingame cinematics also finally run above the "cinematic" 30 FPS I saw on my trusty old 2600K.