The Western Digital WD Black SN750 SSD Review: Why Fix What Isn't Broken?
by Billy Tallis on January 18, 2019 8:01 AM ESTWhole-Drive Fill
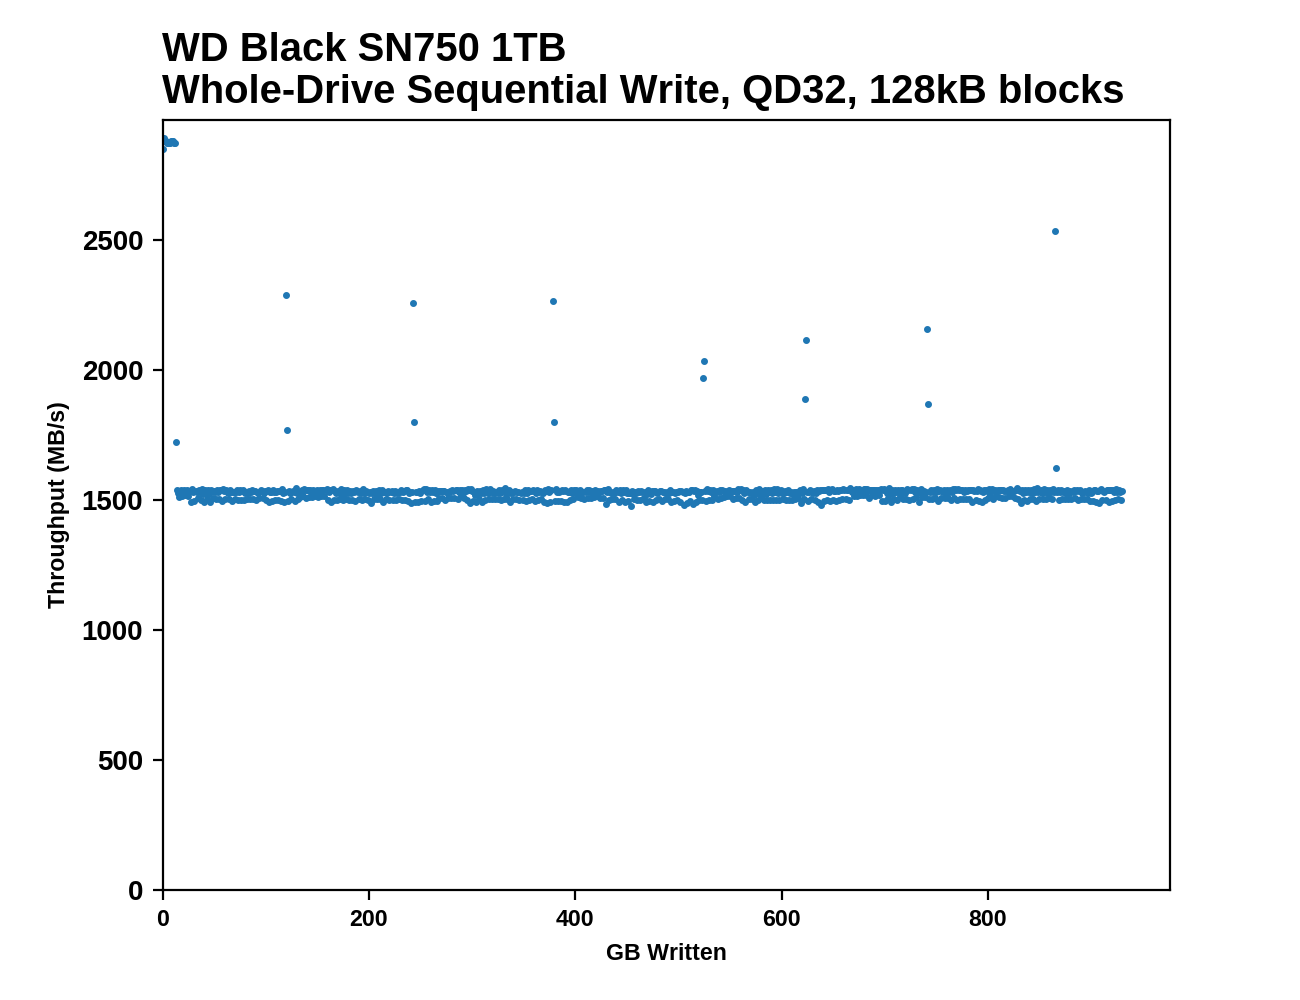
This test starts with a freshly-erased drive and fills it with 128kB sequential writes at queue depth 32, recording the write speed for each 1GB segment. This test is not representative of any ordinary client/consumer usage pattern, but it does allow us to observe transitions in the drive's behavior as it fills up. This can allow us to estimate the size of any SLC write cache, and get a sense for how much performance remains on the rare occasions where real-world usage keeps writing data after filling the cache.
 |
|||||||||
The WD Black SN750's behavior during a full drive write is quite similar to that of its predecessor, albeit with a 5% improvement in write speed after the SLC cache fills up. The cache fills after about 12GB of writes, but since performance after the drop is steady at around 1.5GB/s the small cache isn't really a problem.
 |
|||||||||
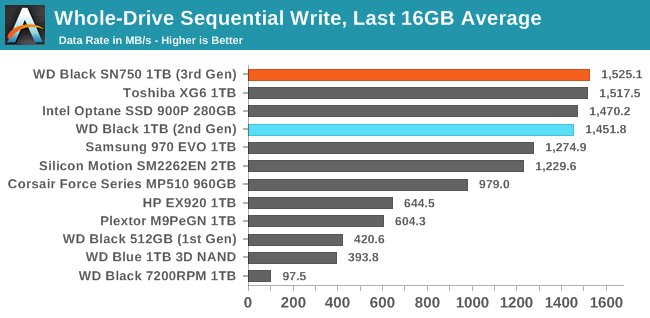
| Average Throughput for last 16 GB | Overall Average Throughput | ||||||||
The WD Black SN750 offers best in class performance for long-duration sequential writes. After the SLC cache is full, the SN750 is about 5% faster than its predecessor for filling the rest of the drive. When looking at the total time to fill the drive, the SN750's advantage is slightly higher because its write speed to the SLC cache is also a bit faster.
BAPCo SYSmark 2018
BAPCo's SYSmark 2018 is an application-based benchmark that uses real-world applications to replay usage patterns of business users, with subscores for productivity, creativity and responsiveness. Scores represnt overall system performance and are calibrated against a reference system that is defined to score 1000 in each of the scenarios. A score of, say, 2000, would imply that the system under test is twice as fast as the reference system.
SYSmark scores are based on total application response time as seen by the user, including not only storage latency but time spent by the processor. This means there's a limit to how much a storage improvement could possibly increase scores, because the SSD is only in use for a small fraction of the total test duration. This is a significant difference from our ATSB tests where only the storage portion of the workload is replicated and disk idle times are cut short to a maximum of 25ms.
| AnandTech SYSmark SSD Testbed | |
| CPU | Intel Core i5-7400 |
| Motherboard | ASUS PRIME Z270-A |
| Chipset | Intel Z270 |
| Memory | 2x 8GB Corsair Vengeance DDR4-2400 CL17 |
| Case | In Win C583 |
| Power Supply | Cooler Master G550M |
| OS | Windows 10 64-bit, version 1803 |
Our SSD testing with SYSmark uses a different test system than the rest of our SSD tests. This machine is set up to measure total system power consumption rather than just the drive's power.
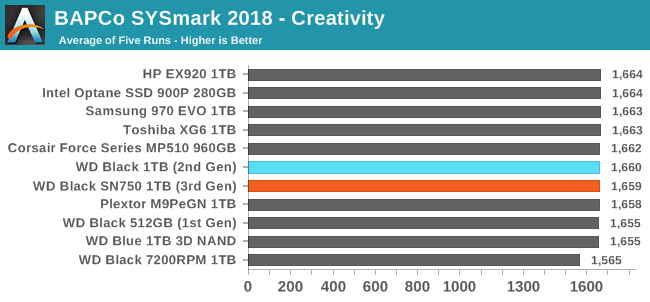
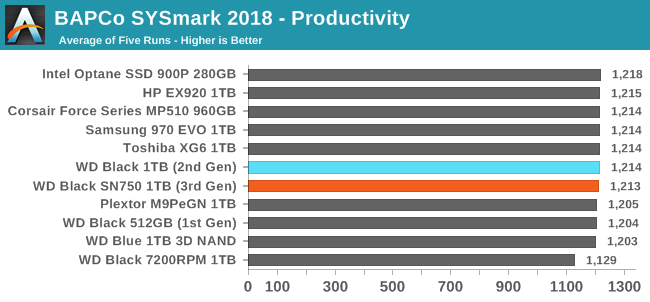
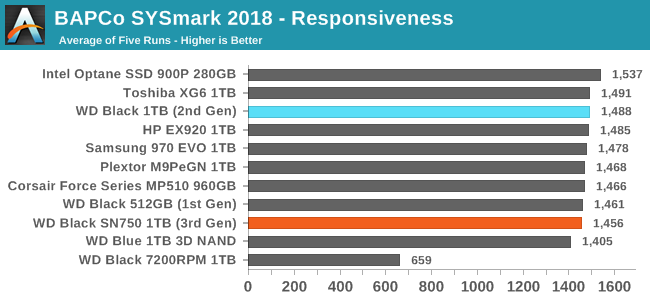
The new WD Black SN750 regresses slightly in performance on SYSmark 2018, primarily on the responsiveness test, which is the subscore that's most sensitive to storage performance. The SN750 still clearly outperforms the WD Blue SATA SSD but even managed to fall behind the first-generation WD Black that used planar TLC and a third-party controller.
Energy Usage
The SYSmark energy usage scores measure total system power consumption, excluding the display. Our SYSmark test system idles at around 26 W and peaks at over 60 W measured at the wall during the benchmark run. SATA SSDs seldom exceed 5 W and idle at a fraction of a watt, and the SSDs spend most of the test idle. This means the energy usage scores will inevitably be very close. A typical notebook system will tend to be better optimized for power efficiency than this desktop system, so the SSD would account for a much larger portion of the total and the score difference between SSDs would be more noticeable.
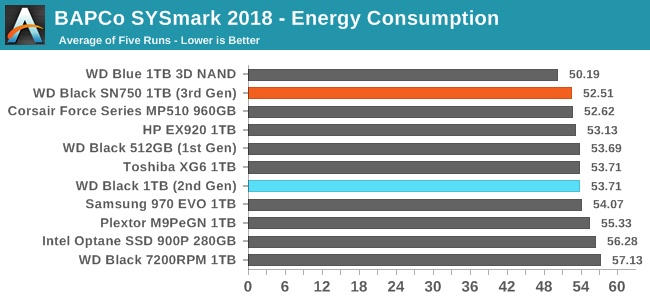
The WD Black SN750 turns in an excellent energy consumption score, lower than any drive in this bunch save for the WD Blue SATA SSD.


54 Comments
View All Comments
iwod - Friday, January 18, 2019 - link
Patiently waiting for PCI-E 5.0 SSD, that is 16GB/s for 4x.Ryan Smith - Friday, January 18, 2019 - link
So for what it's worth, the last time I talked to the PCI-SIG about PCIe 5, they were saying that they were expecting it to be used in conjunction with PCIe 4 rather than replacing it. The idea being that the PCIe x16 slot closest to the CPU would be a PCIe 5 slot, while everything else would be PCIe 4 due to the distances and signal integrity issues involved.If that's still the plan, then I wouldn't expect to see PCIe 5 SSDs, at least not in the M.2 form factor.
iwod - Saturday, January 19, 2019 - link
Thx. But surely Directly Attached NAND from SSD is more important? It is way more latency sensitive than GPU.I am wondering if we could get sort of like 20x Slot with 16x bandwidth. So 4x for SSD, and 8x * 2 for GPU.Most people are still using a single graphics card, I would be fine with 8x GPU PCI-E 5.0 and 4x for SSD.
Does that mean we might never see Thunderbolt 5 with PCI-E 5 signalling?
GreenReaper - Saturday, January 19, 2019 - link
Basically this is how PCIe 4 is likely to work for many existing AMD motherboards.ScouserPcgamer - Friday, January 18, 2019 - link
The Seagate Firecuda wipes the floor of read/write speeds, this is like a 1% improvement over the 2018 modelLogitechFan - Friday, January 18, 2019 - link
And then comes 970 Pro and wipes the floor with all of them and spits on their graves.LogitechFan - Friday, January 18, 2019 - link
970 Pro is not on the list?! WTF is this, an Intel commercial?!Oxford Guy - Friday, January 18, 2019 - link
What is and isn't tested is sometimes very strange here. The Nvidia GTX 960, for example, was never tested."Editor's Note: Due to personal matters we won’t have a GeForce GTX 960 review published today. But in lieu of that we wanted to go over the basics of NVIDIA’s latest Maxwell card"
Today or ever.
"Anyhow, that’s a wrap from us for now. Be sure to check back in early next week for our complete look at GeForce GTX 960, including performance, overclocking, HEVC support, and more."
Still waiting... Those promises were posted in 2015.
Oxford Guy - Friday, January 18, 2019 - link
"Conspiracy theorists" claimed the card wasn't tested because it was a turkey, making Nvidia look bad.Has Anandtech staff ever explained why the promised review never materialized?
Ryan Smith - Friday, January 18, 2019 - link
"Has Anandtech staff ever explained why the promised review never materialized?"Honestly, we're busy and despite our best efforts, sometimes bite off more than we can chew. Especially as we have imperfect vision about what products may show up on our doorsteps tomorrow.