The Intel Xeon W-3175X Review: 28 Unlocked Cores, $2999
by Ian Cutress on January 30, 2019 9:00 AM ESTCPU Performance: System Tests
Our System Test section focuses significantly on real-world testing, user experience, with a slight nod to throughput. In this section we cover application loading time, image processing, simple scientific physics, emulation, neural simulation, optimized compute, and 3D model development, with a combination of readily available and custom software. For some of these tests, the bigger suites such as PCMark do cover them (we publish those values in our office section), although multiple perspectives is always beneficial. In all our tests we will explain in-depth what is being tested, and how we are testing.
All of our benchmark results can also be found in our benchmark engine, Bench.
For our graphs, some of them have two values: a regular value in orange, and one in red called 'Intel Spec'. ASUS offers the option to 'open up' the power and current limits of the chip, so the CPU is still running at the same frequency but is not throttled. Despite Intel saying that they recommend 'Intel Spec', the system they sent to us to test was actually set up with the power limits opened up, and the results they provided for us to compare to internally also correlated with that setting. As a result, we're providing both sets results for our CPU tests.
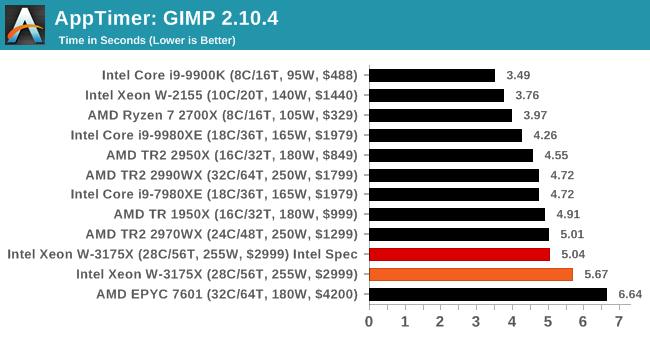
Application Load: GIMP 2.10.4
One of the most important aspects about user experience and workflow is how fast does a system respond. A good test of this is to see how long it takes for an application to load. Most applications these days, when on an SSD, load fairly instantly, however some office tools require asset pre-loading before being available. Most operating systems employ caching as well, so when certain software is loaded repeatedly (web browser, office tools), then can be initialized much quicker.
In our last suite, we tested how long it took to load a large PDF in Adobe Acrobat. Unfortunately this test was a nightmare to program for, and didn’t transfer over to Win10 RS3 easily. In the meantime we discovered an application that can automate this test, and we put it up against GIMP, a popular free open-source online photo editing tool, and the major alternative to Adobe Photoshop. We set it to load a large 50MB design template, and perform the load 10 times with 10 seconds in-between each. Due to caching, the first 3-5 results are often slower than the rest, and time to cache can be inconsistent, we take the average of the last five results to show CPU processing on cached loading.
.
FCAT: Image Processing
The FCAT software was developed to help detect microstuttering, dropped frames, and run frames in graphics benchmarks when two accelerators were paired together to render a scene. Due to game engines and graphics drivers, not all GPU combinations performed ideally, which led to this software fixing colors to each rendered frame and dynamic raw recording of the data using a video capture device.
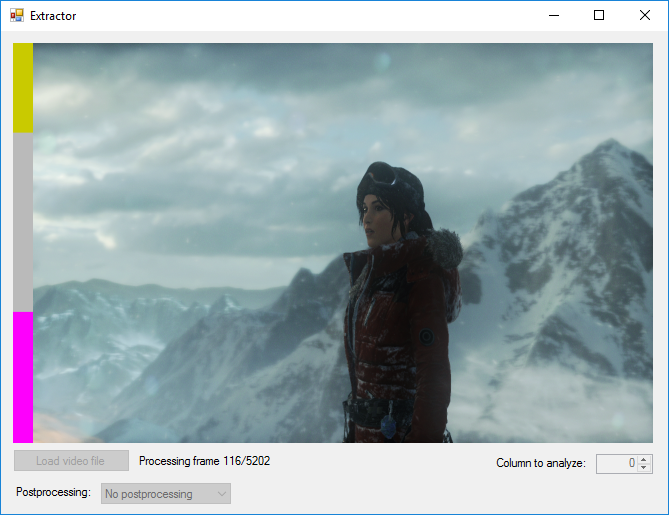
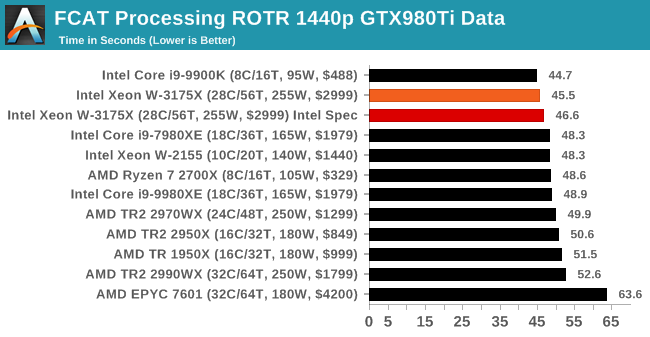
The FCAT software takes that recorded video, which in our case is 90 seconds of a 1440p run of Rise of the Tomb Raider, and processes that color data into frame time data so the system can plot an ‘observed’ frame rate, and correlate that to the power consumption of the accelerators. This test, by virtue of how quickly it was put together, is single threaded. We run the process and report the time to completion.
.
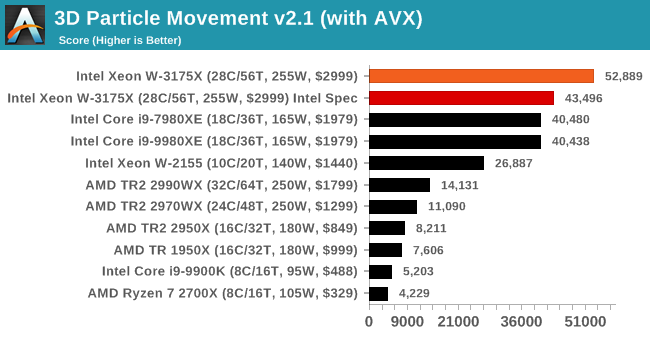
3D Particle Movement v2.1: Brownian Motion
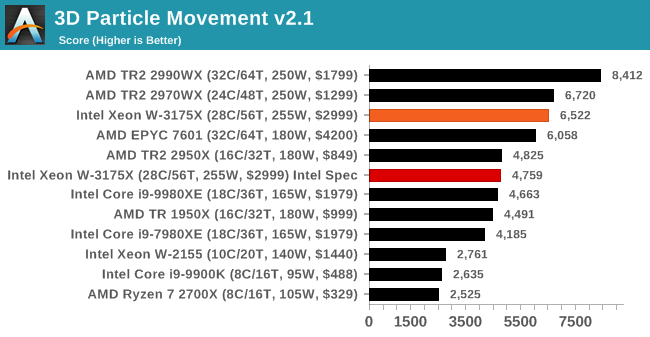
Our 3DPM test is a custom built benchmark designed to simulate six different particle movement algorithms of points in a 3D space. The algorithms were developed as part of my PhD., and while ultimately perform best on a GPU, provide a good idea on how instruction streams are interpreted by different microarchitectures.
A key part of the algorithms is the random number generation – we use relatively fast generation which ends up implementing dependency chains in the code. The upgrade over the naïve first version of this code solved for false sharing in the caches, a major bottleneck. We are also looking at AVX2 and AVX512 versions of this benchmark for future reviews.
For this test, we run a stock particle set over the six algorithms for 20 seconds apiece, with 10 second pauses, and report the total rate of particle movement, in millions of operations (movements) per second. We have a non-AVX version and an AVX version, with the latter implementing AVX512 and AVX2 where possible.
3DPM v2.1 can be downloaded from our server: 3DPMv2.1.rar (13.0 MB)
.
.
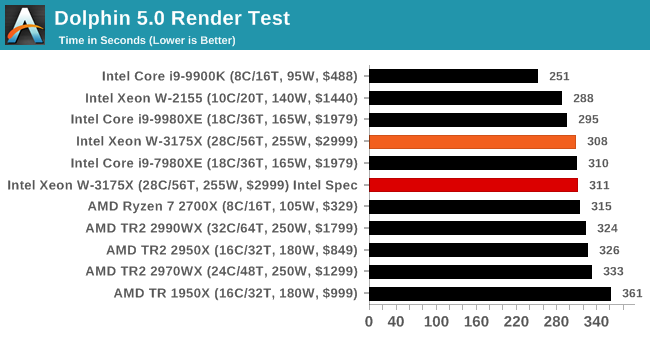
Dolphin 5.0: Console Emulation
One of the popular requested tests in our suite is to do with console emulation. Being able to pick up a game from an older system and run it as expected depends on the overhead of the emulator: it takes a significantly more powerful x86 system to be able to accurately emulate an older non-x86 console, especially if code for that console was made to abuse certain physical bugs in the hardware.
For our test, we use the popular Dolphin emulation software, and run a compute project through it to determine how close to a standard console system our processors can emulate. In this test, a Nintendo Wii would take around 1050 seconds.
The latest version of Dolphin can be downloaded from https://dolphin-emu.org/
.
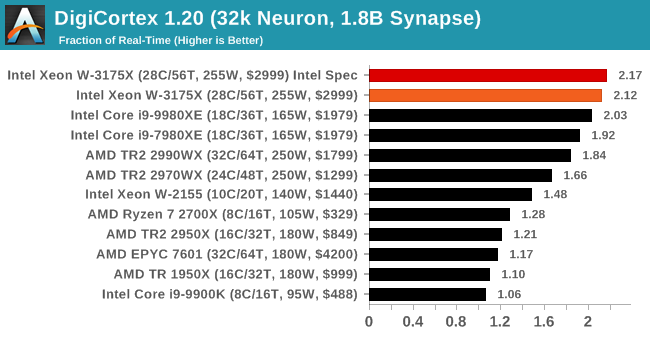
DigiCortex 1.20: Sea Slug Brain Simulation
This benchmark was originally designed for simulation and visualization of neuron and synapse activity, as is commonly found in the brain. The software comes with a variety of benchmark modes, and we take the small benchmark which runs a 32k neuron / 1.8B synapse simulation, equivalent to a Sea Slug.

Example of a 2.1B neuron simulation
We report the results as the ability to simulate the data as a fraction of real-time, so anything above a ‘one’ is suitable for real-time work. Out of the two modes, a ‘non-firing’ mode which is DRAM heavy and a ‘firing’ mode which has CPU work, we choose the latter. Despite this, the benchmark is still affected by DRAM speed a fair amount.
DigiCortex can be downloaded from http://www.digicortex.net/
.
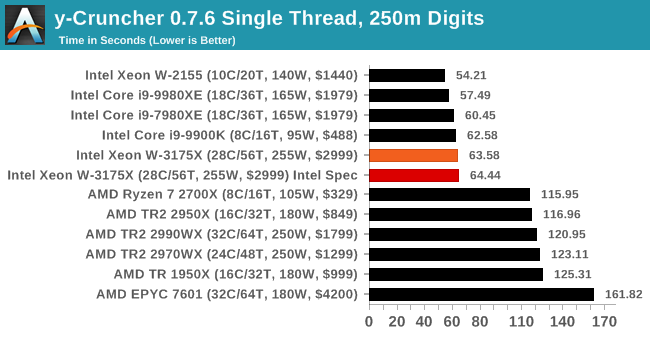
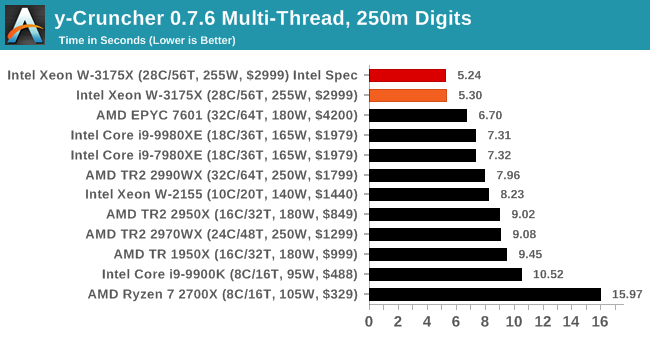
y-Cruncher v0.7.6: Microarchitecture Optimized Compute
I’ve known about y-Cruncher for a while, as a tool to help compute various mathematical constants, but it wasn’t until I began talking with its developer, Alex Yee, a researcher from NWU and now software optimization developer, that I realized that he has optimized the software like crazy to get the best performance. Naturally, any simulation that can take 20+ days can benefit from a 1% performance increase! Alex started y-cruncher as a high-school project, but it is now at a state where Alex is keeping it up to date to take advantage of the latest instruction sets before they are even made available in hardware.
For our test we run y-cruncher v0.7.6 through all the different optimized variants of the binary, single threaded and multi-threaded, including the AVX-512 optimized binaries. The test is to calculate 250m digits of Pi, and we use the single threaded and multi-threaded versions of this test.
Users can download y-cruncher from Alex’s website: http://www.numberworld.org/y-cruncher/
.
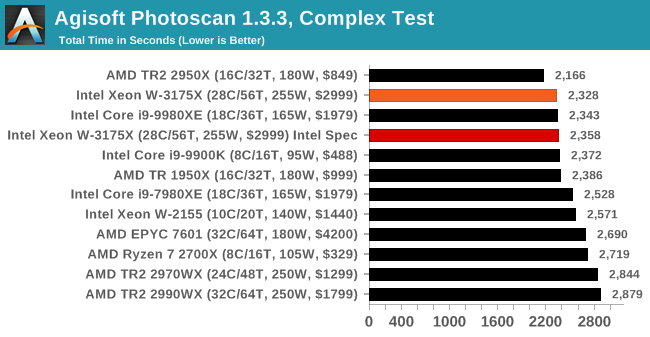
Agisoft Photoscan 1.3.3: 2D Image to 3D Model Conversion
One of the ISVs that we have worked with for a number of years is Agisoft, who develop software called PhotoScan that transforms a number of 2D images into a 3D model. This is an important tool in model development and archiving, and relies on a number of single threaded and multi-threaded algorithms to go from one side of the computation to the other.
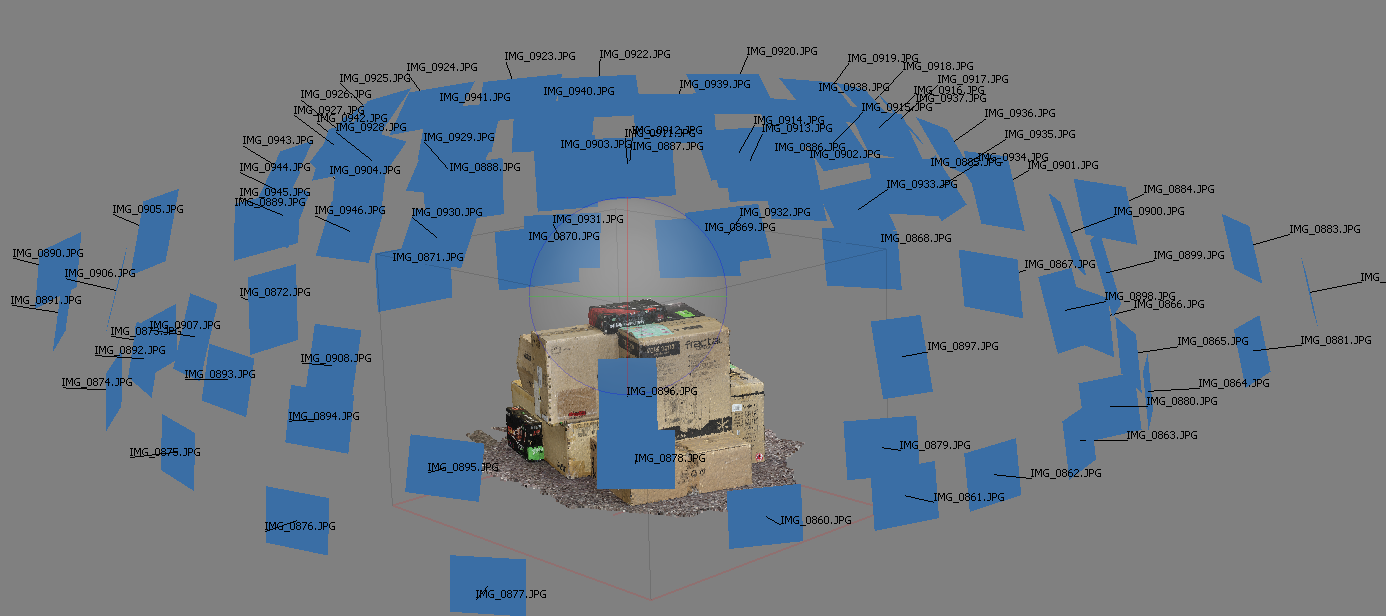
In our test, we take v1.3.3 of the software with a good sized data set of 84 x 18 megapixel photos and push it through a reasonably fast variant of the algorithms, but is still more stringent than our 2017 test. We report the total time to complete the process.
Agisoft’s Photoscan website can be found here: http://www.agisoft.com/
.


136 Comments
View All Comments
abufrejoval - Wednesday, January 30, 2019 - link
So with the limited edition production numbers, quite clearly the price can be symbolically low, just so Intel can claim bragging rights: They are not interested in satisfying market demands, especially since far too many workstation and server customers might switch over from a Xeon Scalable offering, they just want to claim victory... everywhere... including 10nmJust pathetic!
And honestly, you shouldn't even report about it. Your mission is to inform consumers on products they can buy. If consumers cannot buy it, you should treat it very, very differently, if at all.
You're just being abused by Intel to push a brand that suffers for reasons.
SH3200 - Wednesday, January 30, 2019 - link
This product cannibalizes half the current Xeon lineup as it provides ecc/rdimm at a fraction of the cost. I’d be amazed if FSI customers don’t prebuy every single one ever made before it even hits the public.br83taylor - Wednesday, January 30, 2019 - link
I find it odd Ian is happy to run and report benchmarks with this processor going against Intel recommendation for bios settings, yet would not do it for the AMD processors with their PBO setting. Both of which seem to do very similar things. Letting the 2990WX run with PBO would give it a much fairer chance against this.GreenReaper - Thursday, January 31, 2019 - link
It's not unressonablr to test the system as given to you, especially when it is provided as a complete system, so may represent what end-users get. That said, it seems like he kinda called that out in the sideways manner by highlighting the fact that the system Intel had shipped to him was not actually using those specifications.outsideloop - Wednesday, January 30, 2019 - link
This reminds me of the FX-9590. Massively overclocking silicon to keep up. Except now, the shoe is on the other foot.wow&wow - Wednesday, January 30, 2019 - link
Xeon W-3175X: $2999+$1500= $4499Ryzen TR 2900WX: $1799+$300= $2099
Is Intel trying to market it for “stupids” or those whose left brains being not right and right brains having nothing left :-D
ksec - Wednesday, January 30, 2019 - link
I think we need some new innovation in Thermal Cooling, how we could cool more with less, ease and cheaper. We pushed to near 600W for CPU and GPU alone.mapesdhs - Saturday, February 2, 2019 - link
Ye cannae beat the laws of physics. :D Thermal density is a hard problem. Check out AdoredTV's video on the subject, it explains things nicely.The_Assimilator - Wednesday, January 30, 2019 - link
This is Pentium 4 days all over again.bananaforscale - Thursday, January 31, 2019 - link
Kitty approves of heat output.