The Intel Xeon W-3175X Review: 28 Unlocked Cores, $2999
by Ian Cutress on January 30, 2019 9:00 AM ESTCPU Performance: Office Tests
The Office test suite is designed to focus around more industry standard tests that focus on office workflows, system meetings, some synthetics, but we also bundle compiler performance in with this section. For users that have to evaluate hardware in general, these are usually the benchmarks that most consider.
All of our benchmark results can also be found in our benchmark engine, Bench.
For our graphs, some of them have two values: a regular value in orange, and one in red called 'Intel Spec'. ASUS offers the option to 'open up' the power and current limits of the chip, so the CPU is still running at the same frequency but is not throttled. Despite Intel saying that they recommend 'Intel Spec', the system they sent to us to test was actually set up with the power limits opened up, and the results they provided for us to compare to internally also correlated with that setting. As a result, we're providing both sets results for our CPU tests.
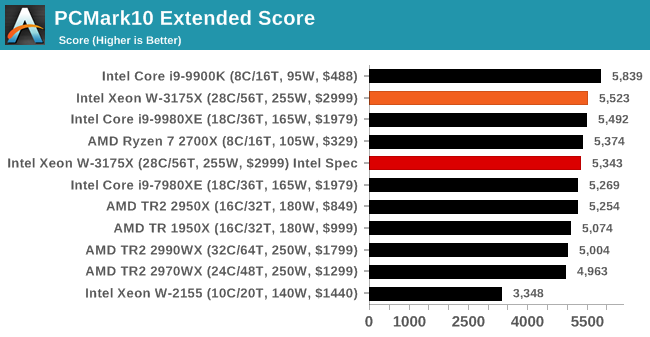
PCMark 10: Industry Standard System Profiler
Futuremark, now known as UL, has developed benchmarks that have become industry standards for around two decades. The latest complete system test suite is PCMark 10, upgrading over PCMark 8 with updated tests and more OpenCL invested into use cases such as video streaming.
PCMark splits its scores into about 14 different areas, including application startup, web, spreadsheets, photo editing, rendering, video conferencing, and physics. We post all of these numbers in our benchmark database, Bench, however the key metric for the review is the overall score.
.
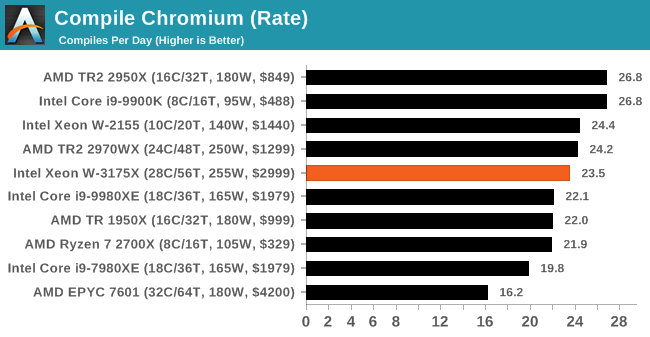
Chromium Compile: Windows VC++ Compile of Chrome 56
A large number of AnandTech readers are software engineers, looking at how the hardware they use performs. While compiling a Linux kernel is ‘standard’ for the reviewers who often compile, our test is a little more varied – we are using the windows instructions to compile Chrome, specifically a Chrome 56 build from March 2017, as that was when we built the test. Google quite handily gives instructions on how to compile with Windows, along with a 400k file download for the repo.
In our test, using Google’s instructions, we use the MSVC compiler and ninja developer tools to manage the compile. As you may expect, the benchmark is variably threaded, with a mix of DRAM requirements that benefit from faster caches. Data procured in our test is the time taken for the compile, which we convert into compiles per day.
.
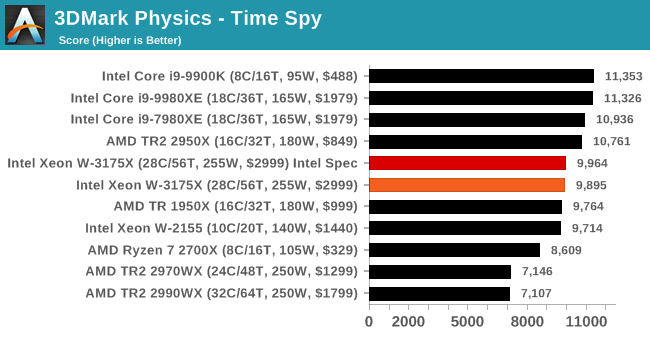
3DMark Physics: In-Game Physics Compute
Alongside PCMark is 3DMark, Futuremark’s (UL’s) gaming test suite. Each gaming tests consists of one or two GPU heavy scenes, along with a physics test that is indicative of when the test was written and the platform it is aimed at. The main overriding tests, in order of complexity, are Ice Storm, Cloud Gate, Sky Diver, Fire Strike, and Time Spy.
Some of the subtests offer variants, such as Ice Storm Unlimited, which is aimed at mobile platforms with an off-screen rendering, or Fire Strike Ultra which is aimed at high-end 4K systems with lots of the added features turned on. Time Spy also currently has an AVX-512 mode (which we may be using in the future).
.
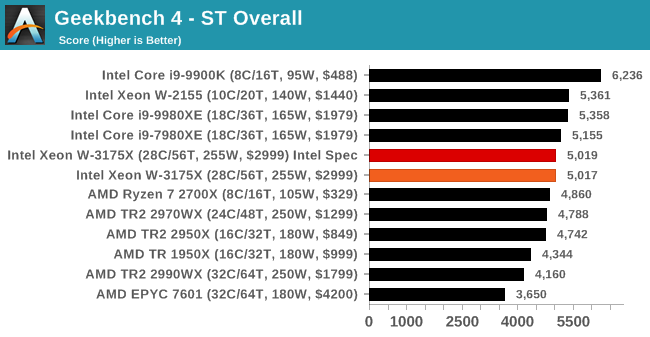
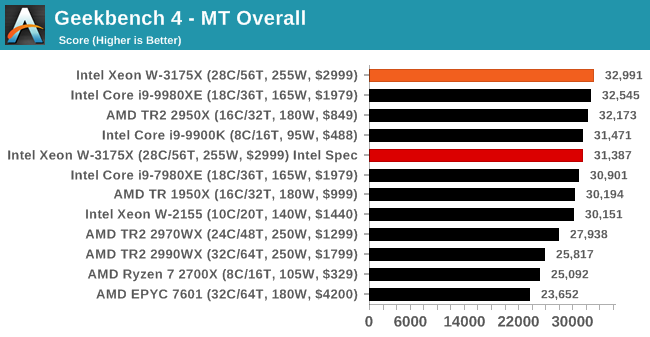
GeekBench4: Synthetics
A common tool for cross-platform testing between mobile, PC, and Mac, GeekBench 4 is an ultimate exercise in synthetic testing across a range of algorithms looking for peak throughput. Tests include encryption, compression, fast Fourier transform, memory operations, n-body physics, matrix operations, histogram manipulation, and HTML parsing.
I’m including this test due to popular demand, although the results do come across as overly synthetic, and a lot of users often put a lot of weight behind the test due to the fact that it is compiled across different platforms (although with different compilers).
We record the main subtest scores (Crypto, Integer, Floating Point, Memory) in our benchmark database, but for the review we post the overall single and multi-threaded results.


136 Comments
View All Comments
tamalero - Wednesday, January 30, 2019 - link
Aaah yes.. the presenter "forgot" to say it was heavily overclocked..arh2o - Wednesday, January 30, 2019 - link
Hey Ian, nice review. But you guys really need to stop testing games with an ancient GTX 1080 from 1H 2016...it's almost 3 years old now. You're clearly GPU bottle-necked on a bunch of these games you've benchmarked. At least use a RTX 2080, but if you're really insistent on keeping the GTX 1080, bench at 720p with it instead of your IGP. For example:Final Fantasy XV: All your CPUs have FPS between 1-4 frames of difference. Easy to spot GPU bottleneck here.
Shadow of War Low: Ditto, all CPUs bench within the 96-100 FPS range. Also, what's the point of even including the medium and high numbers? It's decimal point differences on the FPS, not even a whole number difference. Clearly GPU bottle-necked here even at 1080p unfortunately.
eddman - Wednesday, January 30, 2019 - link
Xeons don't even have an IGP. That IGP in the tables is simply the name they chose for that settings, which includes 720 resolution, since it represents a probable use case for an IGP.Anyway, you are right about the card. They should've used a faster one, although IMO game benchmarks are pointless for such CPUs.
BushLin - Wednesday, January 30, 2019 - link
I'm glad they're using the same card for years so it can be directly compared to previous benchmarks and we can see how performance scales with cores vs clock speed.Mitch89 - Friday, February 1, 2019 - link
That’s a poor rationale, you wouldn’t pair a top-end CPU with an outdated GPU if you were building a system that needs both CPU and GPU performance.SH3200 - Wednesday, January 30, 2019 - link
For all the jokes its getting doesn't the 7290F actually run at a higher TDP using the same socket? Intel couldn't have just have taken the coolers from the Xeon DAP WSes and used those instead?evernessince - Wednesday, January 30, 2019 - link
How is 3K priced right? You can purchased a 2990WX for half that price and 98% of the performance. $1,500 is a lot of extra money in your wallet.GreenReaper - Thursday, January 31, 2019 - link
Maybe they thought since it was called the 2990WX it cost $2990...tygrus - Wednesday, January 30, 2019 - link
1) A few cases showed the 18core Intel CPU beat their 28core. I assume the benchmark and/or OS is contributing to a reduced performance for the 28 core Intel and the 32 core AMD (TR 2950 beats TR 2990 a few times).2) Do you really want to use 60% more power for <25% increase of performance?
3) This chip is a bit like the 1.13GHz race in terms of such a small release & high cost it should be ignored by most of us as a marketing stunt.
GreenReaper - Thursday, January 31, 2019 - link
Fewer cores may be able to boost faster and have less contention for shared resources such as memory bandwidth. This CPU tends to only win by any significant margin when it whenuse all of its cores. Heck, you have the 2700X up there in many cases.