The Enterpise TLC Storage Era Begins: Rounding Up 13 SSDs With Samsung, Intel, and Memblaze
by Billy Tallis on January 3, 2019 9:45 AM ESTPeak Throughput And Steady State
For client/consumer SSDs we primarily focus on low queue depth performance for its relevance to interactive workloads. Server workloads are often intense enough to keep a pile of drives busy, to the maximum attainable throughput of enterprise SSDs is actually important. But it usually isn't a good idea to focus solely on throughput while ignoring latency, because somewhere down the line there's always an end user waiting for the server to respond.
In order to characterize the maximum throughput an SSD can reach, we need to test at a range of queue depths. Different drives will reach their full speed at different queue depths, and increasing the queue depth beyond that saturation point may be slightly detrimental to performance, and will drastically and unnecessarily increase latency. SATA drives can only have 32 pending commands in their queue, and any attempt to benchmark at higher queue depths will just result in commands sitting in the operating system's queues before being issued to the drive. On the other hand, some high-end NVMe SSDs need queue depths well beyond 32 to reach full speed.
Because of the above, we are not going to compare drives at a single fixed queue depth. Instead, each drive was tested at a range of queue depths up to the excessively high QD 512. For each drive, the queue depth with the highest performance was identified. Rather than report that value, we're reporting the throughput, latency, and power efficiency for the lowest queue depth that provides at least 95% of the highest obtainable performance. This often yields much more reasonable latency numbers, and is representative of how a reasonable operating system's IO scheduler should behave. (Our tests have to be run with any such scheduler disabled, or we would not get the queue depths we ask for.)
One extra complication is the choice of how to generate a specified queue depth with software. A single thread can issue multiple I/O requests using asynchronous APIs, but this runs into at least one of two problems: if each system call issues one read or write command, then context switch overhead becomes the bottleneck long before a high-end NVMe SSD's abilities are fully taxed. Alternatively, if many operations are batched together for each system call, then the real queue depth will vary significantly and it is harder to get an accurate picture of drive latency.
Using multiple threads to perform IO gets around the limits of single-core software overhead, and brings an extra advantage for NVMe SSDs: the use of multiple queues per drive. The NVMe drives in this review all support 32 separate IO queues, so we can have 32 threads on separate cores independently issuing IO without any need for synchronization or locking between threads. For even higher queue depths, we could use a combination of techniques: one thread per drive queue, issuing multiple IOs with asynchronous APIs. But this is getting into the realm of micro-optimization that most applications will never be properly tuned for, so instead the highest queue depths in these tests are still generated by having N threads issuing synchronous requests one at a time, and it's up to the OS to handle the rest.
Peak Random Read Performance
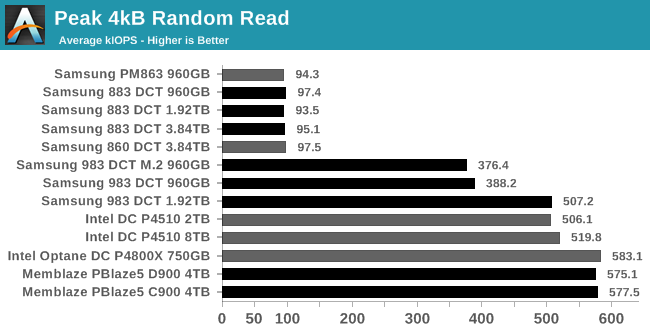
The SATA drives all have no trouble more or less saturating their host interface; they have plenty of flash that could service more read requests if they could actually be delivered to the drive quickly enough. Among NVMe drives, we see some dependence on capacity, with the 960GB Samsung 983 DCT falling well short of the 1.92TB model. The rest of the NVMe drives make it past half a million IOPS before software overhead on the host system becomes a bottleneck, so we don't even get close to seeing the PBlaze5 hit its rated 1M IOPS.
 |
|||||||||
| Power Efficiency in kIOPS/W | Average Power in W | ||||||||
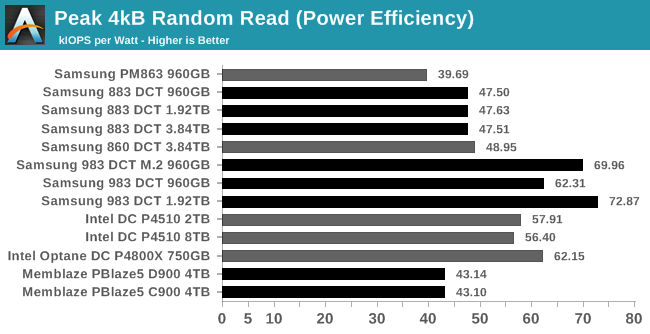
The Samsung 983 DCT offers the best power efficiency on this random read test, because the drives with bigger, more power-hungry controllers weren't able to show off their full abilities without hitting bottlenecks elsewhere in the system. The SATA drives offer respectable power efficiency as well, since they are only drawing about 2W to saturate the SATA link.
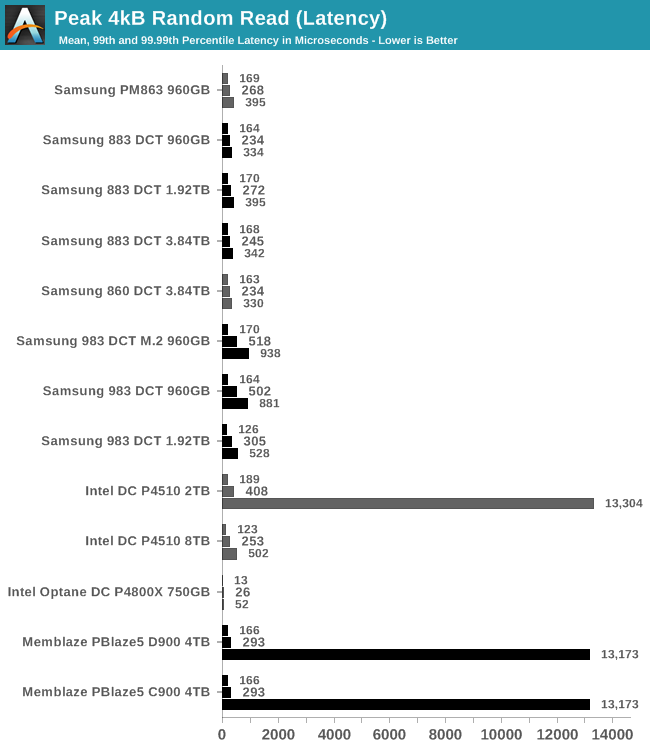
The 2TB P4510 and both PBlaze5 drives have consistency issues at the 99.99th percentile level, but are fine at the more relaxed 99th percentile threshold. The Optane SSD's latency scores are an order of magnitude better than any of the other NVMe SSDs, and it was the Optane SSD that delivered the highest overall throughput.
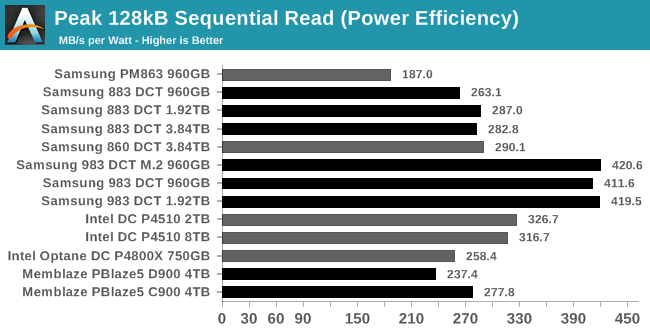
Peak Sequential Read Performance
Since this test consists of many threads each performing IO sequentially but without coordination between threads, there's more work for the SSD controller and less opportunity for pre-fetching than there would be with a single thread reading sequentially across the whole drive. The workload as tested bears closer resemblance to a file server streaming to several simultaneous users, rather than resembling a full-disk backup image creation.
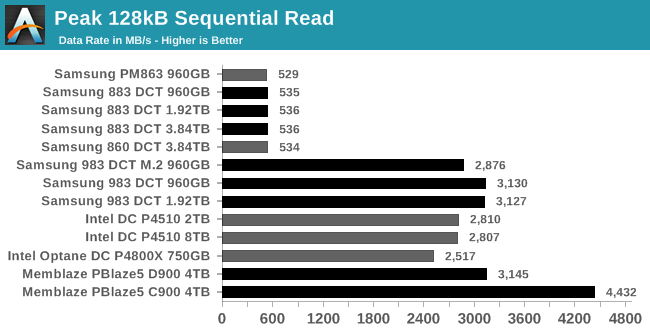
The Intel drives don't quite match the performance of the Samsung 983 DCT or the slower PBlaze5. The Optane SSD ends up being the slowest NVMe drive on this test, but it's actually slightly faster than its spec sheet indicates. The Optane SSD's 3D XPoint memory has very low latency, but that doesn't change the fact that the drive's controller only has seven channels to work with. The PBlaze5s are the two fastest drives on this test, but they're both performing significantly below expectations.
 |
|||||||||
| Power Efficiency in MB/s/W | Average Power in W | ||||||||
The Samsung 983 DCT clearly has the lead for power efficiency, followed by the slightly slower and more power-hungry Intel P4510. The current-generation SATA drives from Samsung mostly stay below 2W and end up with decent efficiency scores despite the severe performance bottleneck they have to contend with.
Steady-State Random Write Performance
The hardest task for most enterprise SSDs is to cope with an unending stream of writes. Once all the spare area granted by the high overprovisioning ratios has been used up, the drive has to perform garbage collection while simultaneously continuing to service new write requests, and all while maintaining consistent performance. The next two tests show how the drives hold up after hours of non-stop writes to an already full drive.
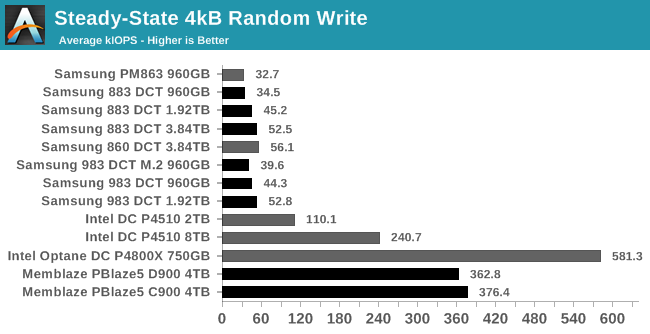
The Samsung drives don't even come close to saturating their host interfaces, but they are performing according to spec for steady-state random writes, with higher-capacity models offering clearly better performance. The Intel and Memblaze drives have a huge advantage, with the slower P4510 maintaining twice the throughput that a 983 DCT can handle.
 |
|||||||||
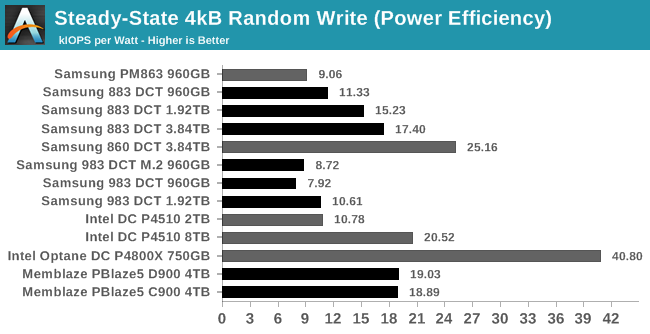
| Power Efficiency in kIOPS/W | Average Power in W | ||||||||
The Samsung 983 DCTs used about 1.5W more power to deliver only slightly higher speeds than the Samsung SATA drives, so the NVMe drives wind up with some of the worst power efficiency ratings. The Optane SSD with its wide performance lead more than makes up for its rather high power consumption. In second place for efficiency is the lowly Samsung 860 DCT; despite our best efforts, it continued deliver higher than spec performance results on this test, while drawing less power than the 883 DCT.
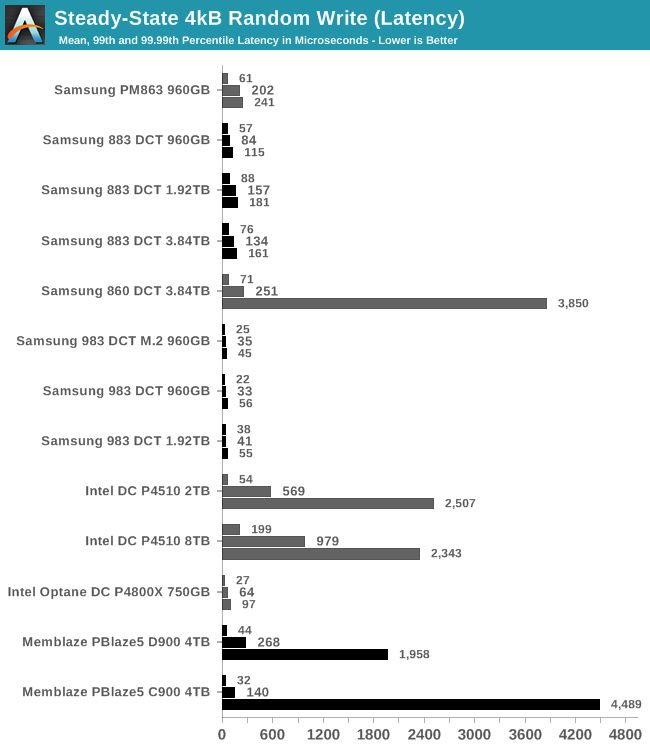
The random write throughput provided by the Samsung 983 DCT at steady-state is nothing special, but it delivers that performance with low latency and extremely good consistency that rivals the Optane SSD. The Intel P4510 and Memblaze PBlaze5 SSDs provide much higher throughput, but with tail latencies that extend into the millisecond range. Samsung's 883 DCT SATA drive also has decent latency behavior that is far better than the 860 DCT.
Steady-State Sequential Write Performance
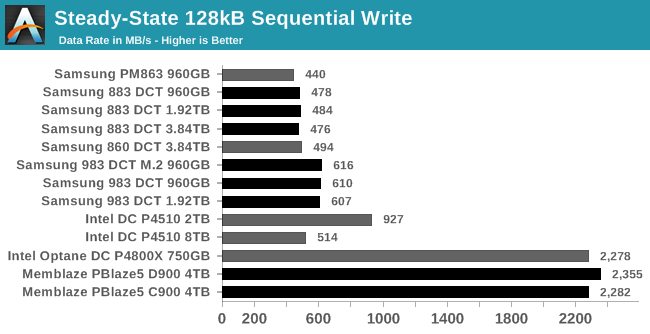
The steady-state sequential write test mostly levels the playing field. Even the NVMe drives rated at or below 1 DWPD offer largely SATA-like write throughput, and only the generously overprovisioned PBlaze5 can keep pace with the Optane SSD.
 |
|||||||||
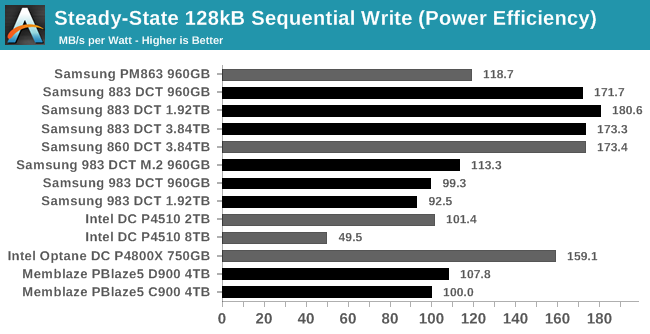
| Power Efficiency in MB/s/W | Average Power in W | ||||||||
The PBlaze5 requires over 20W to keep up with what the Optane SSD can deliver at 14W, so despite its high performance the PBlaze5's efficiency is no better than the other NVMe drives. It's the SATA drives that come out well ahead: even though this workload pushes their power consumption relatively high, Samsung's latest generation of SATA drives is still able to keep it under 3W, and that's enough for a clear efficiency win.


36 Comments
View All Comments
ZeDestructor - Friday, January 4, 2019 - link
Could you do the MemBlaze drives too? I'm really curious how those behave under consumer workloads.mode_13h - Thursday, January 3, 2019 - link
At 13 ms, the Peak 4k Random Read (Latency) chart is likely showing the overhead of a pair of context switches for 3 of those drives. I'd be surprised if that result were reproducible.Billy Tallis - Thursday, January 3, 2019 - link
Those tail latencies are the result of far more than just a pair of context switches. The problem with those three drives is that they need really high queue depths to reach full throughput. Since that test used many threads each issuing one IO at a time, tail latencies get much worse once the number of threads outnumbers the number of (virtual) cores. The 64-thread latencies are reasonable, but the 99.9th and higher percentiles are many times worse for the 96+ thread iterations of the test. (The machine has 72 virtual cores.)The only way to max out those drive's throughput while avoiding the thrashing of too many threads is to re-write an application to use fewer threads that are issuing IO requests in batches with asynchronous APIs. That's not always an easy change to make in the real world, and for benchmarking purposes it's an extra variable that I didn't really want to dig into for this review (especially given how it complicates measuring latency).
I'm comfortable with some of the results being less than ideal as a reflection of how the CPU can sometimes bottleneck the fastest SSDs. Optimizing the benchmarks to reduce CPU usage doesn't necessarily make them more realistic.
CheapSushi - Friday, January 4, 2019 - link
Hey Billy. this is a bit of a tangent but do you think SSHDs will have any kind of resurgence? There hasn't been a refresh at all. The 2.5" SSHDs max out at about 2TB I believe with 8GB of MLC(?) NAND. Now that QLC is being pushed out and with fairly good SLC schemes, do you think SSHDs could still fill a gap in price + capacity + performance? Say, at least a modest bump to 6TB of platter with 128GB of QLC/SLC-turbo NAND? Or some kind of increase along those lines? I know most folks don't care about them anymore. But there's still something appealing to me about the combination.leexgx - Friday, January 4, 2019 - link
Sshd tend to use MLC, Only ones been interesting has been the Toshiba second gen sshds as they use some of the 8gb for write caching (from some Basic tests I have seen)where as seagate only caches commonly read locations
leexgx - Friday, January 4, 2019 - link
Very annoying the page reloadingWant to test second gen Toshiba but finding the right part number as they are using creptic part numbers
CheapSushi - Friday, January 4, 2019 - link
Ah, I was not aware of the ones from Toshiba, thanks for the heads up. Write caching seems the way to go for such a setup. Did the WD SSHD's do the same as Seagates?leexgx - Friday, January 11, 2019 - link
I have obtained the Toshiba mq01, mq02 and there h200 sshd all 500gb to test to see if write caching works (limit testing to 500mb writing at start see how it goes from Therethiagotech - Friday, January 4, 2019 - link
Can someone help me understanding which scenarios is considered as QD1 and higher? Does anyone have a guide for dummies what is queue depth? Lets suppose i'll start Windows and there is 200 files of 4k, is it a QD1 or QD64? Because i was copying a folder with a large number of tiny files and my Samsung 960 Pro reached like 70MBPS of copy speed, is really bad number...Greg100 - Saturday, January 5, 2019 - link
thiagotech,About queue depth during boot up a Windows check last post: https://forums.anandtech.com/threads/qd-1-workload...
About optimization Samsung 960 Pro performance check: "The SSD Reviewers Guide to SSD Optimization 2018" on thessdreview