The Enterpise TLC Storage Era Begins: Rounding Up 13 SSDs With Samsung, Intel, and Memblaze
by Billy Tallis on January 3, 2019 9:45 AM ESTQD1 Random Read Performance
Drive throughput with a queue depth of one is usually not advertised, but almost every latency or consistency metric reported on a spec sheet is measured at QD1 and usually for 4kB transfers. When the drive only has one command to work on at a time, there's nothing to get in the way of it offering its best-case access latency. Performance at such light loads is absolutely not what most of these drives are made for, but they have to make through the easy tests before we move on to the more realistic challenges.
*The colors on the graphs have no specific meaning; just to make it easier to read from the graph based on drive family
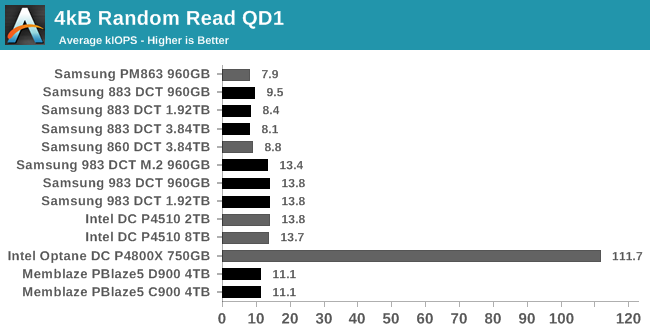
The Intel DC P4510 and Samsung 983 DCT offer identical QD1 random read performance, showing that Intel/Micron 3D NAND has caught up to Samsung after a first generation that was clearly slower (shown here by the Memblaze PBlaze5). The Samsung SATA drives are about 40% slower than their NVMe drives, and the Optane SSD is almost ten times faster than anything else.
 |
|||||||||
| Power Efficiency in kIOPS/W | Average Power in W | ||||||||
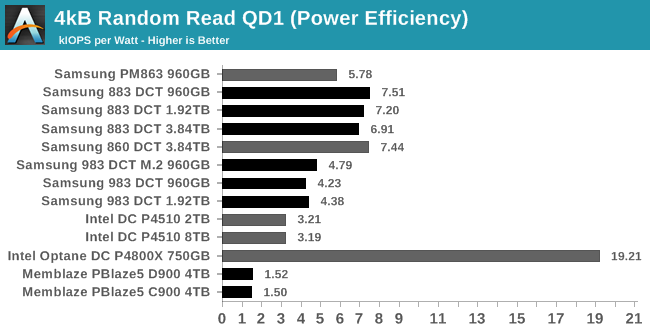
QD1 isn't pushing the drives very hard, so they're not very far above idle power draw. That means the bigger, beefier drives draw more power but have little to show for it. The SATA drives all have higher efficiency scores than the NVMe drives, except that the Optane SSD provides more than 2.5x the performance per Watt at QD1.
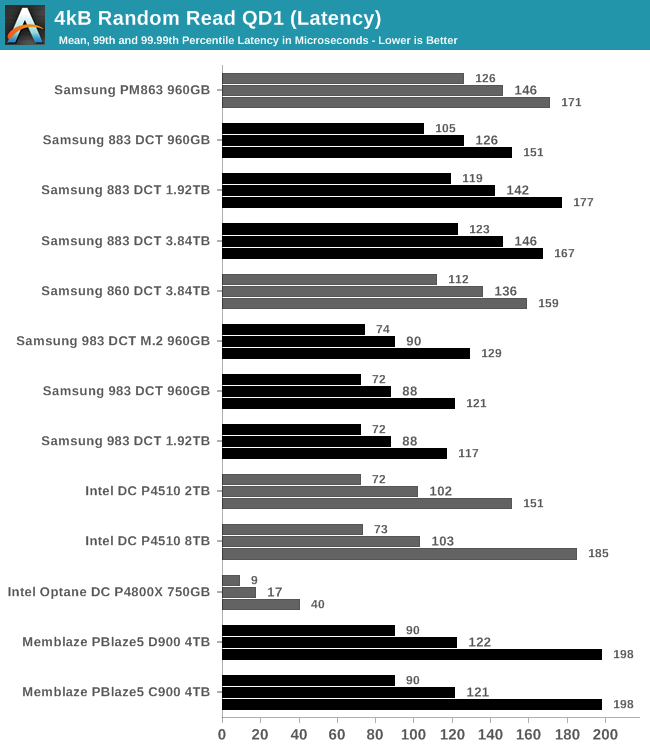
All of these drives have pretty good consistency for QD1 random reads. The 8TB P4510 has a 99.99th percentile latency that's just over 2.5 times its average, and all the other flash-based SSDs are better than that. (The PBlaze5 is a bit slower than the P4510, but consistently). The Optane SSD actually has the biggest relative disparity between average latency and 99.99th percentile, but that hardly matters with its worst-case is as good or better than the average-case performance of flash memory.
 |
|||||||||
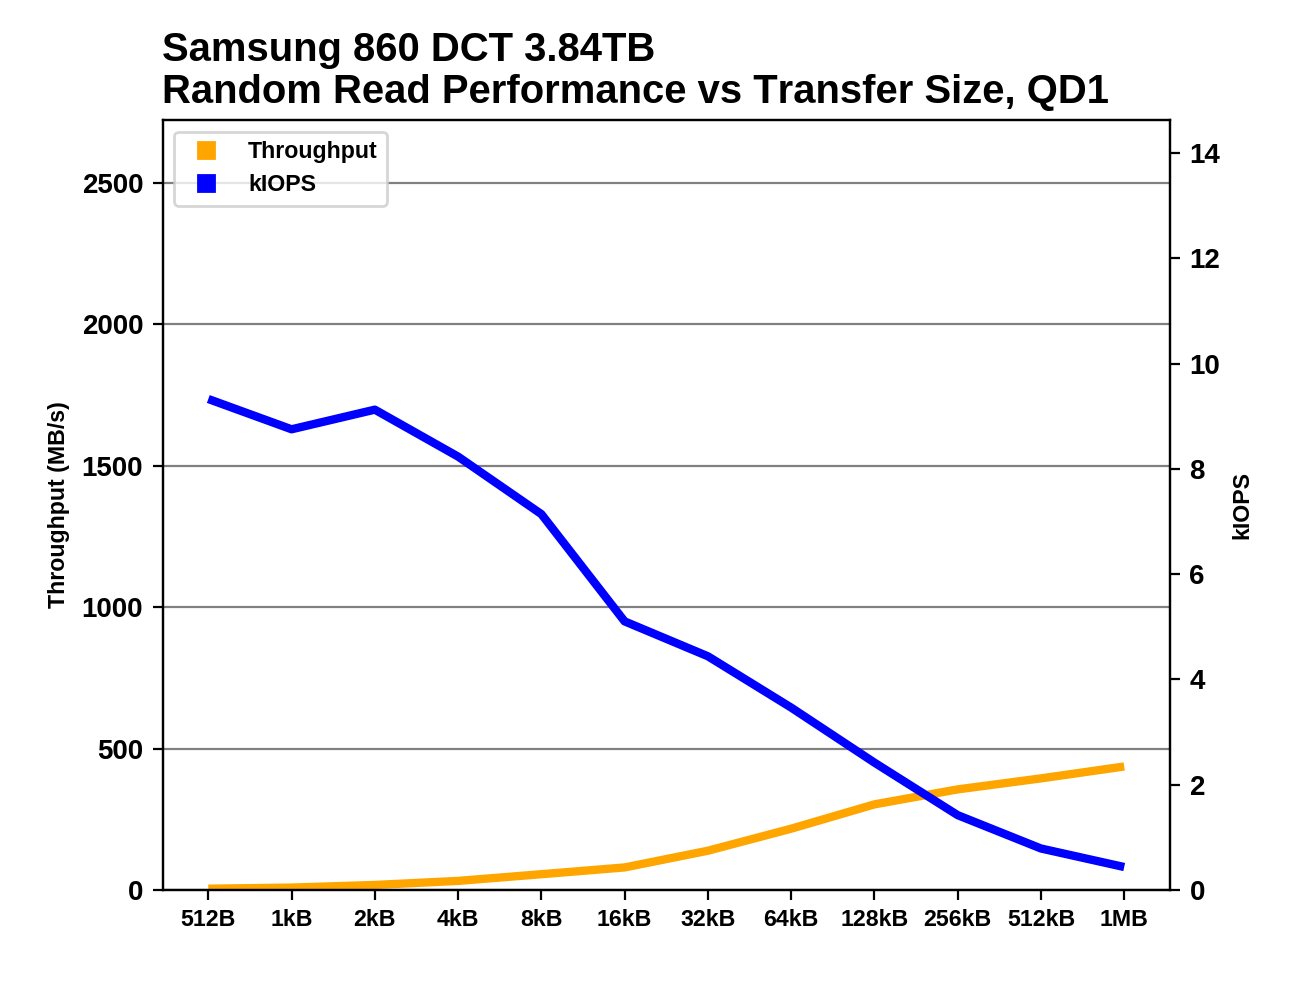
The random read performance of most of these drives is optimized for 4kB block sizes: smaller block sizes perform roughly the same in terms of IOPS, and thus get much lower throughput. Throughput stays relatively low until block sizes exceed 64kB, after which the NVMe drives all start to deliver much higher throughput. This is most pronounced for the Samsung 983 DCT.
QD1 Random Write Performance
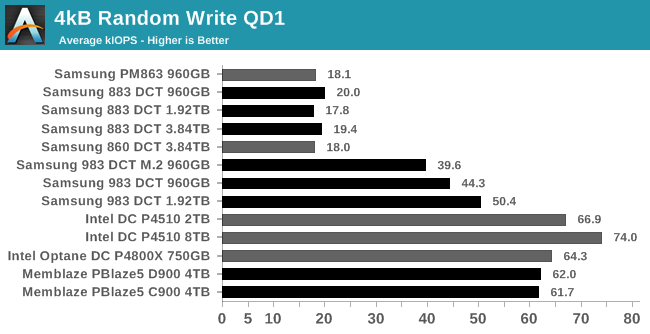
The clearest trend for 4kB random write performance at QD1 is that the NVMe drives are at least twice as fast as the SATA drives, but there's significant variation: Intel's NVMe drives have much faster QD1 random write performance than Samsung's, and the Memblaze drives are in between.
 |
|||||||||
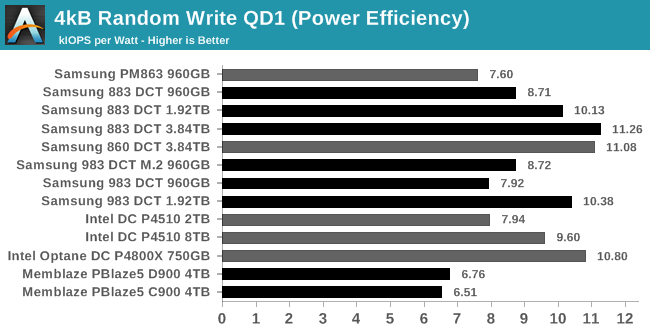
| Power Efficiency in kIOPS/W | Average Power in W | ||||||||
The SATA drives draw much less power than the NVMe drives during this random write test, so the efficiency scores end up in the same ballpark with no clear winner. The PBlaze5 is the clear loser, because its huge power-hungry controller is of no use here at low loads.
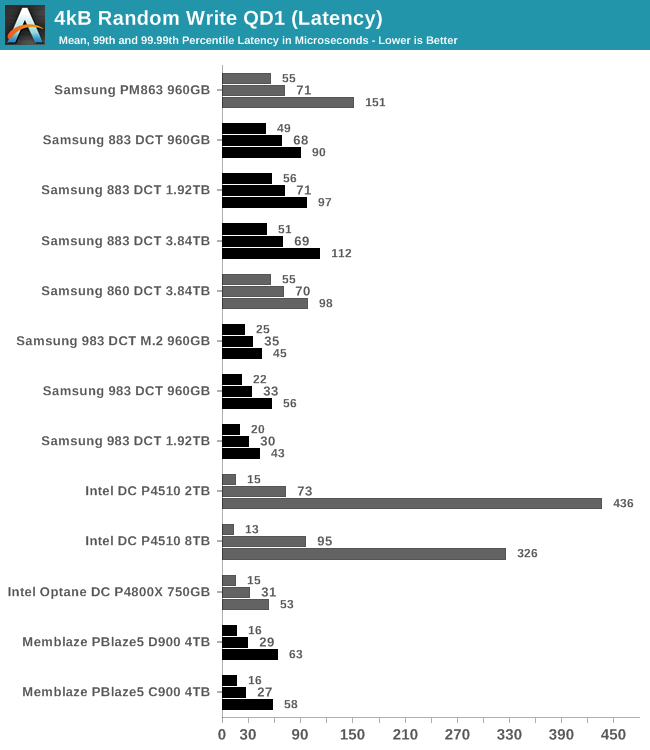
The Intel DC P4510 has some QoS issues, with 99th and 99.99th percentile random write latencies that are far higher than any of the other NVMe drives, despite the P4510 having one of the best average latency scores. Samsung's latest generation of SATA drives doesn't offer a significant improvement to average-case latency, but the tail latency has clearly improved.
 |
|||||||||
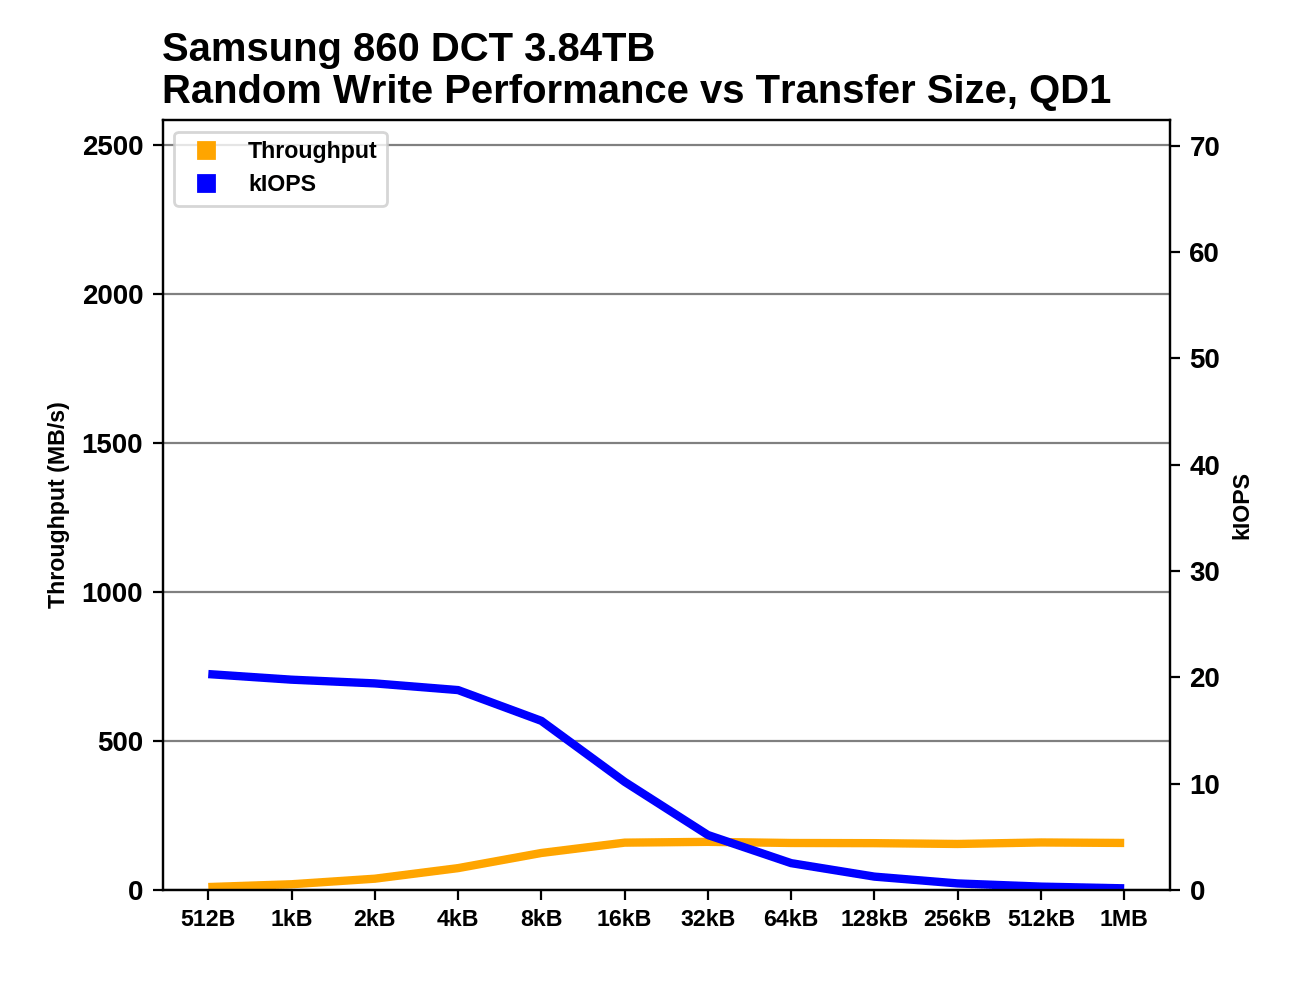
As with random reads, we find that the random write performance of these drives always provides peak IOPS when dealing with 4kB transfers. The Memblaze PBlaze5 drives do extremely poorly with writes smaller than 4kB, but the rest of the drives handle tiny writes with roughly the same IOPS as a 4kB write. 8kB and larger random writes always yield fewer IOPS but usually significantly higher overall throughput.
QD1 Sequential Read Performance
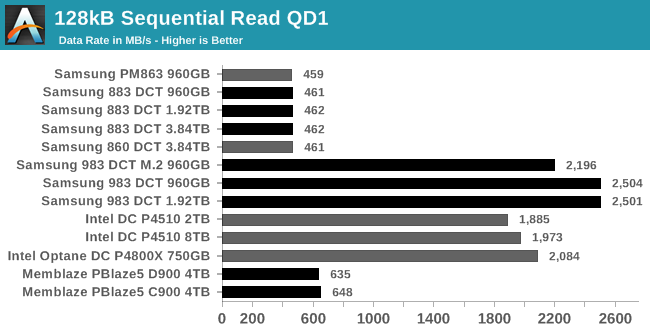
At QD1, the SATA drives aren't quite saturating the host interface, but mainly because of the link idle time between the drive finishing one transfer and receiving the command to start the next. The PBlaze5 SSDs are only a bit faster than the SATA drives at QD1 despite the C900 being the drive with the most host bandwidth; reminding us how the first-generation IMFT 3D TLC could be quite slow at times. The Intel drives are a bit slower than the Samsung drives, coming in at or below 2GB/s while the 983 DCT U.2 hits 2.5GB and the M.2 is around 2.2GB/s.
 |
|||||||||
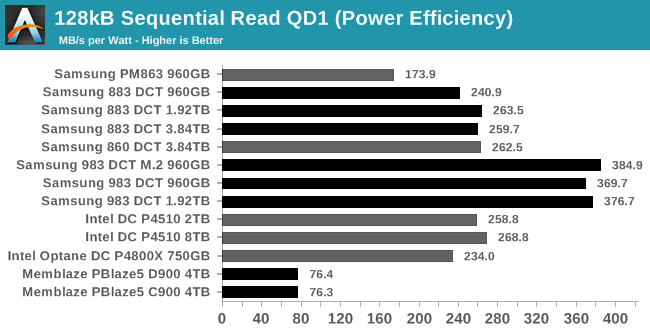
| Power Efficiency in MB/s/W | Average Power in W | ||||||||
The latest Samsung SATA drives are comparable in efficiency to Intel's NVMe, while Samsung's own NVMe SSD is substantially more efficient. The Memblaze PBlaze5 is by far the least efficient, since it offers disappointing QD1 sequential read performance while drawing more power than all the other flash-based SSDs.
 |
|||||||||
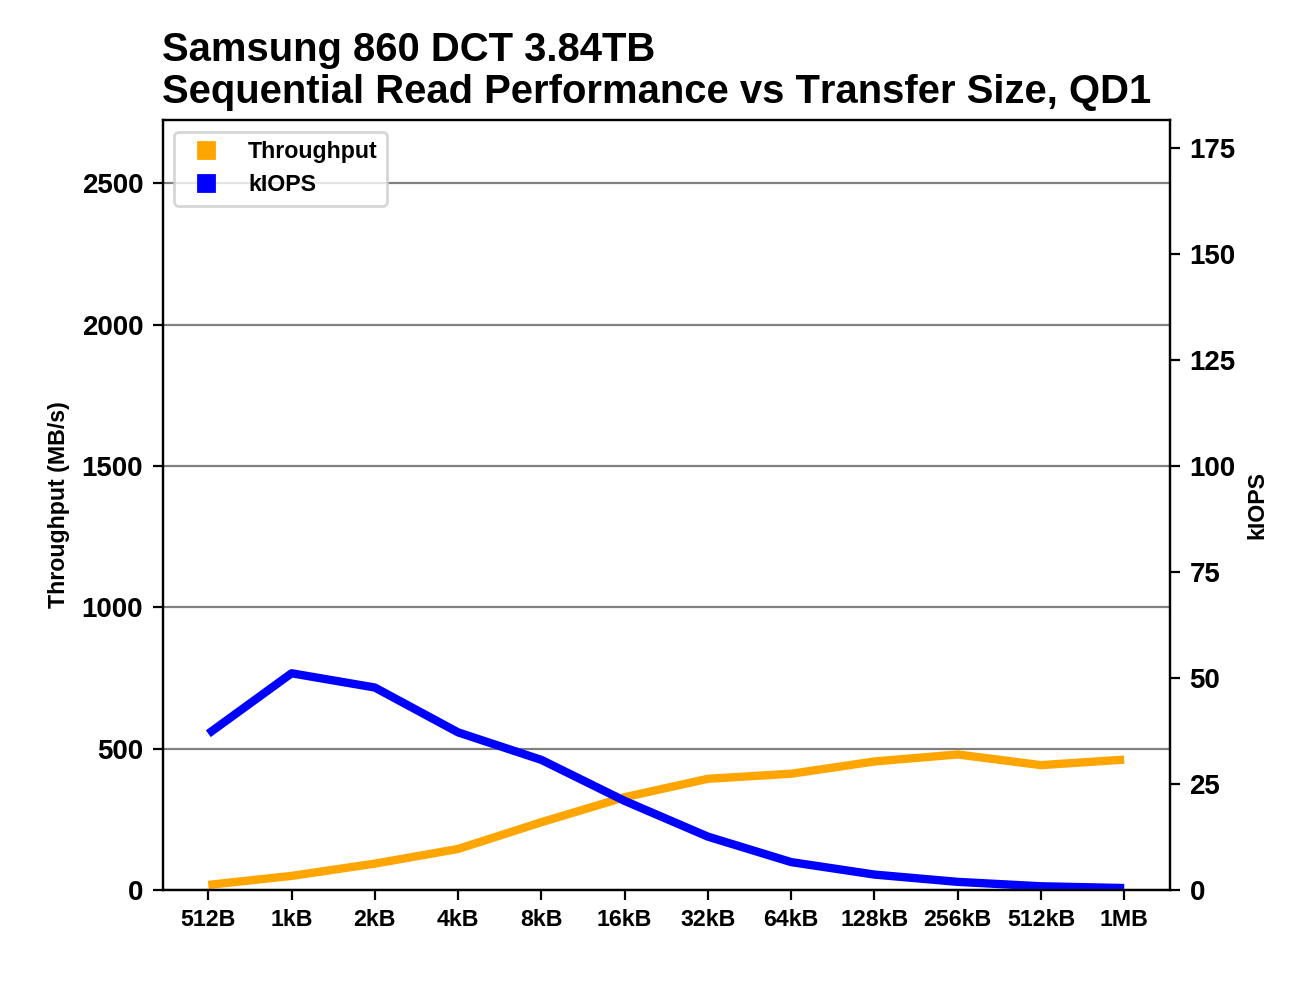
The Memblaze PBlaze5 doesn't seem to be any good at prefetching or caching when performing sequential reads: its throughput is very low for small to medium block sizes, and even at 128kB it is much slower than with 1MB transfers. The rest of the drives generally provide full sequential read throughput for transfer sizes starting around 64kB or 128kB.
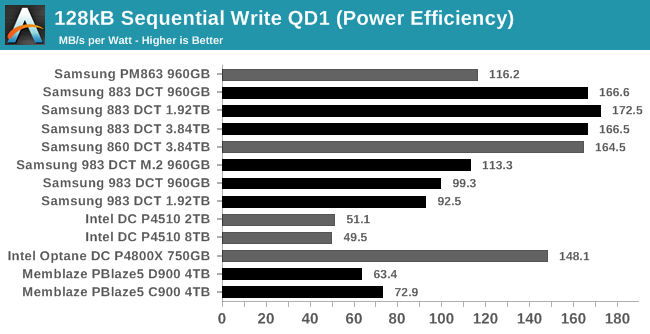
QD1 Sequential Write Performance
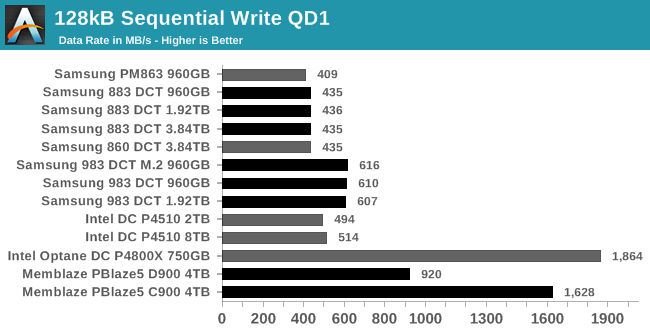
At QD1, the Intel P4510 and Samsung 983 DCT are only slightly faster at sequential writes than the SATA drives. The Optane SSD and the Memblaze PBlaze5 C900 both perform very well, while the PBlaze5 D900 can't quite hit 1GB/s at QD1.
 |
|||||||||
| Power Efficiency in MB/s/W | Average Power in W | ||||||||
Once again the SATA drives dominate the power efficiency rankings; Samsung's current-generation SATA drives draw less than half the power of the most efficient flash-based NVMe drive. The older Samsung PM863 shows that Samsung's SATA drives have improved significantly even though the performance is barely changed from earlier generations. Among NVMe drives, power consumption scales roughly as expected, with the Memblaze PBlaze5 C900 drawing over 22W to deliver 1.6GB/s sustained writes.
 |
|||||||||
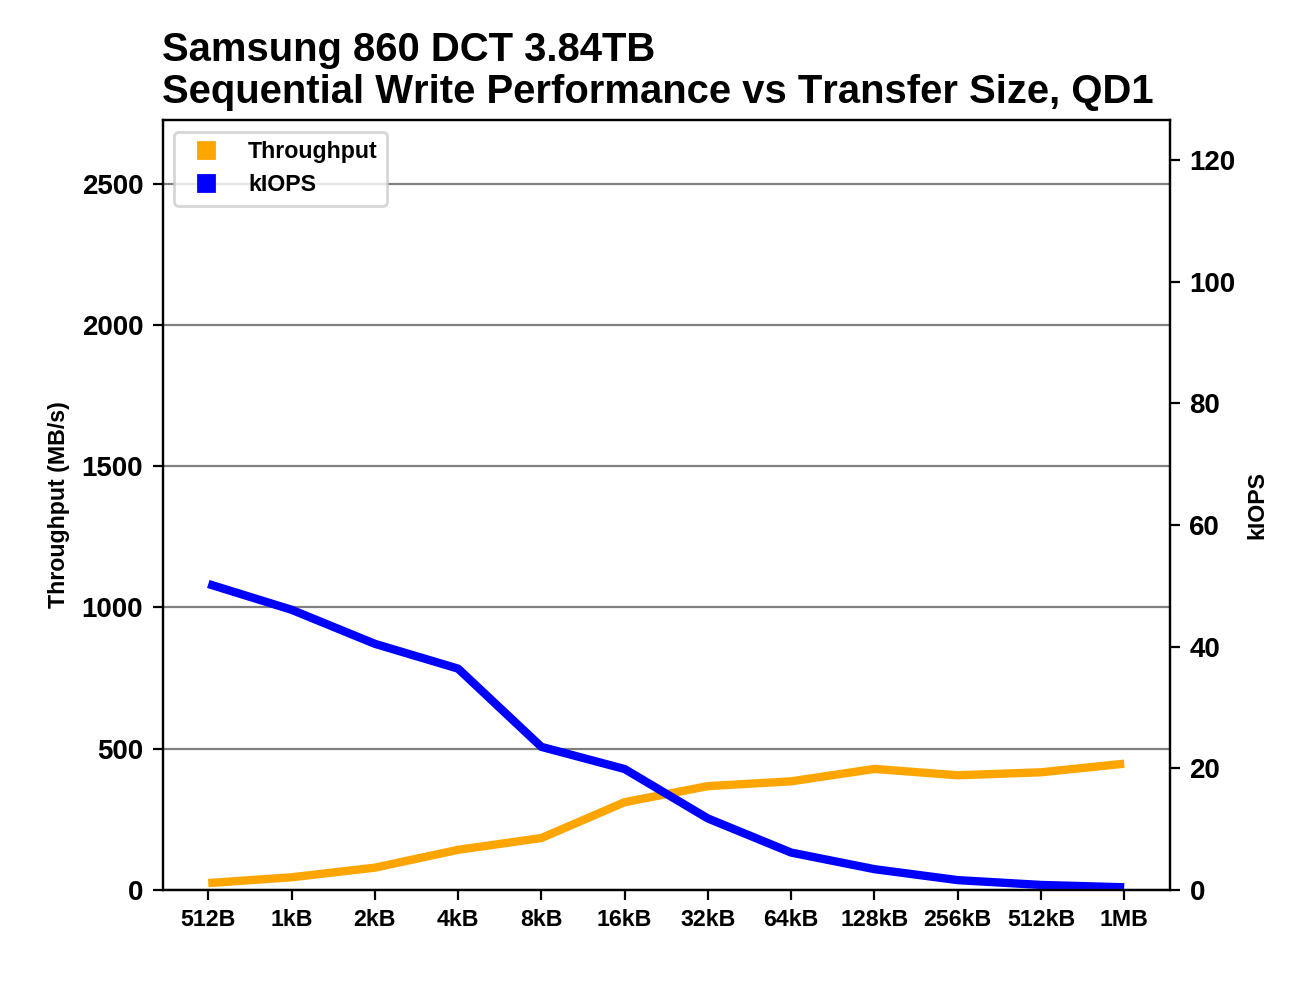
As with random writes, for sequential writes the Memblaze PBlaze5 doesn't like being handed writes of less than 4kB, and neither does the Intel Optane P4800X. The rest of the drives generally hit their steady-state sequential write speed starting with transfer sizes in the 8kB to 32kB range.


36 Comments
View All Comments
ZeDestructor - Friday, January 4, 2019 - link
Could you do the MemBlaze drives too? I'm really curious how those behave under consumer workloads.mode_13h - Thursday, January 3, 2019 - link
At 13 ms, the Peak 4k Random Read (Latency) chart is likely showing the overhead of a pair of context switches for 3 of those drives. I'd be surprised if that result were reproducible.Billy Tallis - Thursday, January 3, 2019 - link
Those tail latencies are the result of far more than just a pair of context switches. The problem with those three drives is that they need really high queue depths to reach full throughput. Since that test used many threads each issuing one IO at a time, tail latencies get much worse once the number of threads outnumbers the number of (virtual) cores. The 64-thread latencies are reasonable, but the 99.9th and higher percentiles are many times worse for the 96+ thread iterations of the test. (The machine has 72 virtual cores.)The only way to max out those drive's throughput while avoiding the thrashing of too many threads is to re-write an application to use fewer threads that are issuing IO requests in batches with asynchronous APIs. That's not always an easy change to make in the real world, and for benchmarking purposes it's an extra variable that I didn't really want to dig into for this review (especially given how it complicates measuring latency).
I'm comfortable with some of the results being less than ideal as a reflection of how the CPU can sometimes bottleneck the fastest SSDs. Optimizing the benchmarks to reduce CPU usage doesn't necessarily make them more realistic.
CheapSushi - Friday, January 4, 2019 - link
Hey Billy. this is a bit of a tangent but do you think SSHDs will have any kind of resurgence? There hasn't been a refresh at all. The 2.5" SSHDs max out at about 2TB I believe with 8GB of MLC(?) NAND. Now that QLC is being pushed out and with fairly good SLC schemes, do you think SSHDs could still fill a gap in price + capacity + performance? Say, at least a modest bump to 6TB of platter with 128GB of QLC/SLC-turbo NAND? Or some kind of increase along those lines? I know most folks don't care about them anymore. But there's still something appealing to me about the combination.leexgx - Friday, January 4, 2019 - link
Sshd tend to use MLC, Only ones been interesting has been the Toshiba second gen sshds as they use some of the 8gb for write caching (from some Basic tests I have seen)where as seagate only caches commonly read locations
leexgx - Friday, January 4, 2019 - link
Very annoying the page reloadingWant to test second gen Toshiba but finding the right part number as they are using creptic part numbers
CheapSushi - Friday, January 4, 2019 - link
Ah, I was not aware of the ones from Toshiba, thanks for the heads up. Write caching seems the way to go for such a setup. Did the WD SSHD's do the same as Seagates?leexgx - Friday, January 11, 2019 - link
I have obtained the Toshiba mq01, mq02 and there h200 sshd all 500gb to test to see if write caching works (limit testing to 500mb writing at start see how it goes from Therethiagotech - Friday, January 4, 2019 - link
Can someone help me understanding which scenarios is considered as QD1 and higher? Does anyone have a guide for dummies what is queue depth? Lets suppose i'll start Windows and there is 200 files of 4k, is it a QD1 or QD64? Because i was copying a folder with a large number of tiny files and my Samsung 960 Pro reached like 70MBPS of copy speed, is really bad number...Greg100 - Saturday, January 5, 2019 - link
thiagotech,About queue depth during boot up a Windows check last post: https://forums.anandtech.com/threads/qd-1-workload...
About optimization Samsung 960 Pro performance check: "The SSD Reviewers Guide to SSD Optimization 2018" on thessdreview