The $60 CPU Question: AMD Athlon 200GE or Intel Pentium Gold G5400? A Review
by Ian Cutress on January 14, 2019 8:00 AM ESTCPU Performance: Office Tests
The Office test suite is designed to focus around more industry standard tests that focus on office workflows, system meetings, some synthetics, but we also bundle compiler performance in with this section. For users that have to evaluate hardware in general, these are usually the benchmarks that most consider.
All of our benchmark results can also be found in our benchmark engine, Bench.
PCMark 10: Industry Standard System Profiler
Futuremark, now known as UL, has developed benchmarks that have become industry standards for around two decades. The latest complete system test suite is PCMark 10, upgrading over PCMark 8 with updated tests and more OpenCL invested into use cases such as video streaming.
PCMark splits its scores into about 14 different areas, including application startup, web, spreadsheets, photo editing, rendering, video conferencing, and physics. We post all of these numbers in our benchmark database, Bench, however the key metric for the review is the overall score.
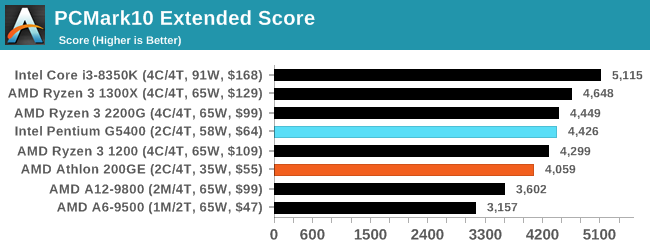
As an all-around test, one hopes that PCMark should be able to shine a light into this analysis. The end result is that PCMark says Intel should be ahead by around 8%.
Chromium Compile: Windows VC++ Compile of Chrome 56
A large number of AnandTech readers are software engineers, looking at how the hardware they use performs. While compiling a Linux kernel is ‘standard’ for the reviewers who often compile, our test is a little more varied – we are using the windows instructions to compile Chrome, specifically a Chrome 56 build from March 2017, as that was when we built the test. Google quite handily gives instructions on how to compile with Windows, along with a 400k file download for the repo.
In our test, using Google’s instructions, we use the MSVC compiler and ninja developer tools to manage the compile. As you may expect, the benchmark is variably threaded, with a mix of DRAM requirements that benefit from faster caches. Data procured in our test is the time taken for the compile, which we convert into compiles per day.
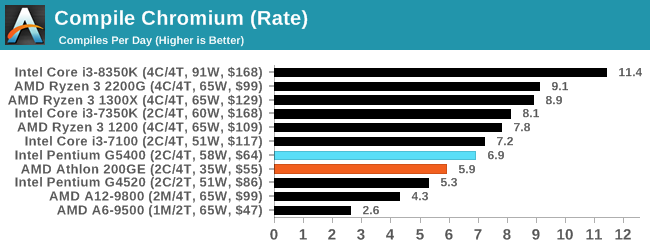
I like this Chromium test, given that it probes a lot of areas within a system. The Intel G5400 wins here again, scoring 6.9 compiles per day, compared to 5.9 for the AMD 200GE.
3DMark Physics: In-Game Physics Compute
Alongside PCMark is 3DMark, Futuremark’s (UL’s) gaming test suite. Each gaming tests consists of one or two GPU heavy scenes, along with a physics test that is indicative of when the test was written and the platform it is aimed at. The main overriding tests, in order of complexity, are Ice Storm, Cloud Gate, Sky Diver, Fire Strike, and Time Spy.
Some of the subtests offer variants, such as Ice Storm Unlimited, which is aimed at mobile platforms with an off-screen rendering, or Fire Strike Ultra which is aimed at high-end 4K systems with lots of the added features turned on. Time Spy also currently has an AVX-512 mode (which we may be using in the future).
For our tests, we report in Bench the results from every physics test, but for the sake of the review we keep it to the most demanding of each scene: Cloud Gate, Sky Diver, Fire Strike Ultra, and Time Spy.
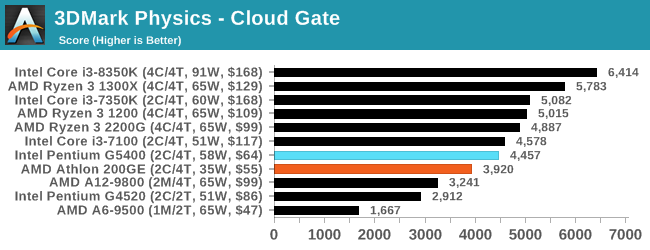
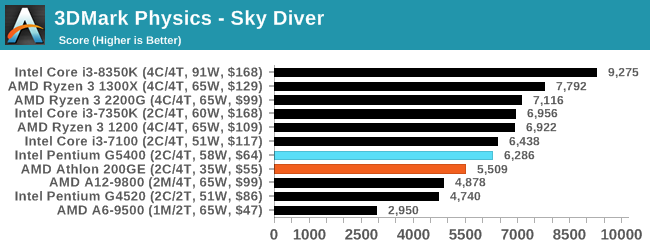
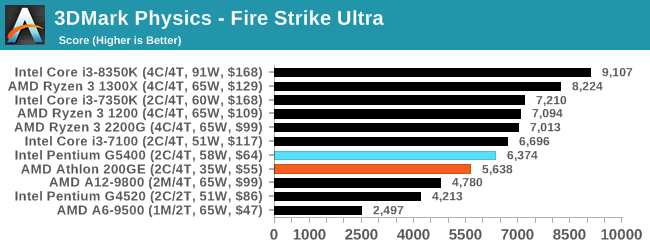
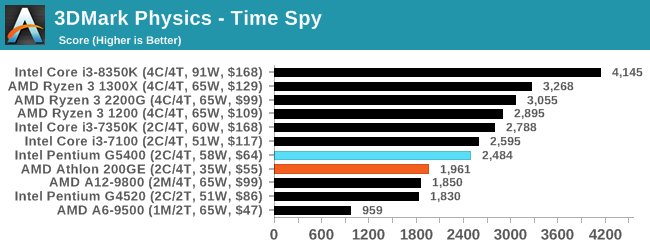
In all the tests except Time Spy, Intel takes an 11-12% lead over AMD, while in Time Spy that increases to 20%.
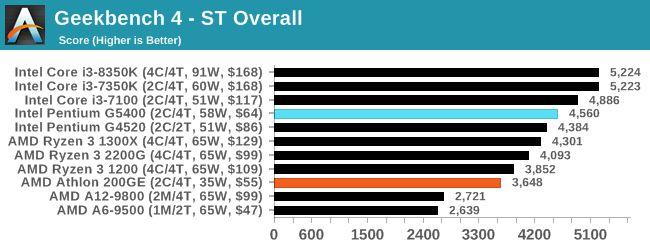
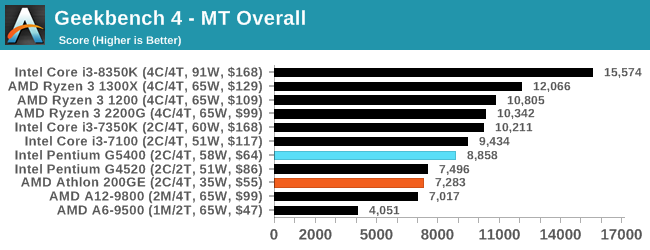
GeekBench4: Synthetics
A common tool for cross-platform testing between mobile, PC, and Mac, GeekBench 4 is an ultimate exercise in synthetic testing across a range of algorithms looking for peak throughput. Tests include encryption, compression, fast Fourier transform, memory operations, n-body physics, matrix operations, histogram manipulation, and HTML parsing.
I’m including this test due to popular demand, although the results do come across as overly synthetic, and a lot of users often put a lot of weight behind the test due to the fact that it is compiled across different platforms (although with different compilers).
We record the main subtest scores (Crypto, Integer, Floating Point, Memory) in our benchmark database, but for the review we post the overall single and multi-threaded results.


95 Comments
View All Comments
kkilobyte - Monday, January 14, 2019 - link
s/i3/Pentium. Obviously :)freedom4556 - Monday, January 14, 2019 - link
I think you messed up your charts for Civ 6's IGP testing. That or why are you testing the IGP at 1080p Ultra when all the other IGP tests are at 720p Low?freedom4556 - Monday, January 14, 2019 - link
Also, the 8k and 16k tests are pointless wastes of time. Especially in this review, but also in the others. Your low/med/high/ultra should be 720p/1080p/1440p/4k if you want to actually represent the displays people are purchasing.nevcairiel - Monday, January 14, 2019 - link
The Civ6 tests are like that because thats when it really starts to scale like the other games. Look at its IGP vs Low, which is 1080p vs 4K. The values are almost identical (and still pretty solid). Only if you move to 8K and then 16K you see the usual performance degredation you would see with other games.AnnoyedGrunt - Tuesday, January 15, 2019 - link
I second this motion. Please have settings to cover the various common monitor choices. 1080P is an obvious choice, but 1440P should be there too, along with 4K. I don't think you need to run two 4K versions, or two 1080P versions, or whatever. I have a 1440P monitor so it would be nice to see where I become GPU limited as opposed to CPU limited. Maybe Civ6 could use some extra high resolutions in the name of science, but to be useful, you should at least include the 1440P on all games.Thanks.
-AG
eddieobscurant - Monday, January 14, 2019 - link
Another pro intel article from Ian, who hopes that someday intel will hire himPeachNCream - Monday, January 14, 2019 - link
The numbers in the chart speak for themselves. You don't have to acknowledge the conclusion text. It's only a recommendation anyway. Even though I'd personally purchase a 200GE if I were in the market, I don't think there is any sort of individual bias coming into play. Where the 200GE is relevant, gaming on the IGP, Ian recommended it. In other cases the G5400 did come out ahead by enough of a margin to make it worth consideration. The only flaw I could tease out of this is the fact that the recommendation is based on MSRP and as others have noted, the G5400 is significantly above MSRP right now. It may have been good to acknowledge that in the intro and conclusion in a stronger manner, but that means the article may not stand up as well to the test of time for someone browsing this content six months later after searching for advice on the relevant CPUs via Google.kkilobyte - Monday, January 14, 2019 - link
Acknowledge "in a stronger manner"? Well, it is actually not acknowledged in the conclusion at all!The title of the article is: "The $60 CPU question". One of those CPU is clearly not being sold at $60 on average, but is priced significantly higher. I think the article should have compared CPUs that are really available at (around) $60.
So maybe there is no personal bias - but there is clearly ignorance of the market state. And that's surprizing, since the G5400 price was above its MSRP for several months already; how could a professional journalist in the field ignore that?
I guess it could be objected that "MSRP always was used in the past as the reference price". Granted - but it made sense while the MSRP was close to the real market price. It doesn't anymore once the gap gets big, which is the case for tbe G5400. Nobody gives a damn about the theorical price if it is applied nowhere on the market.
And the 'numbers of chart' don't 'speak for themselves' - they are basically comparing CPUs whose retail price, depending on where you get them, show a 20-40% price gap. What's the point? Why isn't there a price/performance graph, as there were in past reviews? The graphs could just as well include high-end CPUs, and would be just as useless.
If I want to invest ~$60 in a CPU, I'm not interested to know how a ~$90 one performs!
sonny73n - Tuesday, January 15, 2019 - link
+1I couldn’t have said it better myself.
cheshirster - Wednesday, January 23, 2019 - link
Yes, 5400 is priced nowhere near 60$ and reviewer definitely knows it, but fails to mention this in conclusion.