The Mushkin Source 500GB SATA SSD Review: A Value Proposition For An Everyday PC
by Billy Tallis on November 21, 2018 10:00 AM ESTWorking Set Size
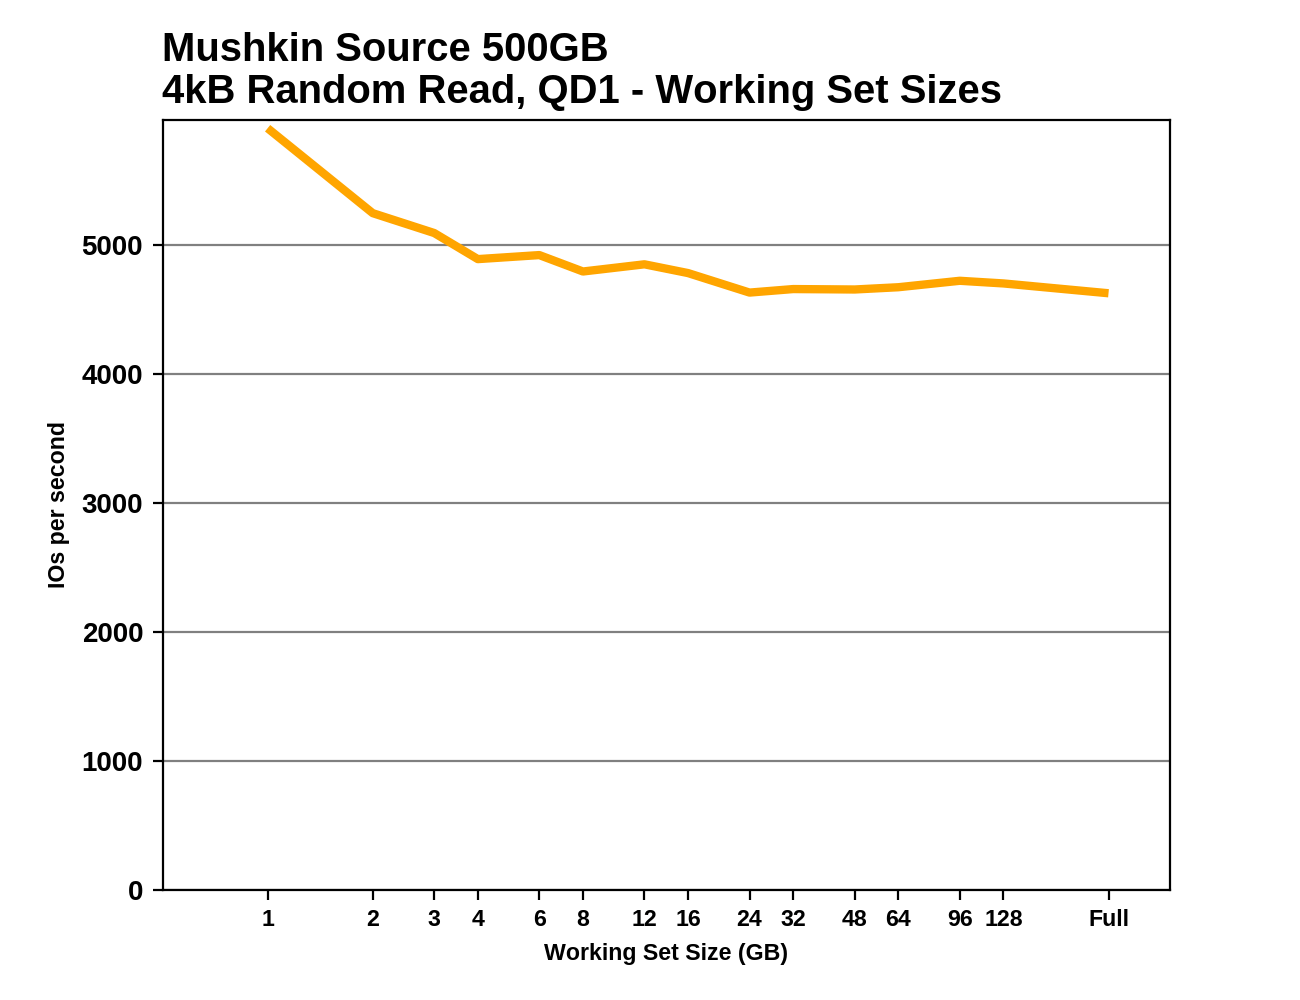
DRAMless SSDs may still have a bit of SRAM on the SSD controller to cache a portion of the flash translation layer's mapping tables. Just like a GB of external DRAM can hold the mapping tables for a TB of flash, a few MB of onboard RAM in the controller can hold the mappings for a few GB of flash. We can probe for such a cache by performing random reads with a varying working set size.
 |
|||||||||
The Mushkin Source shows some decline in random read performance as the working set size grows beyond just a few GB, but there's no sharp drop in performance like we see with DRAMless NVMe drives that are using the Host Memory Buffer feature. Most of the other drives show roughly the same random read performance regardless of working set size.
Whole-Drive Fill
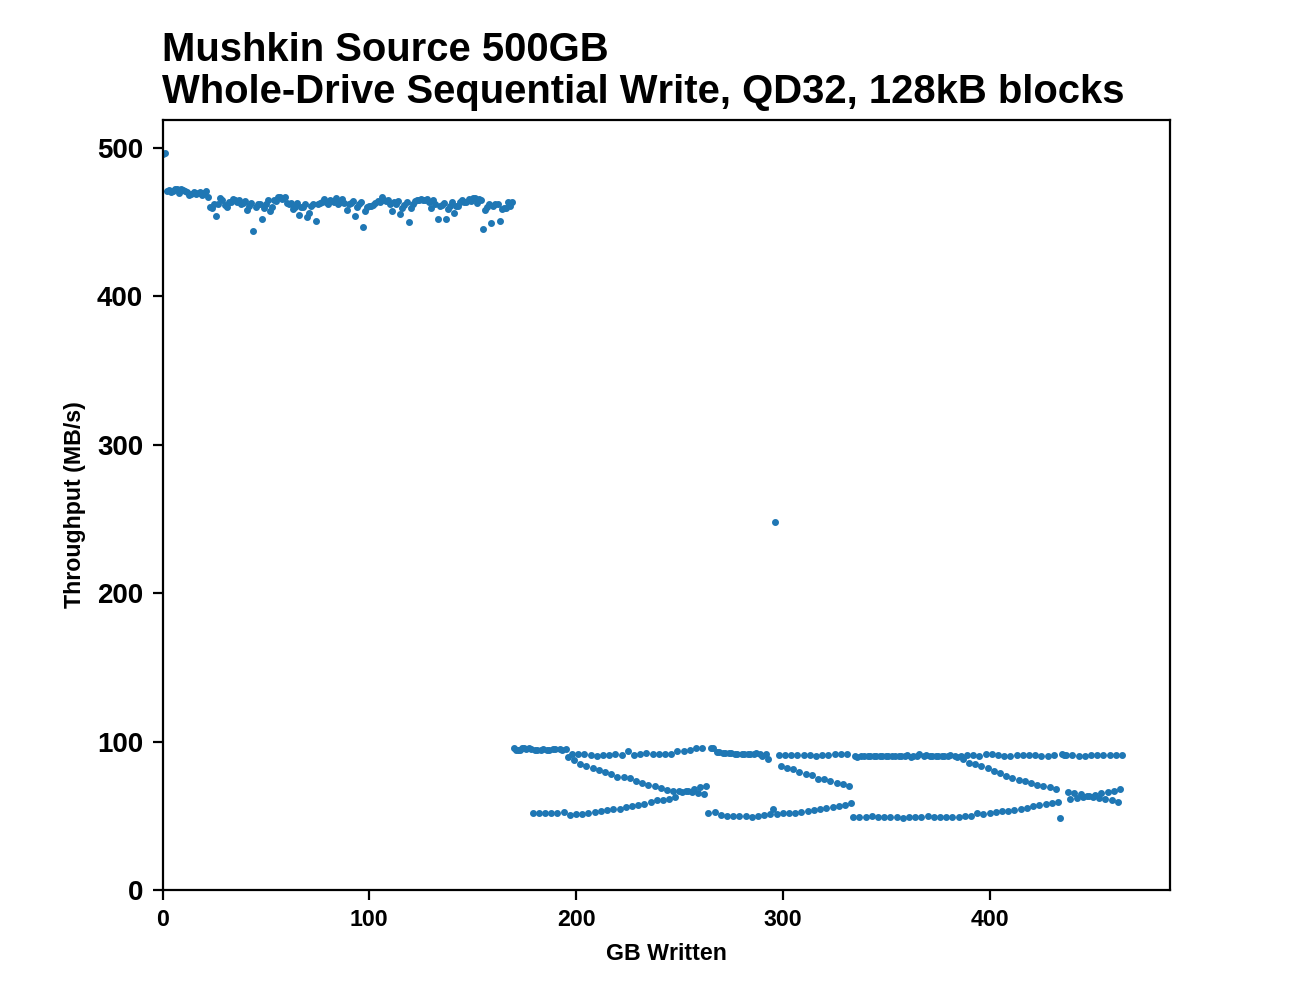
This test starts with a freshly-erased drive and fills it with 128kB sequential writes at queue depth 32, recording the write speed for each 1GB segment. This test is not representative of any ordinary client/consumer usage pattern, but it does allow us to observe transitions in the drive's behavior as it fills up. This can allow us to estimate the size of any SLC write cache, and get a sense for how much performance remains on the rare occasions where real-world usage keeps writing data after filling the cache.
 |
|||||||||
The Mushkin Source lasts a very long time before its SLC cache is filled. While the Toshiba TR200's write speed ends up in the gutter very quickly, it will be almost impossible for a real-world consumer workload to fill the cache of the Source unless the drive starts out nearly full. From an empty drive, the apparent initial SLC cache size is well over 150GB—essentially the entire drive operating as SLC until free space runs out.
 |
|||||||||
| Average Throughput for last 16 GB | Overall Average Throughput | ||||||||
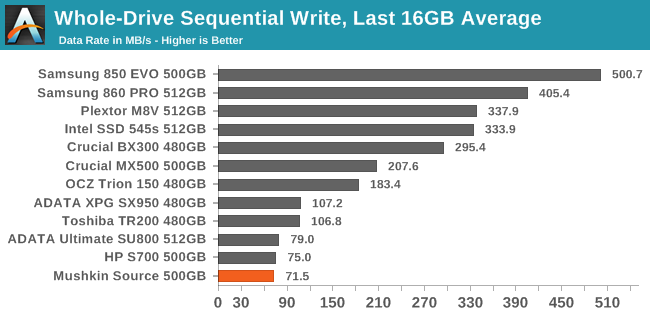
In the unlikely event that the SLC write cache on the Mushkin Source should overflow, its sequential write speed drops to the slowest in its class at just over 70 MB/s—slower than most mechanical hard drives. But this is only relevant when writing tens of GB at once.
BAPCo SYSmark 2018
BAPCo's SYSmark 2018 is an application-based benchmark that uses real-world applications to replay usage patterns of business users, with subscores for productivity, creativity and responsiveness. Scores represnt overall system performance and are calibrated against a reference system that is defined to score 1000 in each of the scenarios. A score of, say, 2000, would imply that the system under test is twice as fast as the reference system.
SYSmark scores are based on total application response time as seen by the user, including not only storage latency but time spent by the processor. This means there's a limit to how much a storage improvement could possibly increase scores, because the SSD is only in use for a small fraction of the total test duration. This is a significant difference from our ATSB tests where only the storage portion of the workload is replicated and disk idle times are cut short to a maximum of 25ms.
| AnandTech SYSmark SSD Testbed | |
| CPU | Intel Core i5-7400 |
| Motherboard | ASUS PRIME Z270-A |
| Chipset | Intel Z270 |
| Memory | 2x 8GB Corsair Vengeance DDR4-2400 CL17 |
| Case | In Win C583 |
| Power Supply | Cooler Master G550M |
| OS | Windows 10 64-bit, version 1803 |
Our SSD testing with SYSmark uses a different test system than the rest of our SSD tests. This machine is set up to measure total system power consumption rather than just the drive's power.
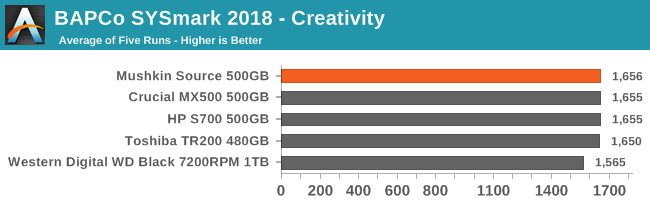
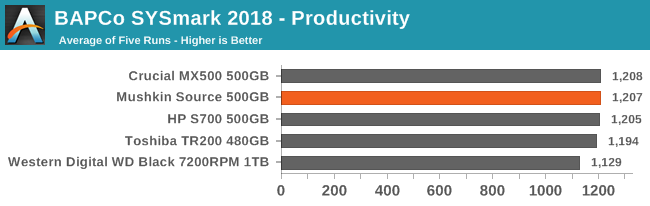
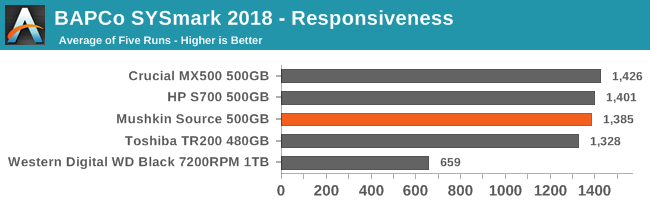
For the Creativity and Productivity subtests, the Mushkin Source and other DRAMless SSDs offer performance indistinguishable from a mainstream SATA SSD with a DRAM cache; these scenarios are more bottlenecked by CPU power and system RAM. The responsiveness test does reveal some of the reduced performance of DRAMless SSDs, but even so they greatly outperform a mechanical hard drive.
Energy Use
The SYSmark energy use scores measure total system power consumption, excluding the display. Our SYSmark test system idles at around 26 W and peaks at over 60 W measured at the wall during the benchmark run. SATA SSDs seldom exceed 5 W and idle at a fraction of a watt, and the SSDs spend most of the test idle. This means the energy usage scores will inevitably be very close. A typical notebook system will tend to be better optimized for power efficiency than this desktop system, so the SSD would account for a much larger portion of the total and the score difference between SSDs would be more noticeable.
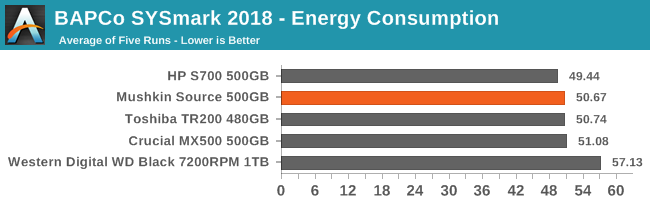
The DRAMless SSDs use a bit less energy during a SYSmark run than the mainstream Crucial MX500, but the HP S700 is the only one that really stands out as saving a non-trivial amount of power, and even in that case the difference is small enough to only matter for low-power notebooks, not our desktop testbed.


30 Comments
View All Comments
Adramtech - Thursday, November 22, 2018 - link
what are you referring to? This uses Micron and it's TLCgglaw - Saturday, November 24, 2018 - link
lol yea, are people not even reading these articles? It is using one of the best selling controllers with a great track record for a low cost one, with Micron's 64L 3D-NAND which also speaks for itself. There is nothing "risky" with this drive. Every aspect of it is very well known.Lolimaster - Thursday, November 22, 2018 - link
Till now you can still get the Samsung 860 EVO for $130.Darcey R. Epperly - Friday, November 23, 2018 - link
Good drive to speed up my Gaming Console. I don't need a high write performance.Samus - Friday, November 23, 2018 - link
Always nice to see competition, but still hard to consider this over an MX500 that sells for virtually the same price.nwarawa - Friday, November 23, 2018 - link
70MB/s seq write?! REALLY?! Makes it garbage as an upgrade. This SSD would be the bottleneck transferring from a HDD... smh.Billy Tallis - Friday, November 23, 2018 - link
Yes, but how often do you really transfer more than 150GB at a time? Even putting a full OS+apps image onto the drive probably wouldn't do that much writing in one shot. If you're only writing tens of GB at a time, this drive is still twice as fast as a hard drive.nwarawa - Friday, November 23, 2018 - link
Personally? Often. I move video folders between drives often as the projects go to cold storage. Laughable that this would be slower than my 4tb HDD at this task. But I upgrade people from HDD storage, or even smaller SSD, ALL THE TIME. MX500 or 860 EVO will image an existing 250GB so much faster.gglaw - Saturday, November 24, 2018 - link
To be fair that's a TINY niche scenario no budget drive is trying to fill. Having a performance drop after >150GB of data is transferred is something most users will encounter a couple times a year at most. Even if they are doing a full drive migration, as Billy pointed it, for most users it won't past the threshold and this is the one and only time a typical user MIGHT encounter the problem. If it adds 5 minutes to the clone time for the handful of GB after 150GB is cloned, that's the least of most users problems.The current prices make no sense either way though. It is way too close to the MX500, but the prices will have to settle into sensible patterns or these will just rot away in warehouses. I imagine the actual sell prices will end up significantly lower than MSRP. For any of my spare home rigs or office computers, the limitations of performance drop after 150GB would not bother me one bit as long as it saved enough cost to justify it. I would gladly take even a steep dropoff at 50GB if it saved several more bucks. The times I would be transferring more than this I would either A) be using my main computer or B) not sitting there waiting on the transfer/clone. I build or upgrade enough systems that anytime a workload even passes the 5 min mark, there's something else I could be working on (or sneaking in another OW match).
dromoxen - Sunday, December 9, 2018 - link
the price paid in the retail market , specifically Western Markets, is not indicative of the price OEM's pay or say LA/Far Eatern markets .I am noticing a bias against Chinese Brands simply based on their Chinesity?, is this how we stop them taking over the PC components world? HUAWEI e.g.