The Mushkin Source 500GB SATA SSD Review: A Value Proposition For An Everyday PC
by Billy Tallis on November 21, 2018 10:00 AM ESTRandom Read Performance
Our first test of random read performance uses very short bursts of operations issued one at a time with no queuing. The drives are given enough idle time between bursts to yield an overall duty cycle of 20%, so thermal throttling is impossible. Each burst consists of a total of 32MB of 4kB random reads, from a 16GB span of the disk. The total data read is 1GB.
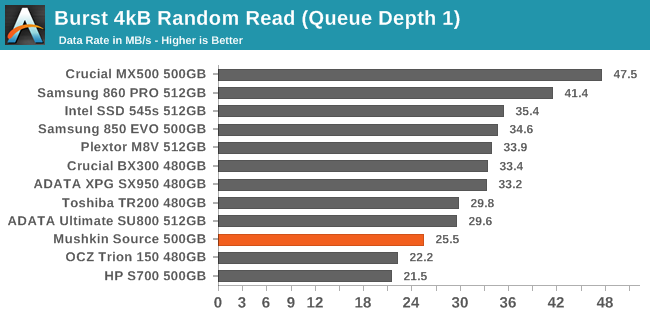
The burst random read performance from the Mushkin Source is low, as expected from a DRAMless SSD. The Crucial MX500 manages almost twice the performance with the same NAND flash. Compared to other DRAMless SSDs, the Toshiba TR200 has the clear lead over the Mushkin Source, but the Source is an improvement over the HP S700's older 32L TLC.
Our sustained random read performance is similar to the random read test from our 2015 test suite: queue depths from 1 to 32 are tested, and the average performance and power efficiency across QD1, QD2 and QD4 are reported as the primary scores. Each queue depth is tested for one minute or 32GB of data transferred, whichever is shorter. After each queue depth is tested, the drive is given up to one minute to cool off so that the higher queue depths are unlikely to be affected by accumulated heat build-up. The individual read operations are again 4kB, and cover a 64GB span of the drive.
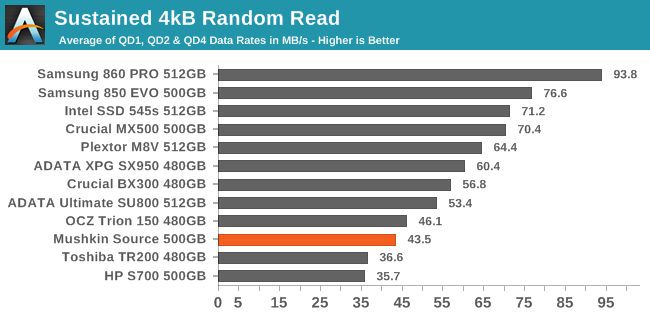
On the longer random read test that brings in some slightly higher queue depths, the Mushkin Source pulls ahead of the other DRAMless SSDs but is still unable to match the mainstream SATA SSDs with full-size DRAM caches.
 |
|||||||||
| Power Efficiency in MB/s/W | Average Power in W | ||||||||
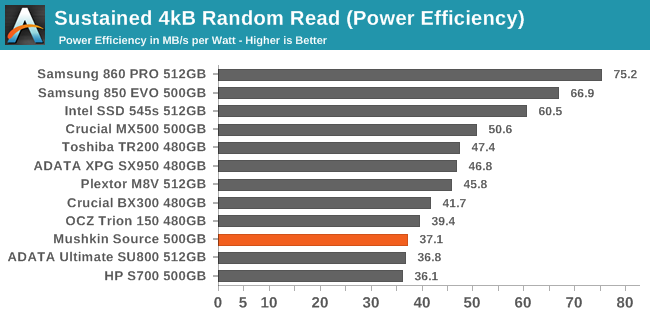
The Mushkin Source uses substantially more power during the random read test than the other two DRAMless SSDs, so it has one of the lowest efficiency scores while the Toshiba TR200 manages a slightly above-average score.
 |
|||||||||
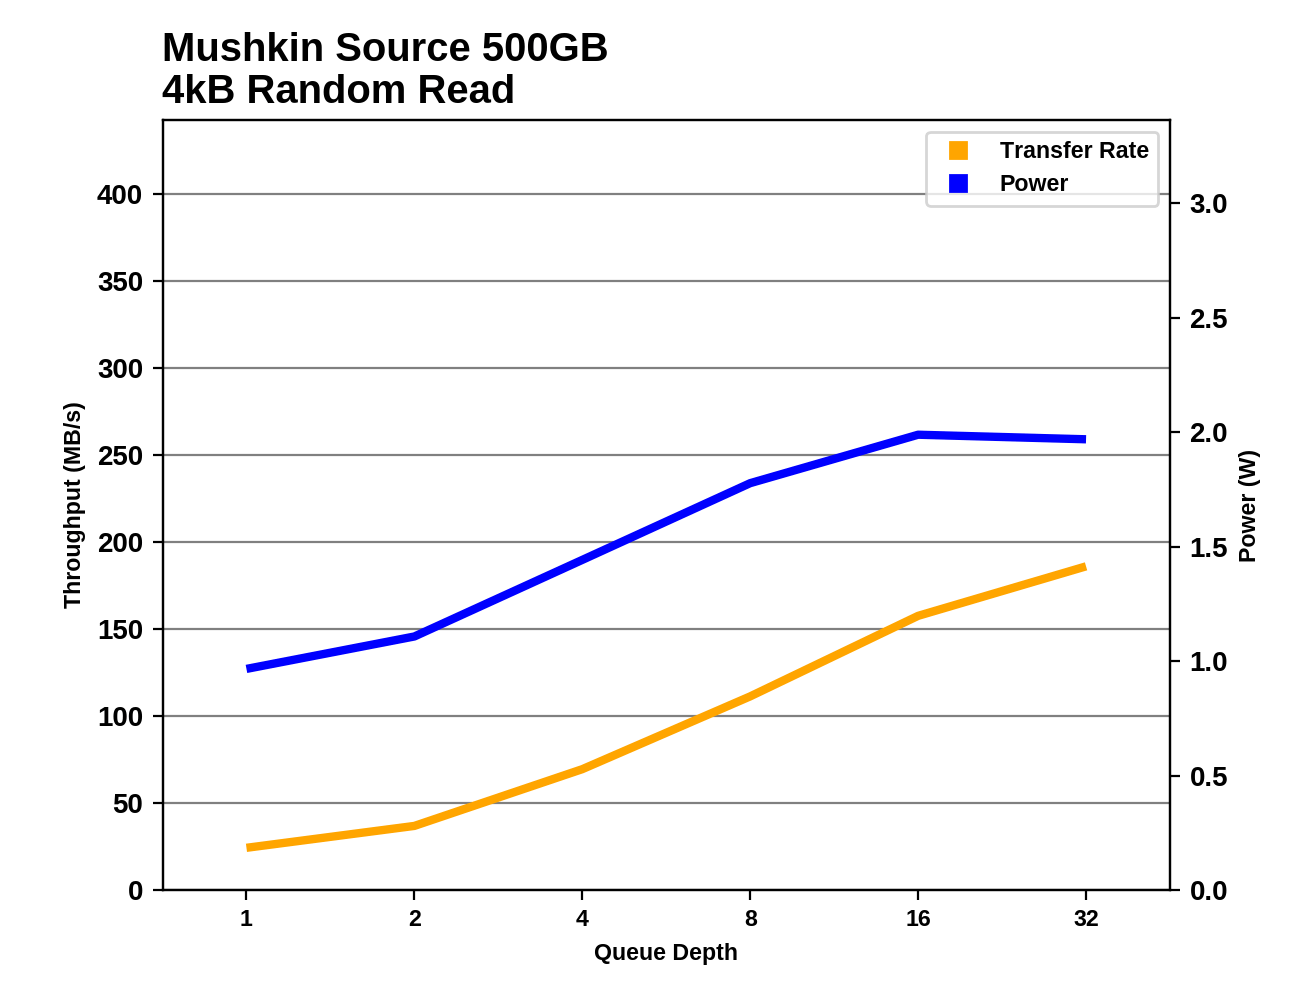
The random read performance of the Mushkin Source does scale with increasing queue depth (especially past QD2), but the mainstream SATA SSDs greatly outpace it and several end up with almost twice the performance at high queue depths.
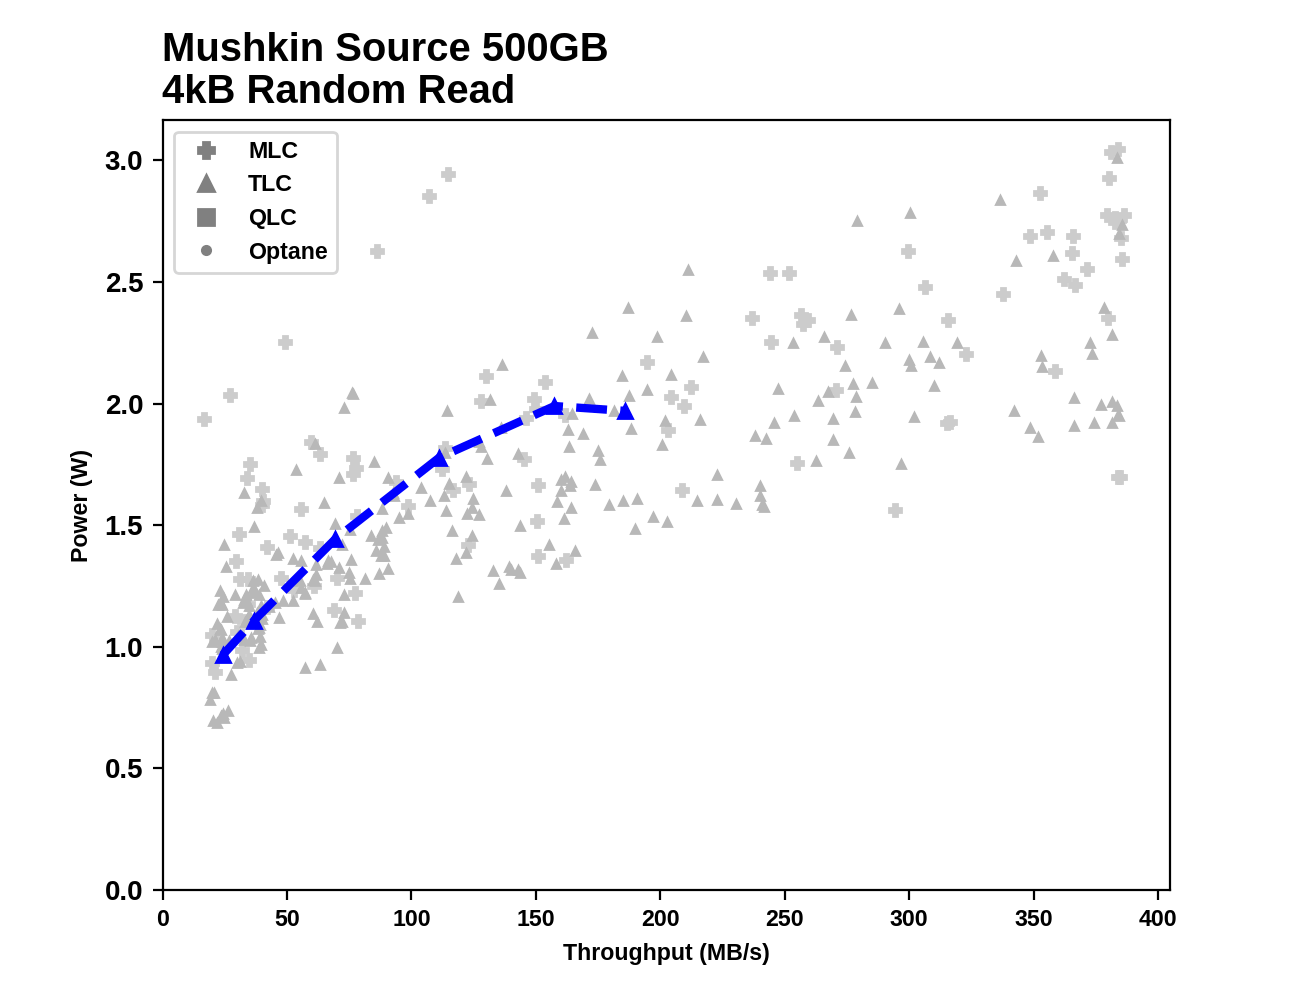
Comparing the Mushkin Source against all the other SATA SSDs that have completed this test, it is clear that the Source doesn't come close to reaching the limits of the SATA interface, and its power consumption at high queue depths is rather high for the performance it enables.
Random Write Performance
Our test of random write burst performance is structured similarly to the random read burst test, but each burst is only 4MB and the total test length is 128MB. The 4kB random write operations are distributed over a 16GB span of the drive, and the operations are issued one at a time with no queuing.
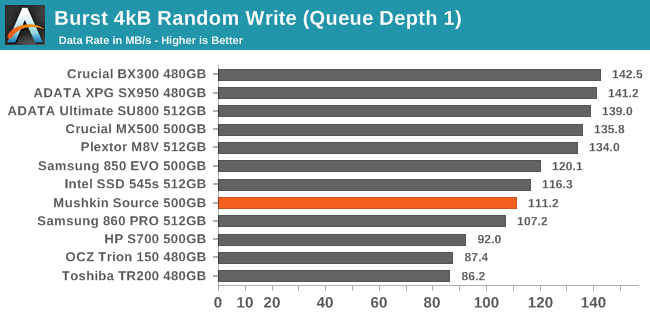
The burst random write performance of the Mushkin Source is a bit on the slow side, but the DRAMless SSDs don't stand out as extreme outliers thanks to their reasonably quick SLC write caches.
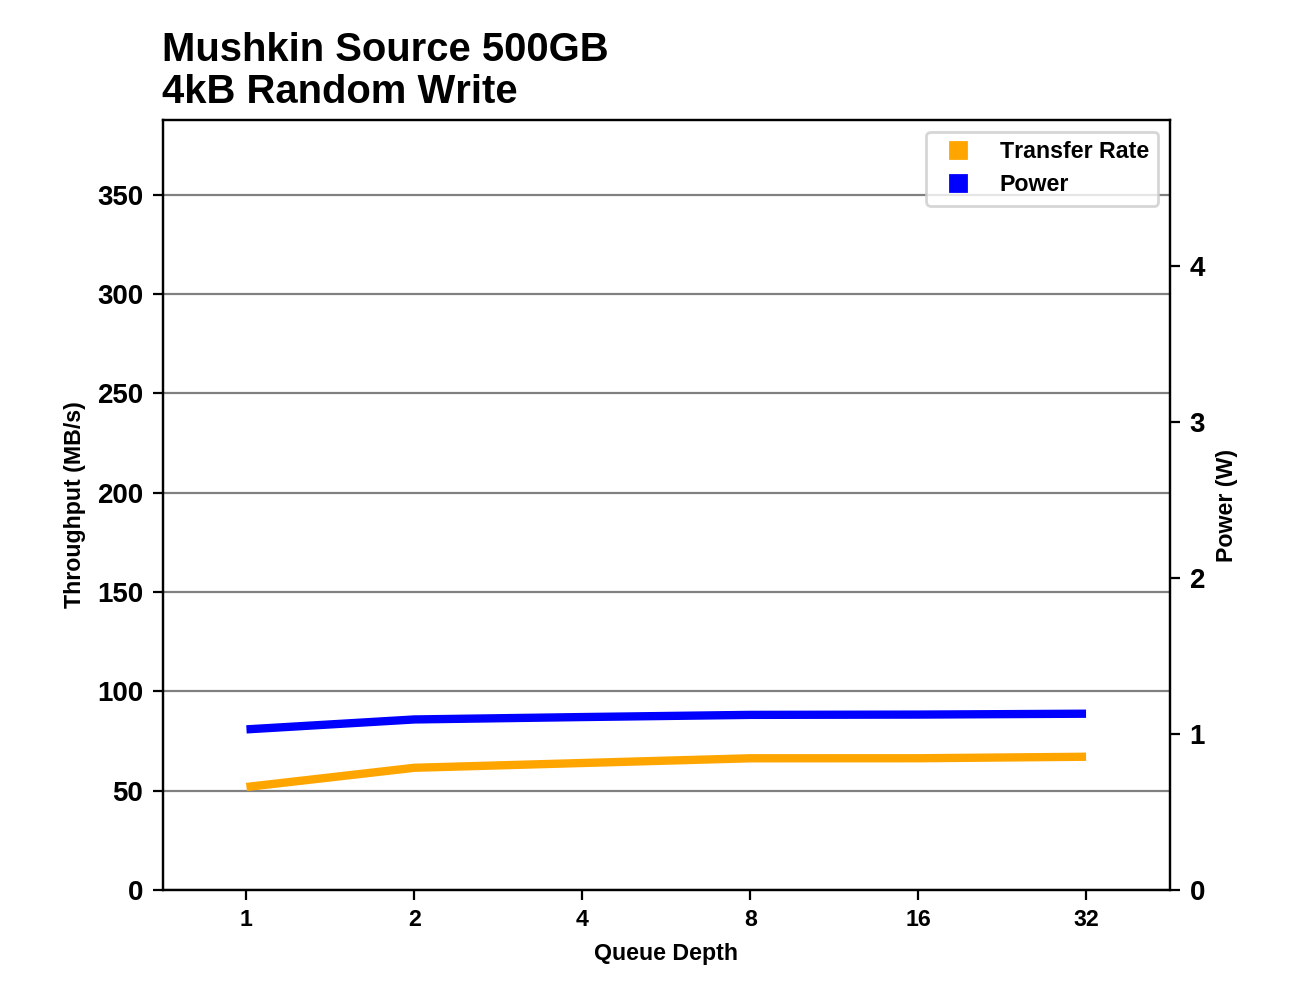
As with the sustained random read test, our sustained 4kB random write test runs for up to one minute or 32GB per queue depth, covering a 64GB span of the drive and giving the drive up to 1 minute of idle time between queue depths to allow for write caches to be flushed and for the drive to cool down.
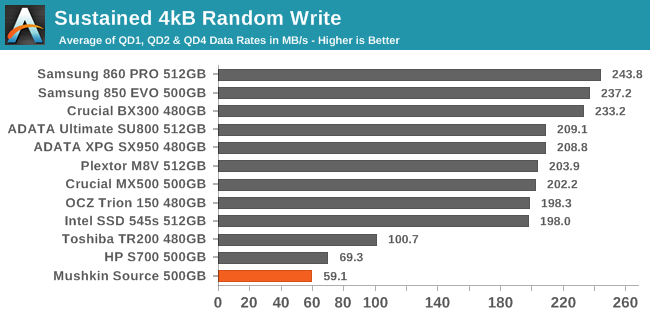
On the longer random write test, the difficulty of managing an overflowing SLC cache on a DRAMless drive is readily apparent, and the Mushkin Source suffers more than the other two DRAMless SSDs. The mainstream SATA SSDs are 3-4 times faster than the Source.
 |
|||||||||
| Power Efficiency in MB/s/W | Average Power in W | ||||||||
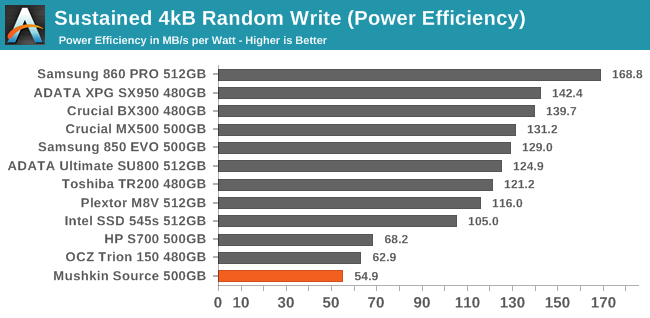
The Mushkin Source and other DRAMless SSDs do use significantly less power than the mainstream SATA SSDs on the random write test, but the savings are nowhere near large enough to make up for the huge performance deficit. The Source is both slower and more power-hungry than the other DRAMless SSDs, so it comes in last place for efficiency.
 |
|||||||||
The random write performance of the Mushkin Source does not improve appreciably with increasing performance, because each phase of this test writes more than enough data to exhaust the SLC cache. The Toshiba TR200 DRAMless SSD does manage a significant increase from QD1 to QD8, but even so it offers less than half the performance of a good mainstream drive.
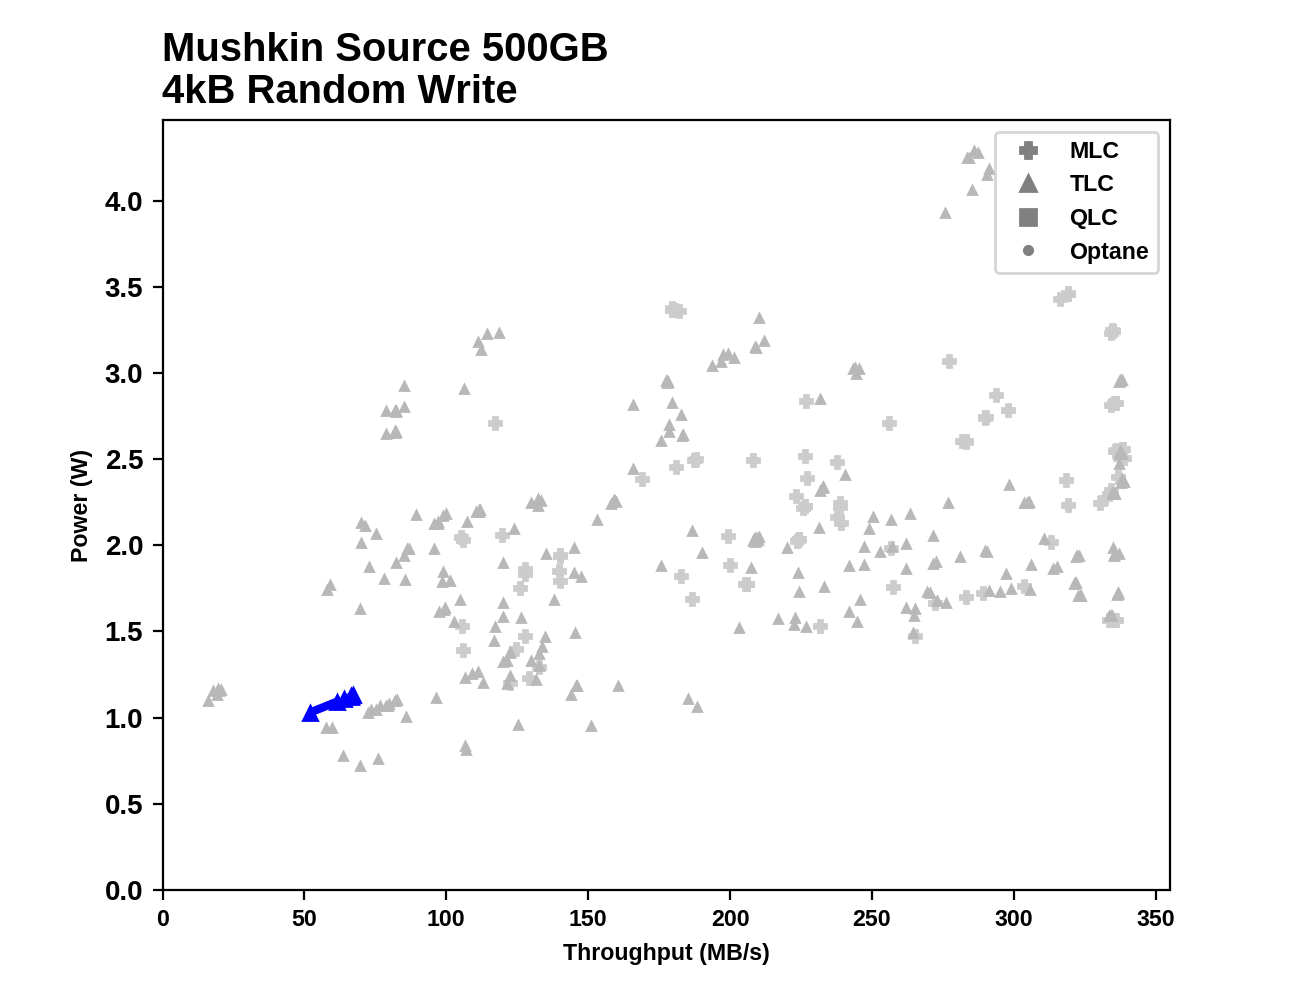
Plotted against all the other SATA SSDs that have completed this test, it is clear that the Mushkin Source is one of the slowest, and other drives have offered much higher performance within a lower power budget.


30 Comments
View All Comments
benedict - Wednesday, November 21, 2018 - link
This needs to be less than 10$/GB to make any sense.deil - Wednesday, November 21, 2018 - link
it might be, wait 3-4 months from initial start. Still its cheapest 500 GB I've seen so far, and that is good sign.Small Bison - Wednesday, November 21, 2018 - link
Yeah, charging over five thousand dollars for a 500GB DRAM-less drive *does* seem like a bit much.excelle08 - Thursday, November 22, 2018 - link
Well you aren't referring to US Dollars, right?😂PeachNCream - Wednesday, November 21, 2018 - link
The scatter plots on pages 6 and 7 may benefit from the addition of color to differentiate storage types. As they stand, they're difficult to extract meaningful data from for a few reasons, but the worst offenders are too many data points in the given space and poor contrast between data types.Billy Tallis - Wednesday, November 21, 2018 - link
The purpose of those scatter plots isn't to enable comparing the highlighted drive against any particular competitor, but to show where it falls relative to the limits of what is possible/normal. The data points for the non-highlighted drives are deliberately low-contrast because their exact value or identity aren't what's important for that graph. They're supposed to blend into a cloud.PeachNCream - Wednesday, November 21, 2018 - link
Hmm, well I wasn't implying that there ought to be individual products highlighted. I was suggesting that using a categorical color in addition to the shape would help with overall visibility. For example, make TLC red, MLC green, and Optane black or something. It would allow us to extrapolate trend-like significance to the categories that were defined in the chart and position the Source among them.Great_Scott - Wednesday, November 21, 2018 - link
SSD prices are so compressed right now that I'm considering getting a Samsung 860 EVO... as the 'cheap' option.There's really no point in getting a 'budget' 2.5" form-factor drive as every brand falls within about a 10% total price range.
Ratman6161 - Wednesday, November 21, 2018 - link
Absolutely. In the SATA space, there is no reason to even look at anything other than the Samsung 860 EVO or the Crucial MX500. The 860 EVO is even cheaper than this piece of junk at the 1 TB level and only $7 less at 500 GB. There is no reason for this drive to exist unless they cut the price...a lot.heffeque - Wednesday, November 21, 2018 - link
Well the BX500 is a pretty decent drive and is somewhat cheaper than both 860EVO and MX500.