The Intel Optane Memory M10 (64GB) Review: Optane Caching Refreshed
by Billy Tallis on May 15, 2018 10:45 AM EST- Posted in
- SSDs
- Storage
- Intel
- PCIe SSD
- SSD Caching
- M.2
- NVMe
- Optane
- Optane Memory
Sequential Read Performance
Our first test of sequential read performance uses short bursts of 128MB, issued as 128kB operations with no queuing. The test averages performance across eight bursts for a total of 1GB of data transferred from a drive containing 16GB of data. Between each burst the drive is given enough idle time to keep the overall duty cycle at 20%.
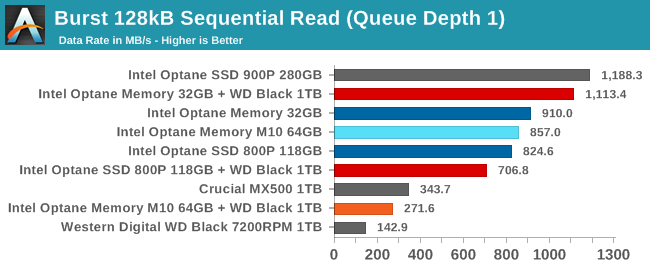
The burst sequential read results are bizarre, with the 32GB caching configuration coming in second only to the Optane SSD 900P while the large Optane M.2 modules perform much worse as cache devices than as standalone drives. The caching performance from the 64GB Optane Memory M10 is especially disappointing, with less than a third of the performance that the drive delivers as a standalone device. Some SSD caching software attempts to have sequential I/O bypass the cache to leave the SSD ready handle random I/O, but this test is not a situation where such a strategy would make sense. Without more documentation from Intel about their proprietary caching algorithms and with no way to query the Optane Memory drivers about the cache status, it's hard to figure out what's going on here. Aside from the one particularly bad result from the M10 as a cache, all of the Optane configurations do at least score far above the SATA SSD.
Our test of sustained sequential reads uses queue depths from 1 to 32, with the performance and power scores computed as the average of QD1, QD2 and QD4. Each queue depth is tested for up to one minute or 32GB transferred, from a drive containing 64GB of data.
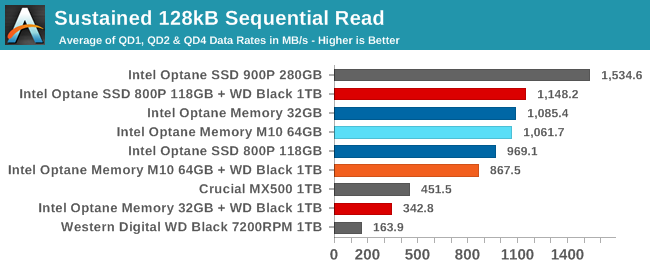
The sustained sequential read test results make more sense. The 32GB cache configuration isn't anywhere near large enough for this test's 64GB dataset, but the larger Optane M.2 modules offer good performance as standalone drives or as cache devices. The 64GB Optane Memory M10 scores worse as a cache drive, which is to be expected since the test's dataset doesn't quite fit in the cache.
 |
|||||||||
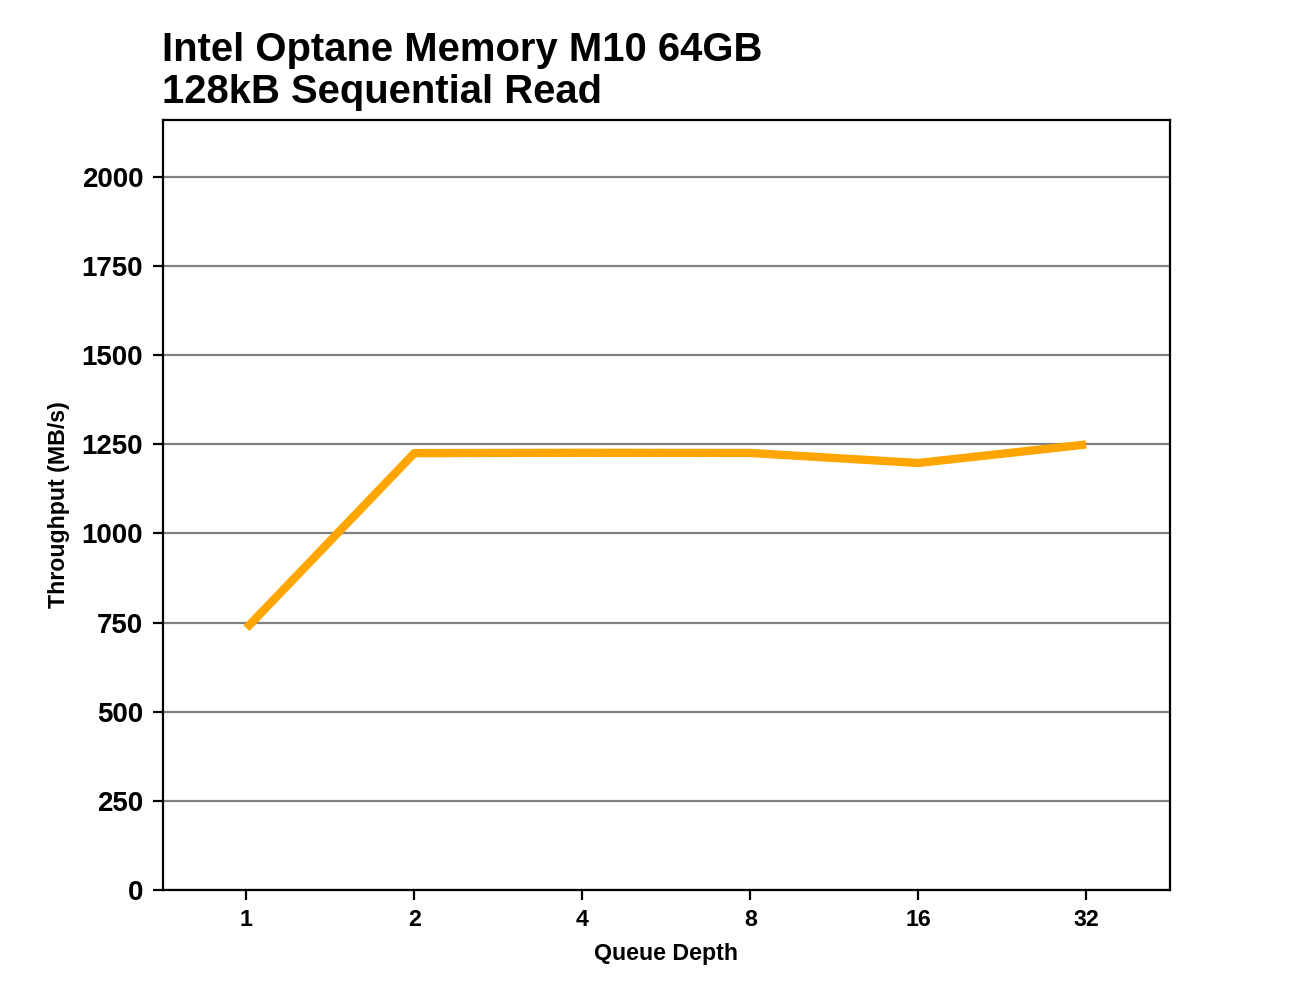
Using an 118GB Optane M.2 module as a cache seems to help with sequential reads at QD1, likely due to some prefetching in the caching software. The 64GB cache handles the sustained sequential read workload better than either of the sustained random I/O tests, but it is still slower than the SSD alone at low queue depths. Performance from the 32GB cache is inconsistent but usually still substantially better than the hard drive alone.
Sequential Write Performance
Our test of sequential write burst performance is structured identically to the sequential read burst performance test save for the direction of the data transfer. Each burst writes 128MB as 128kB operations issued at QD1, for a total of 1GB of data written to a drive containing 16GB of data.
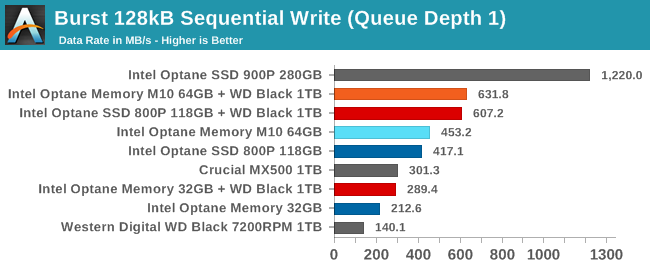
As with the random write tests, the cache configurations show higher burst sequential write performance than testing the Optane M.2 modules as standalone SSDs. This points to driver improvements that may include mild cheating through the use of a RAM cache, but the performance gap is small enough that there doesn't appear to be much if any data put at risk. The 64GB and 118GB caches have similar performance with the 64GB slightly ahead, but the 32GB cache barely keep up with a SATA drive.
Our test of sustained sequential writes is structured identically to our sustained sequential read test, save for the direction of the data transfers. Queue depths range from 1 to 32 and each queue depth is tested for up to one minute or 32GB, followed by up to one minute of idle time for the drive to cool off and perform garbage collection. The test is confined to a 64GB span of the drive.
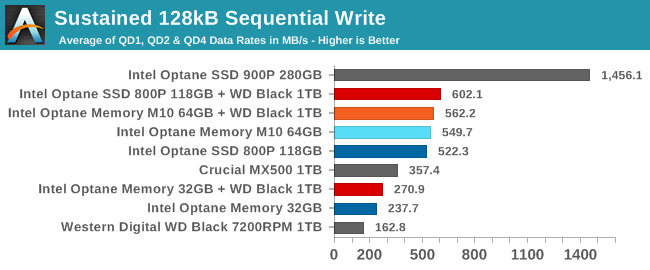
The rankings on the sustained sequential write test are quite similar, but this time the 118GB Optane SSD 800P has the lead over the 64GB Optane Memory M10. The performance advantage of the caching configurations over the standalone drive performance is smaller than for the burst sequential write test, because this test writes far more data than could be cached in RAM.
 |
|||||||||
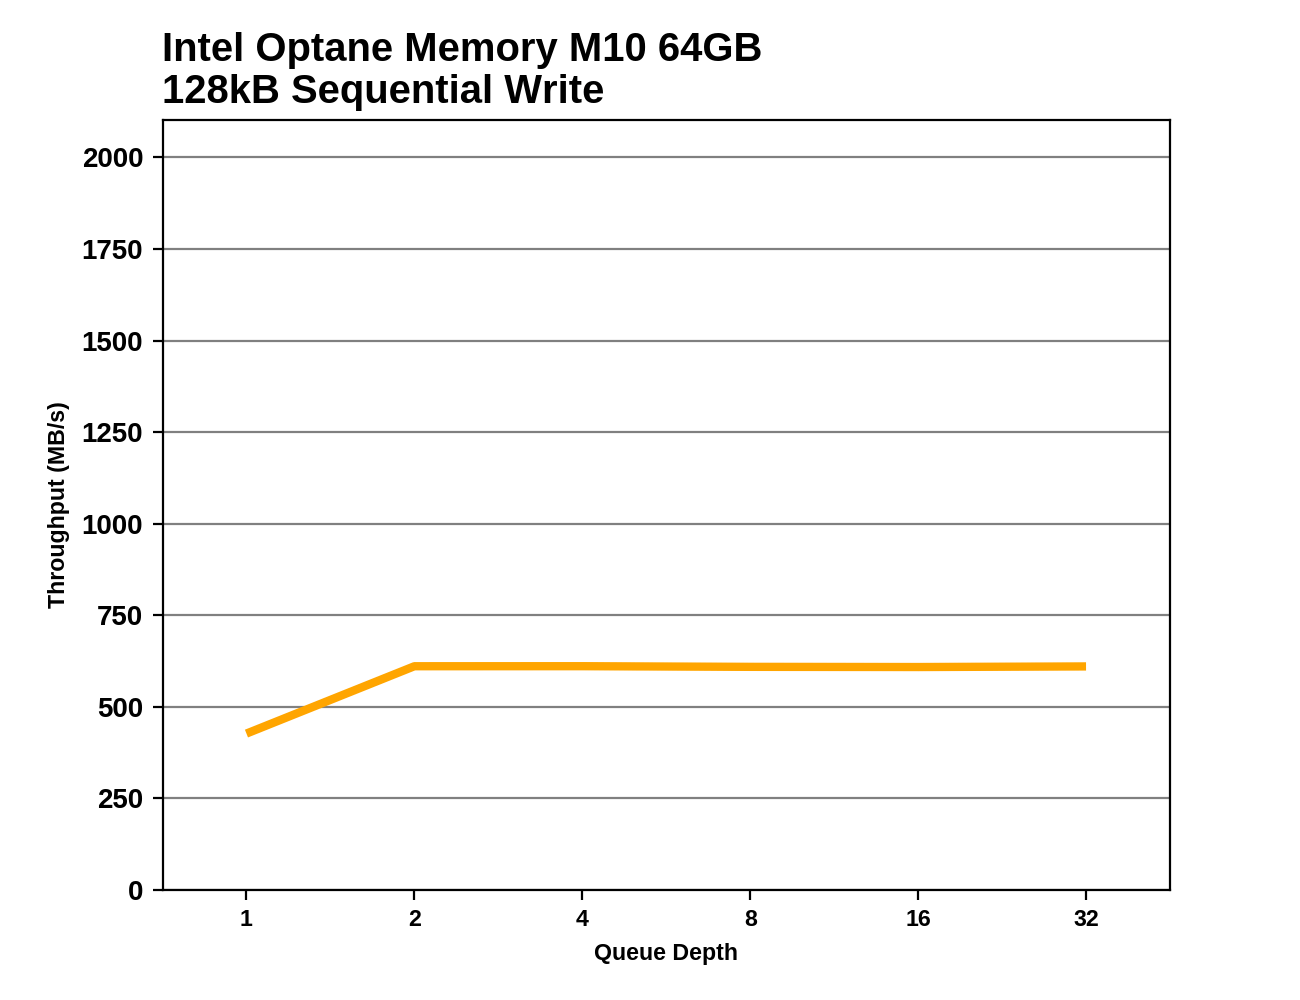
Aside from some differences at QD1, the Optane M.2 modules offer basically the same performance when used as caches or as standalone drives. Since this test writes no more than 32GB at a time without a break and all of the caches tested are that size or larger, the caching software can always stream all of the writes to just the Optane module without having to stop and flush dirty data to the slower hard drive. If this test were lengthened to write more than 32GB at a time or if it were run on the 16GB Optane Memory, performance would plummet partway through each phase of the test.


96 Comments
View All Comments
jordanclock - Wednesday, May 16, 2018 - link
Yeah, 64GB is ~59GiB.IntelUser2000 - Tuesday, May 15, 2018 - link
Billy,Could you tell us why the performance is much lower? I was thinking Meltdown but 800P article says it has the patch enabled. The random performance here is 160MB/s for 800P, but on the other article it gets 600MB/s.
Billy Tallis - Tuesday, May 15, 2018 - link
The synthetic benchmarks in this review were all run under Windows so that they could be directly compared to results from the Windows-only caching drivers. My other reviews use Linux for the synthetic benchmarks. At the moment I'm not sure if the big performance disparity is due entirely to Windows limitations, or if there's some system tuning I could do to Windows to bring performance back up. My Linux testbed is set up to minimize OS overhead, but the Windows images used for this reivew were all stock out of the box settings.IntelUser2000 - Tuesday, May 15, 2018 - link
What is used for the random tests? IOmeter?Billy Tallis - Tuesday, May 15, 2018 - link
FIO version 3.6, Windows binaries from https://bluestop.org/fio/ (and Linux binaries compiled locally, for the other reviews). The only fio settings that had to change when moving the scripts from Linux to Windows was the ioengine option for selecting which APIs to use for IO. On Linux, QD1 tests are done with synchronous IO and higher queue depths with libaio, and on Windows all the queue depths used asynchronous IO.In this review I also didn't bother secure erasing the drives between running the burst and sustained tests, but that shouldn't matter much for these drives.
IntelUser2000 - Tuesday, May 15, 2018 - link
So looking at the original Optane Memory review, the loss must be due to Meltdown as it also gets 400MB/s.Billy Tallis - Tuesday, May 15, 2018 - link
The Meltdown+Spectre workarounds don't have anywhere near this kind of impact on Linux, so I don't think that's a sufficient explanation for what's going on with this review's Windows results.Last year's Optane Memory review only did synthetic benchmarks of the drive as a standalone device, not in a caching configuration because the drivers only supported boot drive acceleration at that time.
IntelUser2000 - Tuesday, May 15, 2018 - link
The strange performance may also explain why its sometimes faster in caching than when its standalone.Certainly the drive is capable of faster than that looking at raw media performance.
My point with the last review was that, whether its standalone or not, the drive on the Optane Memory review is getting ~400MB/s, while in this review its getting 160MB/s.
tuxRoller - Wednesday, May 16, 2018 - link
As Billy said you're comparing the results from two different OSs'Intel999 - Tuesday, May 15, 2018 - link
Will there be a comparison between the uber expensive Intel approach to sped up boot times with AMD's free approach using StorageMI?