The Intel Optane Memory M10 (64GB) Review: Optane Caching Refreshed
by Billy Tallis on May 15, 2018 10:45 AM EST- Posted in
- SSDs
- Storage
- Intel
- PCIe SSD
- SSD Caching
- M.2
- NVMe
- Optane
- Optane Memory
AnandTech Storage Bench - Light
Our Light storage test has relatively more sequential accesses and lower queue depths than The Destroyer or the Heavy test, and it's by far the shortest test overall. It's based largely on applications that aren't highly dependent on storage performance, so this is a test more of application launch times and file load times. This test can be seen as the sum of all the little delays in daily usage, but with the idle times trimmed to 25ms it takes less than half an hour to run. Details of the Light test can be found here. As with the ATSB Heavy test, this test is run with the drive both freshly erased and empty, and after filling the drive with sequential writes.
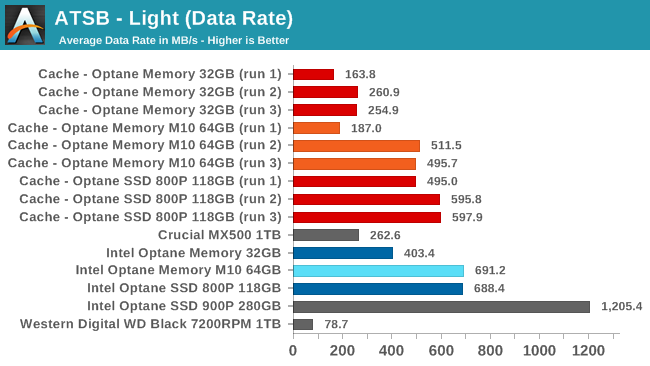
The data rates on the Light test show clear signs of a cold cache on the first run, with substantially improved performance for the second and third runs. The 32GB cache module is still a bit small for this test and it can only bring the data rates up to about the level of a SATA SSD, but the 64GB and 118GB modules allow for performance that almost matches low-end NVMe SSDs like the MyDigitalSSD SBX (and without the capacity limitations or steep performance drop when full).
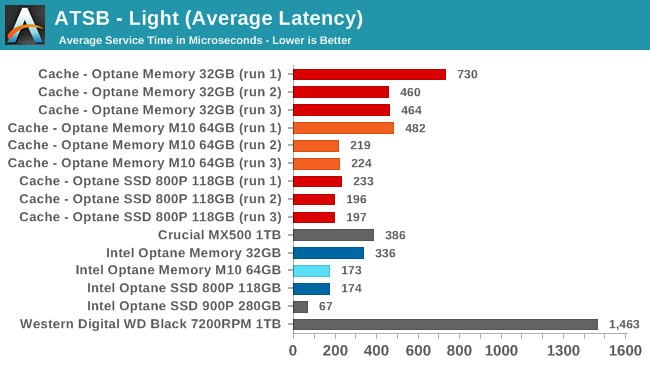
With a warmed-up cache, the Optane Memory M10 64GB and the larger Optane SSD 800P offer better average and 99th percentile latency than SATA SSDs. The 118GB cache beats the SATA drives even with a cold cache. The 32GB Optane Memory is well behind the SATA SSD even with a warm cache, especially for 99th percentile latency. But even so, all of these cache configurations easily beat running on just a hard drive.
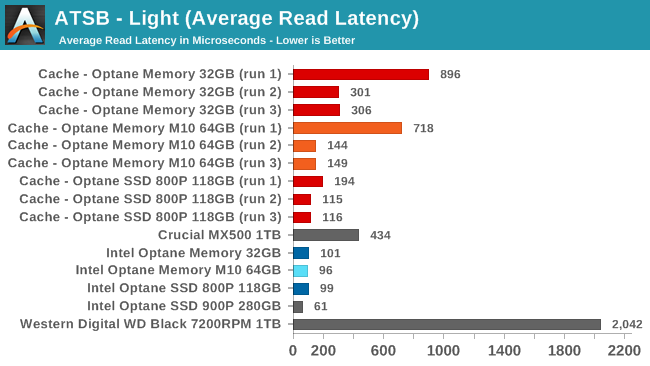
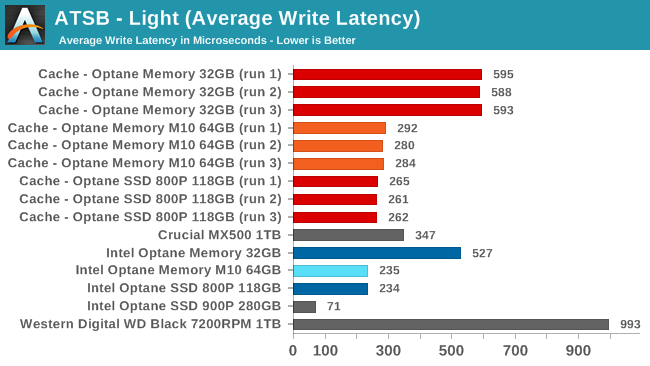
The effects of a cold vs. warm cache show up quite clearly on the average read latency chart, but naturally have minimal effect on the average write latencies. It is clear that the 32GB Optane Memory's overall latency fell behind that of the SATA SSD almost entirely because of poor write performance: with a warm cache, the read latency of the 32GB module is slower than that of its larger siblings but is still an improvement over the SATA SSD.
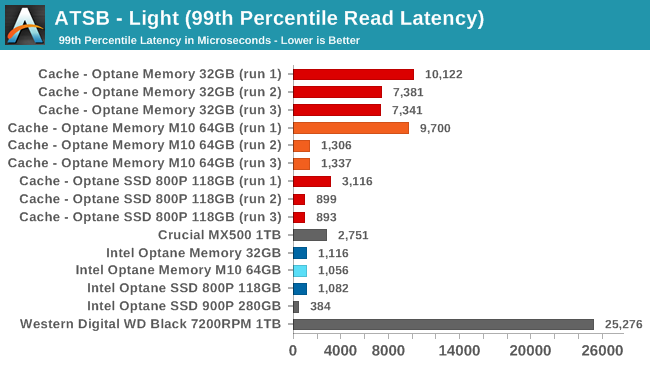
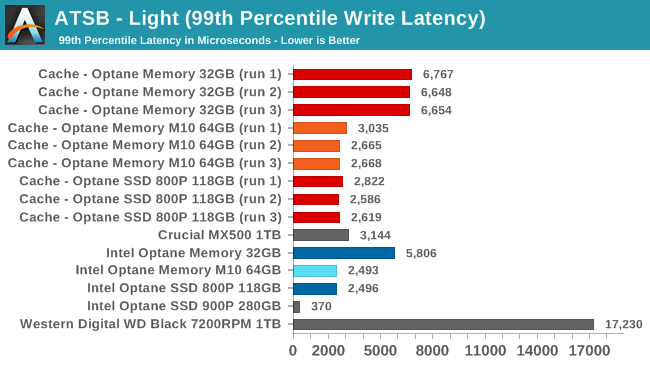
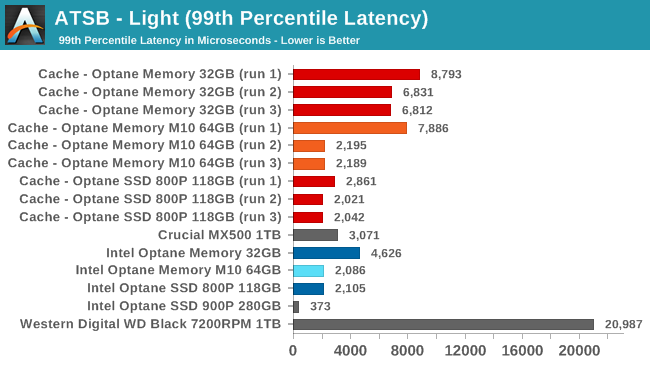
The 99th percentile read latency scores emphasize the impact of a cold cache more than the average latency, especially for the 64GB cache module. Even the 118GB cache lags behind the SATA SSD on the first run. The 99th percentile write latencies are larger in absolute terms than the average write latencies, but the relative differences are almost all the same except that the hard drive stands out even more.


96 Comments
View All Comments
jordanclock - Wednesday, May 16, 2018 - link
Yeah, 64GB is ~59GiB.IntelUser2000 - Tuesday, May 15, 2018 - link
Billy,Could you tell us why the performance is much lower? I was thinking Meltdown but 800P article says it has the patch enabled. The random performance here is 160MB/s for 800P, but on the other article it gets 600MB/s.
Billy Tallis - Tuesday, May 15, 2018 - link
The synthetic benchmarks in this review were all run under Windows so that they could be directly compared to results from the Windows-only caching drivers. My other reviews use Linux for the synthetic benchmarks. At the moment I'm not sure if the big performance disparity is due entirely to Windows limitations, or if there's some system tuning I could do to Windows to bring performance back up. My Linux testbed is set up to minimize OS overhead, but the Windows images used for this reivew were all stock out of the box settings.IntelUser2000 - Tuesday, May 15, 2018 - link
What is used for the random tests? IOmeter?Billy Tallis - Tuesday, May 15, 2018 - link
FIO version 3.6, Windows binaries from https://bluestop.org/fio/ (and Linux binaries compiled locally, for the other reviews). The only fio settings that had to change when moving the scripts from Linux to Windows was the ioengine option for selecting which APIs to use for IO. On Linux, QD1 tests are done with synchronous IO and higher queue depths with libaio, and on Windows all the queue depths used asynchronous IO.In this review I also didn't bother secure erasing the drives between running the burst and sustained tests, but that shouldn't matter much for these drives.
IntelUser2000 - Tuesday, May 15, 2018 - link
So looking at the original Optane Memory review, the loss must be due to Meltdown as it also gets 400MB/s.Billy Tallis - Tuesday, May 15, 2018 - link
The Meltdown+Spectre workarounds don't have anywhere near this kind of impact on Linux, so I don't think that's a sufficient explanation for what's going on with this review's Windows results.Last year's Optane Memory review only did synthetic benchmarks of the drive as a standalone device, not in a caching configuration because the drivers only supported boot drive acceleration at that time.
IntelUser2000 - Tuesday, May 15, 2018 - link
The strange performance may also explain why its sometimes faster in caching than when its standalone.Certainly the drive is capable of faster than that looking at raw media performance.
My point with the last review was that, whether its standalone or not, the drive on the Optane Memory review is getting ~400MB/s, while in this review its getting 160MB/s.
tuxRoller - Wednesday, May 16, 2018 - link
As Billy said you're comparing the results from two different OSs'Intel999 - Tuesday, May 15, 2018 - link
Will there be a comparison between the uber expensive Intel approach to sped up boot times with AMD's free approach using StorageMI?