The GIGABYTE H370N WiFi Review: Mini-ITX with HDMI 2.0 and 802.11ac Wave 2
by Joe Shields on June 21, 2018 9:01 AM EST- Posted in
- Motherboards
- Intel
- Gigabyte
- Mini ITX
- Core 8th Gen
- Coffee Lake
- H370
CPU Performance, Short Form
For our motherboard reviews, we use our short form testing method. These tests usually focus on if a motherboard is using MultiCore Turbo (the feature used to have maximum turbo on at all times, giving a frequency advantage), or if there are slight gains to be had from tweaking the firmware. We leave the BIOS settings at default and memory at JEDEC for the supported frequency of the processor for these tests, making it very easy to see which motherboards have MCT enabled by default.
Rendering - Blender 2.78: link
For a render that has been around for what seems like ages, Blender is still a highly popular tool. We managed to wrap up a standard workload into the February 5 nightly build of Blender and measure the time it takes to render the first frame of the scene. Being one of the bigger open source tools out there, it means both AMD and Intel work actively to help improve the codebase, for better or for worse on their own/each other's microarchitecture.
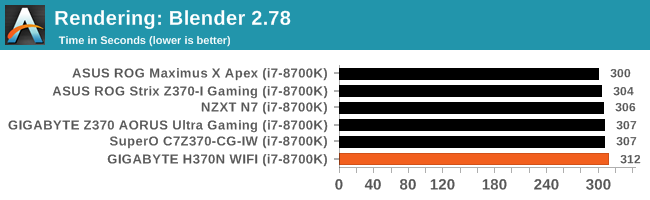
The H370N WIFI completed the Blender benchmark in 312 seconds. This result is a bit slower than the main grouping by a couple seconds. The range of results spans a range of around 4% from the fastest to slowest with the majority of results hovering around the 306s median.
Rendering – POV-Ray 3.7: link
The Persistence of Vision Ray Tracer, or POV-Ray, is a freeware package for as the name suggests, ray tracing. It is a pure renderer, rather than modeling software, but the latest beta version contains a handy benchmark for stressing all processing threads on a platform. We have been using this test in motherboard reviews to test memory stability at various CPU speeds to good effect – if it passes the test, the IMC in the CPU is stable for a given CPU speed. As a CPU test, it runs for approximately 1-2 minutes on high-end platforms.
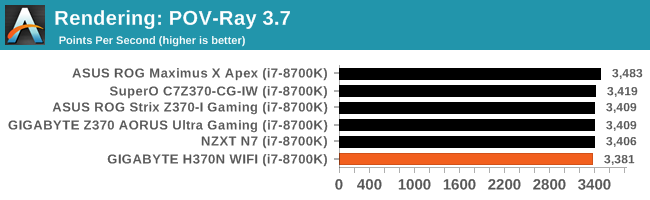
POV-Ray results show the Mini-ITX board hanging with the pack in this thread heavy benchmark. All boards ran the benchmark at the same clock speed of 4.3 GHz. This particular group of results is very tight with around a 1% difference (margin of error) separating the meat of the results.
Compression – WinRAR 5.4: link
Our WinRAR test from 2013 is updated to the latest version of WinRAR at the start of 2014. We compress a set of 2867 files across 320 folders totaling 1.52 GB in size – 95% of these files are small typical website files, and the rest (90% of the size) are small 30-second 720p videos.
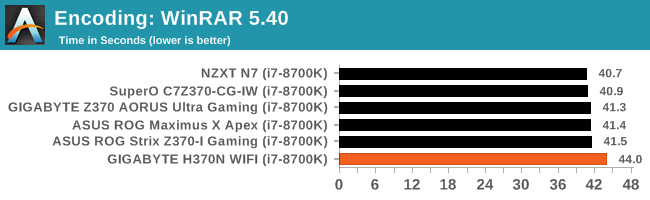
The WinRAR results show our little board completing this test in 44 seconds. This result is slowest we have seen, by almost 10%. All clocks and speeds were the same and we did not see any throttling listed through a sanity check.
Synthetic – 7-Zip 9.2: link
As an open source compression tool, 7-Zip is a popular tool for making sets of files easier to handle and transfer. The software offers up its own benchmark, to which we report the result.
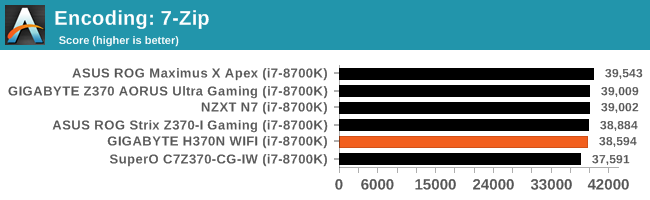
The 7-Zip results have the H370N WIFI scoring 38594. We end up with yet another result mixing in with others we have so far.
Point Calculations – 3D Movement Algorithm Test: link
3DPM is a self-penned benchmark, taking basic 3D movement algorithms used in Brownian Motion simulations and testing them for speed. High floating point performance, MHz, and IPC win in the single thread version, whereas the multithread version has to handle the threads and loves more cores. For a brief explanation of the platform agnostic coding behind this benchmark, see my forum post here.
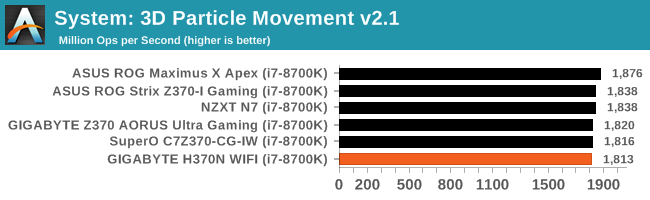
In 3DPM21, The H370N WIFI reached 1813 Mop/s. The scores of all Z370 and i7-8700K testing were within 60 points (around 3%) of each other. The CPUs all ran the same speeds in this test, so again we see a margin of error size differences between our datasets so far.
Neuron Simulation - DigiCortex v1.20: link
The newest benchmark in our suite is DigiCortex, a simulation of biologically plausible neural network circuits, and simulates activity of neurons and synapses. DigiCortex relies heavily on a mix of DRAM speed and computational throughput, indicating that systems which apply memory profiles properly should benefit and those that play fast and loose with overclocking settings might get some extra speed up. Results are taken during the steady state period in a 32k neuron simulation and represented as a function of the ability to simulate in real time (1.000x equals real-time).
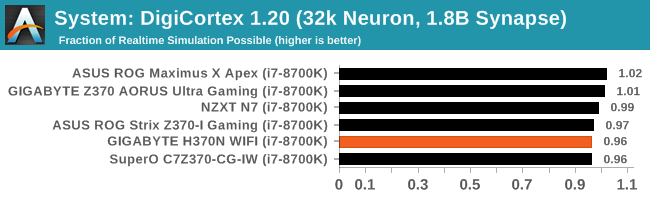
The DigiCortex results have the H370N WIFI with a result of 0.96 matching the SuperO board. Nothing of note with that result. DigiCortex does show a decent spread between results which is different than we have seen previously with 6% separating the best from worst.


23 Comments
View All Comments
TallBill - Sunday, June 24, 2018 - link
What do you think about the term Nazi being thrown around as if it means nothing?E1m1 - Monday, June 25, 2018 - link
Does it support hdcp 2.2 on hdmi 2.0?And which itx bosrds supports hdcp2.2?.
CheapSushi - Monday, June 25, 2018 - link
I really wish more boards put M.2 slots underneath the board! It's fanatastic IMO. Even ATX should do it. We have all these HEDT CPU available now with lots of PCIe lanes, even chipsets with even more lanes, and ATX and EATX don't even get full 7 x16 slots usually. I wish we could maximize the board even further. Full 7 x16 slots with M.2 slots on the back would just be so perfect for maybe 1 or two top end boards. Along with more SFF-8643 ports!