Overclocking The AMD Ryzen APUs: Guide and Results
by Ian Cutress & Gavin Bonshor on April 16, 2018 2:30 PM ESTOverclocking Results
So from our test setup, we tested one each of the CPUs at both 'stock' and our 'max overclock' setting, combining the peak CPU, DRAM, and graphics frequency all into one overclock. This means we are comparing the following:
| Overclocked vs Stock | |||||
| Processors | Ryzen 3 2200G 4C / 4T Vega 8 Graphics |
AMD Ryzen 5 2400G 4C / 8T Vega 11 Graphics |
|||
| CPU | Stock | 3.50 / 3.70 GHz | 3.60 / 3.90 GHz | ||
| Overclock | 3.9 GHz All-Core | 4.0 GHz All-Core | |||
| DRAM | Stock | DDR4-2400 | DDR4-2400 | ||
| Overclock | DDR4-3333 C17 | DDR4-3333 C17 | |||
| Graphics | Stock | 1100 MHz | 1250 MHz | ||
| Overclock | 1360 MHz | 1400 MHz | |||
Users quick on the ball will see that we've run DDR4-2400 as our 'stock' memory frequency. This is ultimately what would be chosen if a user did not even apply any profile whatsoever, and simply put the memory in the system right out of the box. Anecdotally, we still see a number of users failing to enable their high-speed memory, because it requires that extra selection of XMP which is not easily detailed by the memory vendors (to be fair, it would be impossible to list every BIOS version and directions on how-to for new users). Having seen a close friend who I thought knew how to do this, we're going to use the opportunity to show the uplift of overclocking the memory from 'out-of-the-box' to a proper overclock as well.
Power Consumption
For our power consumption metrics, we use a Prime 95 blended torture test on fixed threads and Furmark blender GPU burn-in at 1080p to generate a strong and consistent load. Then pull the power figure from a power consumption monitor at the wall to get the power consumption. For the idle test, a consistent and base stable figure is taken whereas with load, a peak value is taken instead. The values were taken after 10 minutes, both idle with the OS in a stable and idle state with no foreground applications running, with the figures being taken under load after exactly 10 minutes with Prime95 and Furmark running simultaneously.
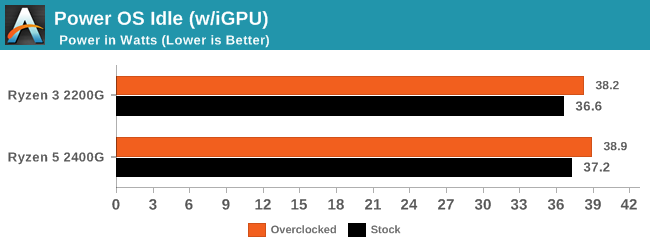
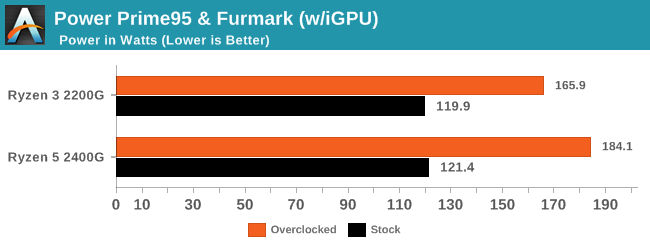
As expected, the idle power numbers do not change that much with overclocking, however at load we see the Ryzen 3 2200G gain another 46W and the Ryzen 5 2400G gain another ~63W. This essentially almost doubles the power consumption of the Ryzen 5, which as we see below requires good cooling.
Temperatures
Considered to be as important as power consumption, temperature can be the difference between a completely stable and quiet system, and one that's riddled with instability. At idle state, the package temperature was recorded with HWMonitor after 10 minutes of idleness, with room temperature being monitored via an electronic room thermometer. The room temperature was deducted from the package to give the delta temperature. At load, the peak temperature was taken from HWMonitor with the current room temperature being deducted to give the delta temperature.
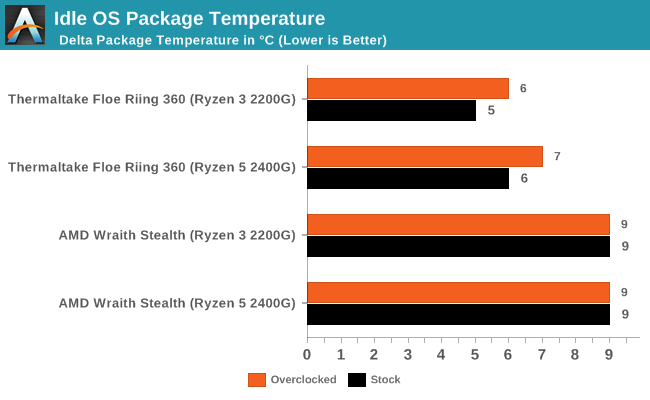
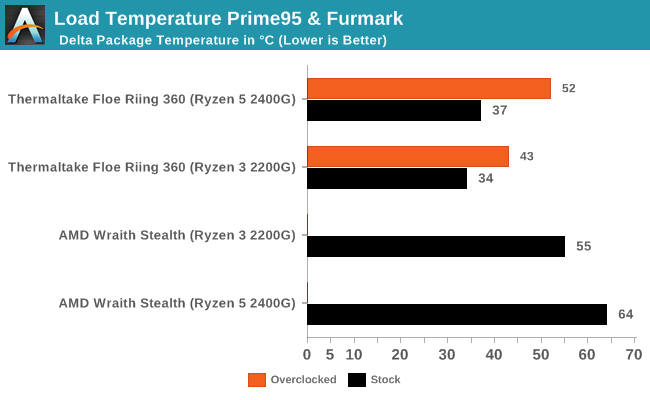
*No overclocked values for AMD Wraith Stealth - the system rebooted due to temperature limits
At idle, both the Thermaltake Floe Riing RGB 360 AIO cooler and the provided stock AMD Wraith Stealth CPU cooler remain within a reasonable distance of each other, but under load when overclocked the Wraith failed to deliver with both Prime95 and Furmark applied; the system would hang and crash. The AMD Wraith Stock cooler is absolutely fine for smaller overclocks, but for big overclocks, then a decent air tower or good AIO CPU cooler is paramount to getting the most from the APUs.
Rendering – POV-Ray 3.7.1b4: link
The Persistence of Vision Ray Tracer, or POV-Ray, is a freeware package for as the name suggests, ray tracing. It is a pure renderer, rather than modeling software, but the latest beta version contains a handy benchmark for stressing all processing threads on a platform. We have been using this test in motherboard reviews to test memory stability at various CPU speeds to good effect – if it passes the test, the IMC in the CPU is stable for a given CPU speed. As a CPU test, it runs for approximately 2-3 minutes on high end platforms.
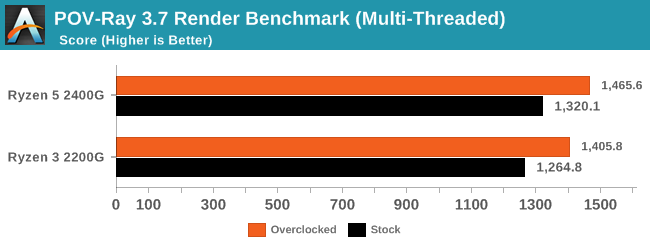
In both cases, our peak productivity benchmark shows a performance gain of just over 11% when overclocked.
Rendering - Blender 2.78: link
For a render that has been around for what seems like ages, Blender is still a highly popular tool. We managed to wrap up a standard workload into the February 5 nightly build of Blender and measure the time it takes to render the first frame of the scene. Being one of the bigger open source tools out there, it means both AMD and Intel work actively to help improve the codebase, for better or for worse on their own/each other's microarchitecture.
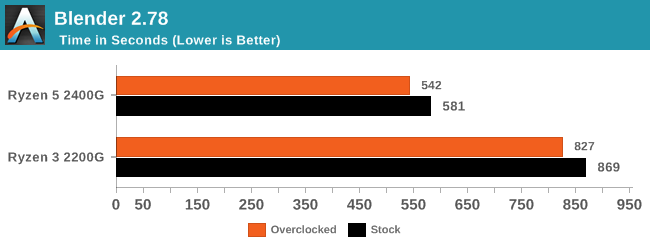
Blender is slightly more consevative, with a 7% increase in performance.
Compression – WinRAR 5.0.1: link
Our WinRAR test from 2013 is updated to the latest version of WinRAR at the start of 2014. We compress a set of 2867 files across 320 folders totaling 1.52 GB in size – 95% of these files are small typical website files, and the rest (90% of the size) are small 30-second 720p videos.
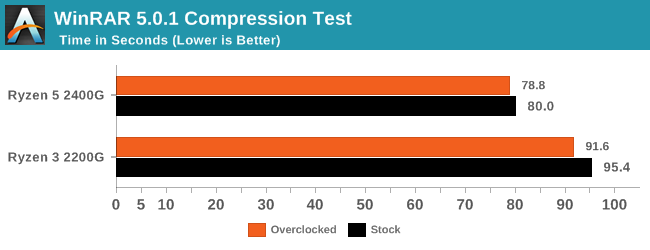
WinRAR is normally memory dependent here, but something else seems to be the bottleneck.
Synthetic – 7-Zip 9.2: link
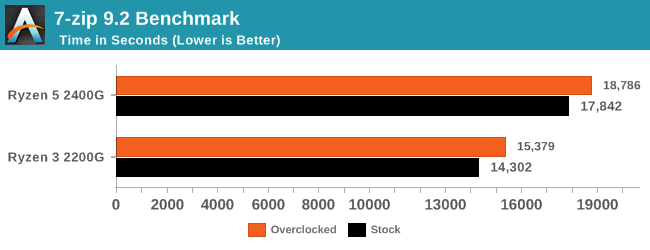
As an open source compression tool, 7-Zip is a popular tool for making sets of files easier to handle and transfer. The software offers up its own benchmark, to which we report the result.
Point Calculations – 3D Movement Algorithm Test: link
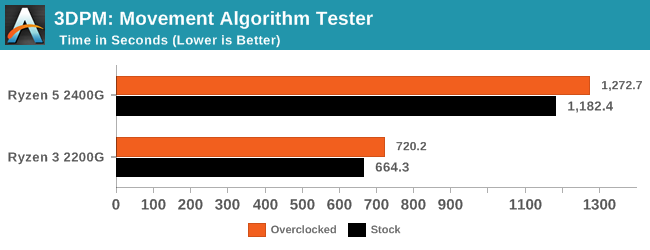
3DPM is a self-penned benchmark, taking basic 3D movement algorithms used in Brownian Motion simulations and testing them for speed. High floating point performance, MHz, and IPC win in the single thread version, whereas the multithread version has to handle the threads and loves more cores. For a brief explanation of the platform agnostic coding behind this benchmark, see my forum post here.
IGP Gaming - Civilization 6
First up in our Ryzen 2000-series APU stock vs overclocked gaming tests is Civilization 6. Originally created by legendary Sid Meier who has a strong lineage in my eyes, mainly thanks to many childhood hours spent on Railroad Tycoon. Civilization 6 continues a long line of previous versions of the Civilization franchise, which has been critically acclaimed for allowing the player to take control of various nations to create their own empire, conquer the world and if you're lucky, watch legendary peace symbol Ghandi declare nuclear war!
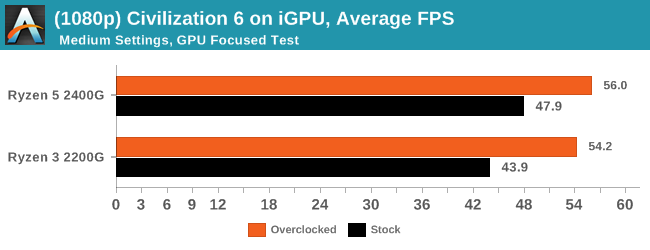
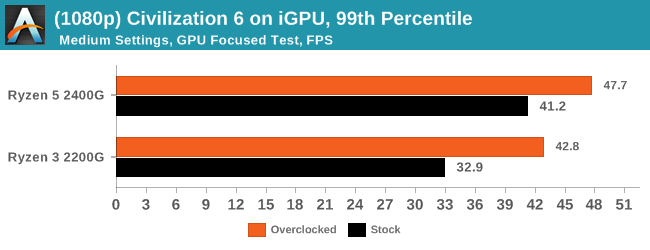
With an overclock on all three major contributing factors to performance on the Ryzen 3 2200G APU, memory, iGPU and CPU frequency, a total increase of around 23% performance in average frame rates was present in Civilization 6 at medium settings at a 1920x1080 resolution. What is most interesting is the 99th percentile frame rates improve by 30%, showing that an average overclock on all three elements can boost performance so well in such a CPU heavy title.
Gaming - Total War: WARHAMMER 2 at 720p
Not only is the Total War franchise one of the most popular real-time tactical strategy titles of all time, but Sega delve into multiple worlds such as the Roman Empire, Napoleonic era and even Attila the Hun, but more recently they nosedived into the world of Games Workshop via the WARHAMMER series. Developers Creative Assembly have used their latest RTS battle title with the much talked about DirectX 12 API, just like the original version, Total War: WARHAMMER, so that this title can benefit from all the associated features that comes with it. The game itself is very CPU intensive and is capable of pushing any top end system to their limits.
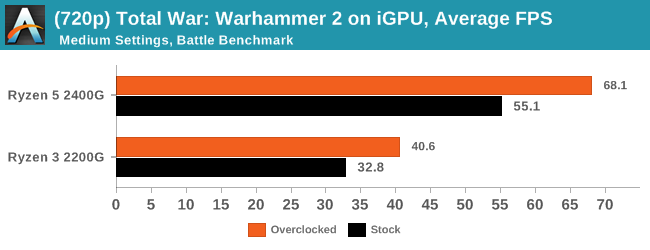
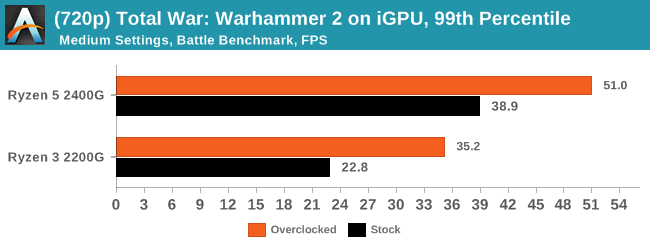
For the 2200G, the most sizable benefit for an overclock was in the lower resolution 99th percentile frame rates - moving from 23 FPS to 35 FPS is a sure-fire way of getting a smoother result.
Gaming - Total War: Warhammer 2 at 1080p
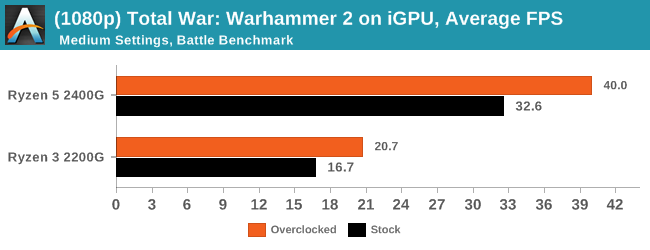
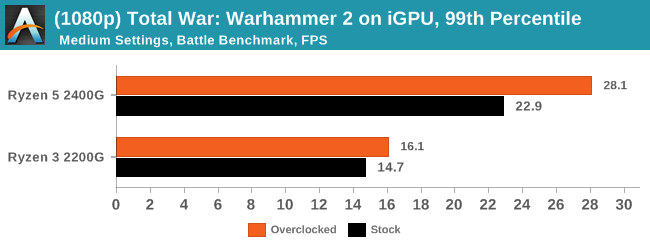
Because of the small numbers, it is perhaps hard to see that the Ryzen 3 2200G gets a 24% increase in 1080p performance. This is carried through with the Ryzen 5 2400G, which gets a 26-31% increase in frame rates and pencentile numbers at both 720p and 1080p.
Discrete Gaming: Shadow of Mordor
The next title in our testing is a battle of system performance with the open world action-adventure title, Middle Earth: Shadow of Mordor (SoM for short). Produced by Monolith and using the LithTech Jupiter EX engine and numerous detail add-ons, SoM goes for detail and complexity. The main story itself was written by the same writer as Red Dead Redemption, and it received Zero Punctuation’s Game of The Year in 2014.
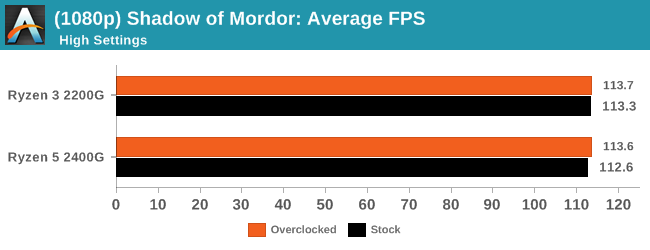
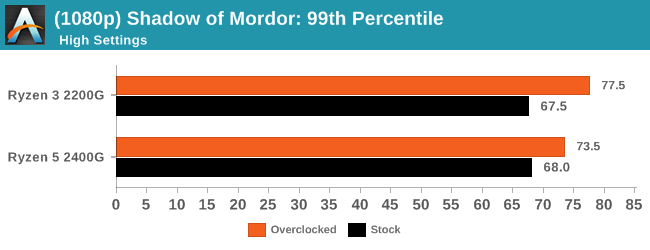
For our discrete gaming titles, it was kind of expected that the average frame rates might not move, but here we see the Ryzen 3 2200G get a nice boost in 99th percentile numbers. Shadow of Mordor, particularly one scene in our test, seems very receptive to quad-core CPUs to the point where any more cores or threads seems to perform worse. We've seen it in other tests, and when overclocked, we see the Ryzen 3 2200G take the lead in the percentile graph.
F1 2017
Released in the same year as the title suggests, F1 2017 is the ninth variant of the franchise to be published and developed by Codemasters. The game is based around the F1 2017 season and has been and licensed by the sports official governing body, the Federation Internationale de l’Automobile (FIA). F1 2017 features all twenty racing circuits, all twenty drivers across ten teams and allows F1 fans to immerse themselves into the world of Formula One with a rather comprehensive world championship season mode.
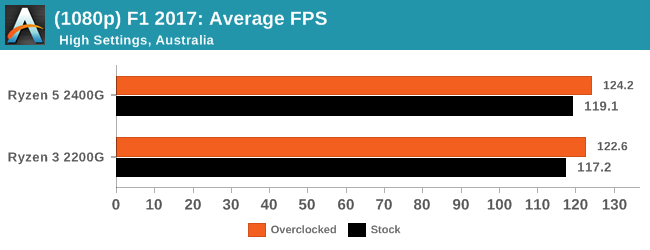
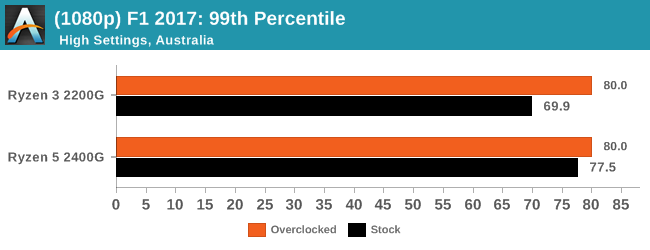
Codemasters' EGO engine has historically been very memory receptive, especially for 99th percentile numbers. Here we see a good jump for the Ryzen 3 2200G again when the system is overclocked.





63 Comments
View All Comments
0ldman79 - Wednesday, April 18, 2018 - link
Setting the multiplier manually automatically disables Cool'n'quiet, can it be reenabled afterwards while keeping the higher multiplier?I plan on overclocking mine the same as my FX 6300, keep Cool'n'quiet, keep turbo and just push it all higher. I like the idle dropping down to nothing and I prefer to keep my turbo so single threaded apps (still have a few) get everything they can possibly get.
gavbon - Wednesday, April 18, 2018 - link
You can re-enable it no problem, I only found it to automatically disable Cool'n'Quiet on MSI boards, there's absolutely nothing stopping you enabling it again :)YoloPascual - Wednesday, April 18, 2018 - link
Should have oced the gpu to 1600 instead of the cpu.krazyfrog - Wednesday, April 18, 2018 - link
Image compression is making my eyes bleed.PeachNCream - Wednesday, April 18, 2018 - link
The images in the article are fine and your eyes are working well enough for you to broadcast your whining to the rest of the world. Besides, the value in the article is in the written content, not the pretty pictures. If you want pictures as the primary content delivery mechanism, go buy a bunch of pre-literacy board books like The Very Hungry Caterpillar.dromoxen - Friday, April 20, 2018 - link
thess were my exact thoughts as many people here ... underclock the CPU and overclock the GPU for gaming (spend your heat budget on the GPU) and then on other tasks overclock the cpu and underclock the gpu) BUT I expect this cannot be done on one windows session . Actually using ryzen Master , it probably could . But youd need some scripts to o switch.If i ever take the plunge (waiting for 4000mhz dram) will examine this...
John_M - Friday, April 20, 2018 - link
A few things trouble me about this article.Firstly, the charts for 7-zip and 3DPM are incorrect. If lower really is better, then they show the stock 2200G outperforming the overclocked 2400G. If they are so blatantly wrong, then can the others be trusted?
Secondly, DDR4 defaults to 2133 MHz (2 x 1066) if you "forget" to enable XMP, not 2400. This is not a good representation of stock RAM frequency. I would have preferred to see you set 2933 MHz, as specified by AMD.
Thirdly, the Thermaltake Floe Riing 360 is an unrealistically expensive choice of cooler for either of those processors. Who spends more on the cooler than on the processor?
Fourthly, you can overclock the iGPU and adjust the SoC voltage in the ASRock UEFI BIOS, but it's rather hidden away!
cpupro - Saturday, April 21, 2018 - link
ASUS have the best looking UEFI.Galatian - Wednesday, April 25, 2018 - link
Thanks for the test, but I hope you will test all parts separately? I mean the FPS increase probably stems from the huge increase from the faster RAM, but you make it sound like the CPU and GPU overclock take equal parts.ballsystemlord - Wednesday, April 25, 2018 - link
Where did you get your data from when you wrote?"ed: I'm in the sliding scale camp, for what it is worth. I find it amusing to note that DRAM bit-errors, unaffected by overclocking, can happen on the scale of one per GB per four years (or less). That's about a worse case scenario, but it translates to about one bit-error per three months in a system with 16GB. that is something that can't be controlled by stability testing. Hopefully it occurs in DRAM that isn't being used."
Thanks!