The Samsung 860 PRO (512GB And 4TB) SSD Review: Replacing A Legend
by Billy Tallis on January 23, 2018 10:00 AM ESTAnandTech Storage Bench - Light
Our Light storage test has relatively more sequential accesses and lower queue depths than The Destroyer or the Heavy test, and it's by far the shortest test overall. It's based largely on applications that aren't highly dependent on storage performance, so this is a test more of application launch times and file load times. This test can be seen as the sum of all the little delays in daily usage, but with the idle times trimmed to 25ms it takes less than half an hour to run. Details of the Light test can be found here. As with the ATSB Heavy test, this test is run with the drive both freshly erased and empty, and after filling the drive with sequential writes.
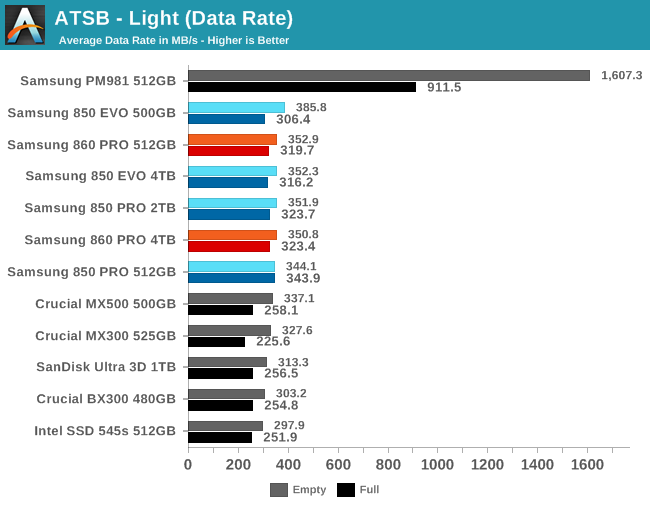
The Samsung SATA drives can mostly be distinguished from the other SATA drives by how much of their performance they retain when full; most of the competing drives show a bigger relative drop in average data rate. Between the Samsung drives, the differences are insignificant, and the peak performance of the competitors is pretty close to that of the Samsung drives.
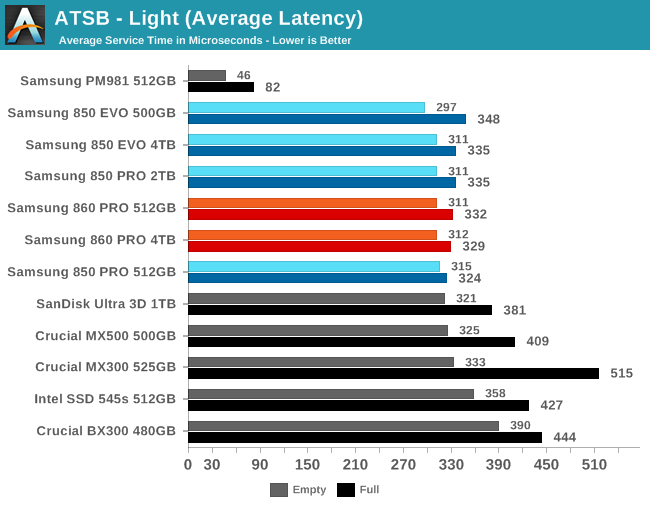
The average and 99th percentile latency scores on the Light test show that most of these SATA drives perform almost identically, but the 860 PROs have smaller full-drive performance hits than the other drives.
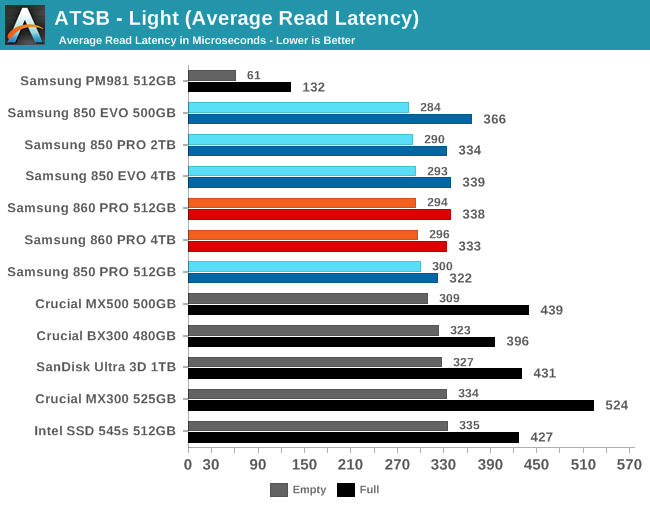
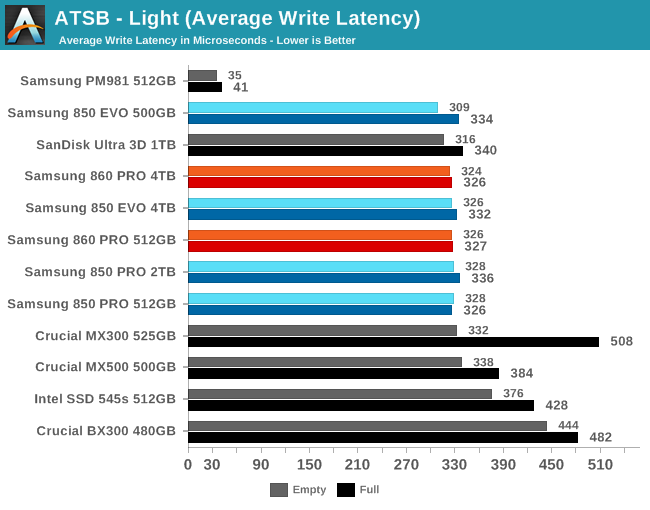
The average read latencies on the Light test tend to be a bit lower than the write latencies when the test is run on an empty drive, but when the drives are full, the read latencies climb to be slightly higher than the write latencies. The Samsung SATA SSDs all show smaller performance hits from being full than most of the competing SATA SSDs.
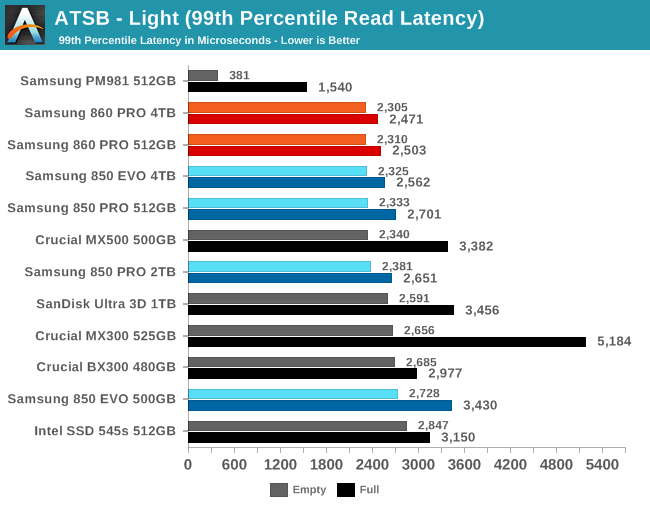
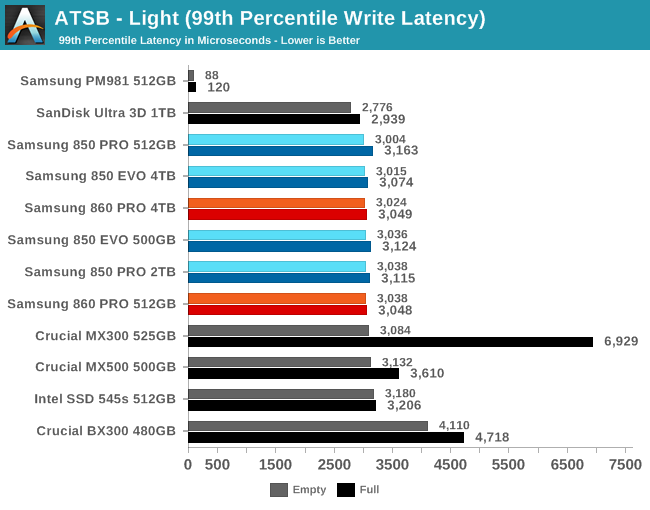
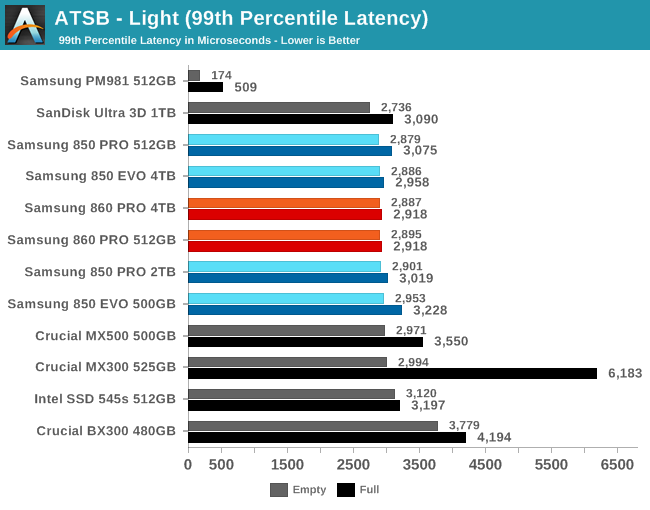
The 99th percentile read latencies are in the 2-3ms range and the 99th percentile write latencies hover right around 3ms. The Crucial drives provide the biggest outliers, but even the 5-6ms response times of the MX300 aren't bad as a worst-case performance measure.
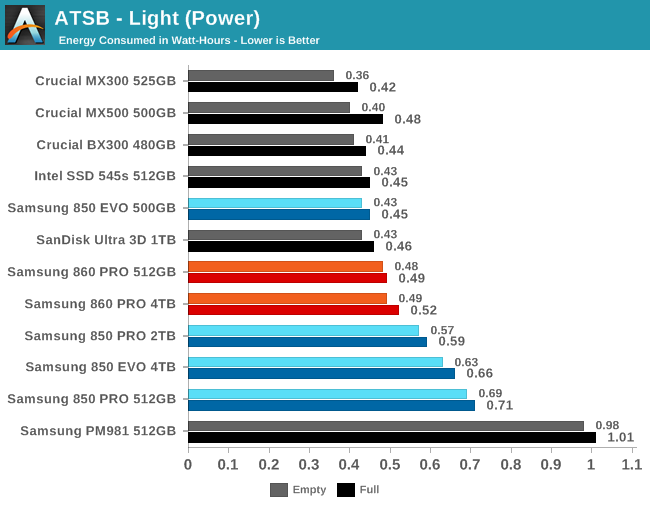
The 500 GB Samsung 850 EVO is once again the most efficient Samsung drive while the 860 PROs improve upon the poor efficiency of the 850 PROs but don't entirely catch up to the competition.


64 Comments
View All Comments
MayDayComputers - Wednesday, January 24, 2018 - link
It wakes up in 8 milliseconds. The graph is in nanoseconds.MayDayComputers - Wednesday, January 24, 2018 - link
Yikes. Actually I was off, it wakes up in 8 nanoseconds, not milliseconds. Even at 8 milliseconds, you would never notice. This is 1000x faster than that.“A microsecond is equal to 1000 nanoseconds or 1/1,000 milliseconds. ” -source Wikipedia
stux - Saturday, February 17, 2018 - link
Actually a million times faster.letmepicyou - Wednesday, January 24, 2018 - link
So...tests were done a while back that showed that 2x 850 EVOs in RAID 0 outperformed a single 850 Pro. The allure of putting 2 500gb EVOs in RAID for $300 and getting better performance than a single PRO 1TB for $450 was a no-brainer IMO, and boy does it scoot. My question is, what do RAID numbers look for the new 860's? Will it still make sense to RAID the EVO's? Or will the 860 series price/perf/space metric slant more towards the single PRO drive?BurntMyBacon - Wednesday, January 24, 2018 - link
Given that the 860 Pro struggles to distance itself from its EVO counterpart in a straight up comparison, I think its safe to say 2x860EVO will outperform 1x860PRO in the same metrics that 2x850EVO outperforms 1x850PRO. Also, MSRP shows 2x860EVO 500GB costing $340 vs $480 for the 1TB 860PRO. Your price/perf/space metric will not be slanting towards the PRO drive.Luckz - Monday, May 14, 2018 - link
SATA SSD RAID0 only makes sense if you need 'left to right copying' and can't do NVMe (which is much faster).Roen - Monday, January 29, 2018 - link
I'd like to see what Enterprise SATA / SAS SSDs the author has in mind that is a better balance of specs and price, especially price.The cheapest Seagate Nytro SAS SSD I've found with 1700 / 850 Sustained R/W is > $1500.
peevee - Tuesday, January 30, 2018 - link
There is absolutely no point paying twice as much compared to other drives.JokerzWild - Sunday, February 11, 2018 - link
Good review, but it seems like there’s a “missing link” in the data presented. You mention in the Introduction that you are using a 512GB 850 PRO from, “the original generation using 32L 3D NAND and LPDDR2 DRAM, rather than the updated model with 48L 3D NAND and LPDDR3.” You also say that you are using the test results from the 2TB 850 Pro review, which I believe still used Samsung’s 2nd-generation (32L) 3D MLC NAND with LPDDR3 in the controller rather than their 3rd-generation (48L) product. I can’t tell which version of the 500GB 850 EVO is being presented for this review, but I suspect it is V1 as well based on its power usage compared to the 4TB 850 EVO (which was offered in V2 only) numbers. In your recent reviews of other current SSDs (e.g. the SanDisk Ultra 3D and the Crucial MX500) it also appears that you are using the 32L/LPDDR2 versions (which I’ll call V1) rather than the 48L/LPDDR3 (V2) iterations of the 850 PRO and EVO.Would you please add the data for 850 EVO/PRO V2s to your test results? Alternatively, it would be interesting to see an article that looks at the progress of Samsung’s NAND and controllers in V1 (32L/LPDDR2) and V2 (48L/LPDDR3) of the 850 EVOs and PROs along with the 860s (64L/LPDDR4), preferably in the 1TB configuration since that configuration seems to yield the highest overall performance (at least in the 850s) and is a popular choice. I’ve seen a couple of articles that compared V1 and V2 of the 850 EVO, and it appeared that both performance and power consumption improved in V2. I have yet to seen any comparison of V1 and V2 of the 850 PRO. I seem to also recall reading that Samsung was claiming a 30% reduction in power consumption was one of the benefits in switching from its 2nd-generation to its 3rd-generation NAND, which would wipe out most of the power management gains claimed for the 860 PRO. The changes between V1 and V2 of the 850s appear just as significant as the changes between 850 V2s and the 860s (1 generation DRAM, +16L each), so why not add this data to the mix? Using V1 of the 850s probably overstates the differences between a recent 850 EVO/PRO and an 860 EVO/PRO. Presenting data on V2 of the 850s would also give users of 850 V2s a better idea of what they may be missing. It would also help bargain hunters who want that last little bit of performance from a top performing SATA drive decide if it’s better to buy a marked down 850 or a new 860 for their use cases.
Lady Fitzgerald - Tuesday, March 13, 2018 - link
SATA will be around for a long time, most likely well past 5 years from now. It's plenty fast for storage. Not everyone needs blazing speed for storing music, videos, documents, pictures, etc.