The ASRock Fatal1ty X299 Professional Gaming i9 Motherboard Review
by Joe Shields on September 26, 2017 8:00 AM EST- Posted in
- Motherboards
- Gaming
- Intel
- ASRock
- SLI
- Fatal1ty
- CrossFire
- X299
- Skylake-X
- Kaby Lake-X
CPU Performance, Short Form
For our motherboard reviews, we use our short form testing method. These tests usually focus on if a motherboard is using MultiCore Turbo (the feature used to have maximum turbo on at all times, giving a frequency advantage), or if there are slight gains to be had from tweaking the firmware. We leave the BIOS settings at default except for the memory, which is run at the maximum supported processor (Intel defined) frequency for these tests, making it very easy to see which motherboards have MCT enabled by default.
Blender 2.78: link
For a render that has been around for what seems like ages, Blender is still a highly popular tool. We managed to wrap up a standard workload into the February 5 nightly build of Blender and measure the time it takes to render the first frame of the scene. Being one of the bigger open source tools out there, it means both AMD and Intel work actively to help improve the codebase, for better or for worse on their own/each other's microarchitecture.
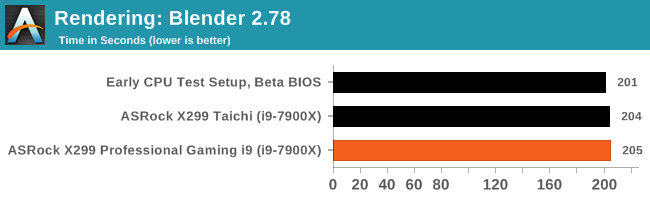
Our Blender rendering results are all close together with 4 seconds, or 2% difference between the quickest render and longest. The Gaming i9 is actually slowest of the group here with a 205 second run, but all within the margin of error.
Rendering – POV-Ray 3.7: link
The Persistence of Vision Ray Tracer, or POV-Ray, is a freeware package for as the name suggests, ray tracing. It is a pure renderer, rather than modeling software, but the latest beta version contains a handy benchmark for stressing all processing threads on a platform. We have been using this test in motherboard reviews to test memory stability at various CPU speeds to good effect – if it passes the test, the IMC in the CPU is stable for a given CPU speed. As a CPU test, it runs for approximately 2-3 minutes on high end platforms.
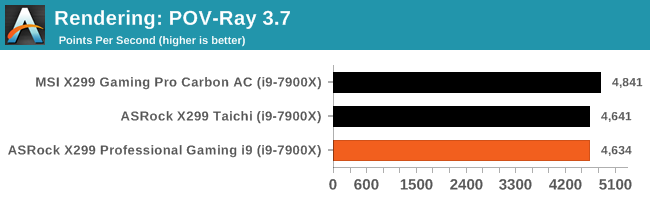
Moving on to rendering and POV-Ray 3.7, the Gaming i9 is the slowest of the bunch, but not by a large margin. Both it, and the Taichi are well within a run variance difference away at 4,634 and 4,641 respectively. The Gaming Pro Carbon AC scored 4,841, about 4% faster, due to the way it implements a higher multi-core turbo.
Compression – WinRAR 5.4: link
Our WinRAR test from 2013 is updated to the latest version of WinRAR at the start of 2014. We compress a set of 2867 files across 320 folders totaling 1.52 GB in size – 95% of these files are small typical website files, and the rest (90% of the size) are small 30 second 720p videos.
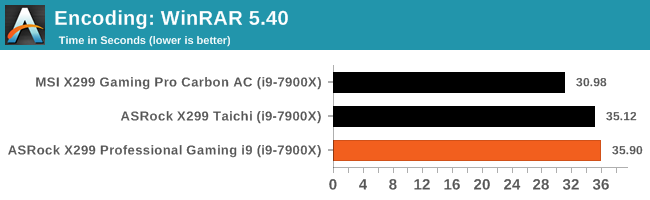
The Fatal1ty X299 Professional Gaming i9 compressed our files the slowest at 35.9 seconds. The Taichi was a bit faster at 35.1 seconds while the Gaming Pro Carbon AC leads the pack at almost 31 seconds; almost 5 seconds (~14%) quicker. Again, this comes down to implementation of turbo modes.
Synthetic – 7-Zip 9.2: link
As an open source compression tool, 7-Zip is a popular tool for making sets of files easier to handle and transfer. The software offers up its own benchmark, to which we report the result.
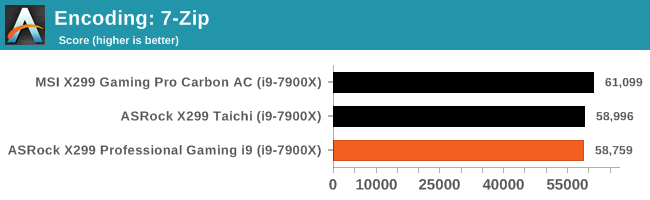
Our 7-Zip results tell a similar tale here with both ASRock boards performing incredibly close to each other, while the Gaming Pro Carbon AC pulls away slightly. In this case, it is around 4% faster.
Point Calculations – 3D Movement Algorithm Test: link
3DPM is a self-penned benchmark, taking basic 3D movement algorithms used in Brownian Motion simulations and testing them for speed. High floating point performance, MHz and IPC wins in the single thread version, whereas the multithread version has to handle the threads and loves more cores. For a brief explanation of the platform agnostic coding behind this benchmark, see my forum post here.
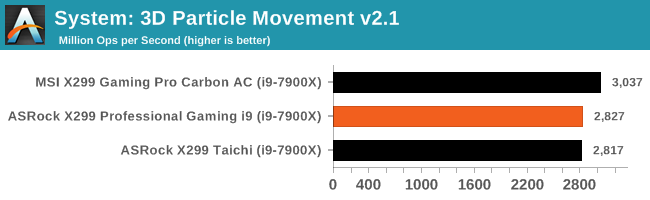
In our 3DPM tests, the Gaming i9 landed in the middle of the pack with its 2,827 score, very close to the Taichi; less than half a percent away in fact. Only the Gaming Pro Carbon AC shows a significant different here scoring nearly 200 points higher, again due to the enhanced turbo out-of-the-box of the MSI board.
Neuron Simulation - DigiCortex v1.20: link
The newest benchmark in our suite is DigiCortex, a simulation of biologically plausible neural network circuits, and simulates activity of neurons and synapses. DigiCortex relies heavily on a mix of DRAM speed and computational throughput, indicating that systems which apply memory profiles properly should benefit and those that play fast and loose with overclocking settings might get some extra speed up. Results are taken during the steady state period in a 32k neuron simulation, and represented as a function of the ability to simulate in real time (1.000x equals real-time).
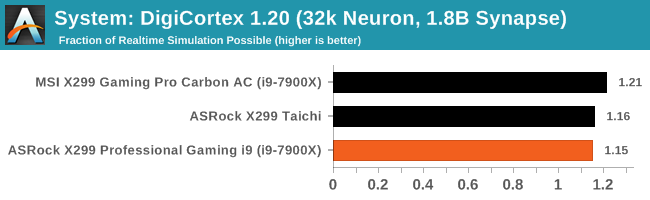
The X299 Professional Gaming i9 managed to score the lowest in this test, at 1.15x realtime. The Taichi managed to be a bit faster at 1.16 while the MSI Gaming Pro Carbon was the best of the bunch at 1.21x. Soon we will have more boards tested see if they land closer to the Carbon or ASRock boards.


22 Comments
View All Comments
Gothmoth - Friday, September 29, 2017 - link
https://www.youtube.com/watch?v=osSMJRyxG0kif you want to know why websites and bloggers who rely on advertising review so much intel stuff but mostly ignore AMD.