The Intel SSD 545s (512GB) Review: 64-Layer 3D TLC NAND Hits Retail
by Billy Tallis on June 27, 2017 6:00 AM ESTBAPCo SYSmark 2014 SE
BAPCo's SYSmark 2014 SE is an application-based benchmark that uses real-world applications to replay usage patterns of business users in the areas of office productivity, media creation and data/financial analysis. In addition, it also addresses the responsiveness aspect which deals with user experience as related to application and file launches, multi-tasking etc. Scores are calibrated against a reference system that is defined to score 1000 in each of the scenarios. A score of, say, 2000, would imply that the system under test is twice as fast as the reference system.
SYSmark scores are based on total application response time as seen by the user, including not only storage latency but time spent by the processor. This means there's a limit to how much a storage improvement could possibly increase scores, because the SSD is only in use for a small fraction of the total test duration. This is a significant difference from our ATSB tests where only the storage portion of the workload is replicated and disk idle times are cut short to a maximum of 25ms.
| AnandTech SYSmark SSD Testbed | |
| CPU | Intel Core i5-7400 |
| Motherboard | ASUS B250-PLUS |
| Chipset | Intel B250 |
| Memory | 2x 8GB Kingston DDR4-2400 CL17 |
| Case | In Win C583 |
| Power Supply | Cooler Master G550M |
| OS | Windows 10 64-bit, version 1703 |
Our SSD testing with SYSmark uses a different test system than the rest of our SSD tests. This machine is set up to measure total system power consumption rather than just the drive's power.
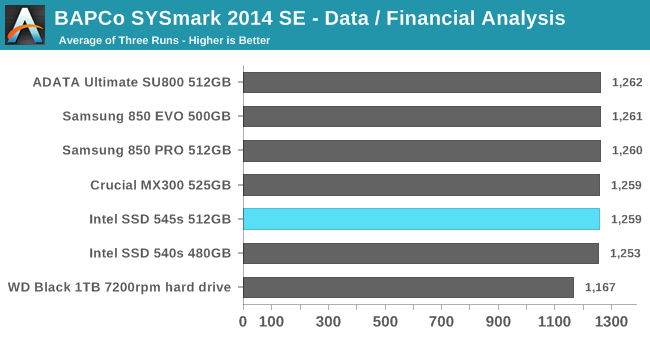
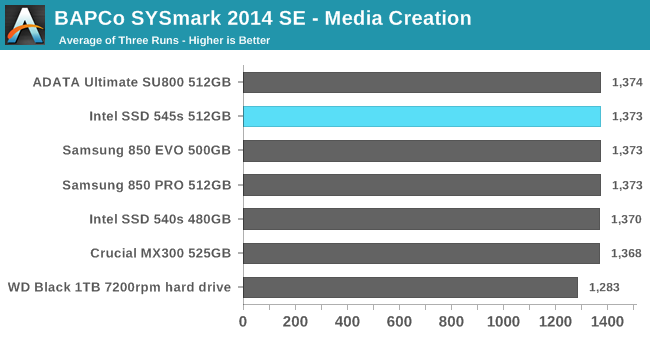
The SYSmark performance scores for data analysis and media creation are relatively insensitive to storage performance, as shown by our test system's score with a mechanical hard drive exceeding the normalized score of 1000 for the SYSmark reference system that uses a SSD and coming relatively close to the performance of our SSDs. The differences between these SATA SSDs are all within the variation between runs.

The office productivity test also shows very little dependence on storage performance, but the gap between the SSDs and the hard drive is a bit wider than for the first two usage scenarios, and the hard drive's detrimental impact on performance was enough to offset the CPU and RAM advantages our testbed has relative to the SYSmark 2014 SE reference system.
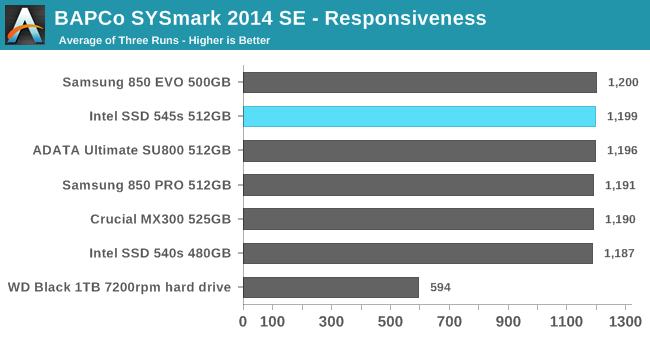
The SYSmark responsiveness benchmark is the most sensitive to storage performance, and all of the SATA SSDs are about twice as fast as the mechanical hard drive. The difference between SSDs is just barely larger than the variation between test runs, but it's enough that the slowest of the three runs for the 545s was faster than the fastest of the three runs for the Intel 540s.
Energy Usage
The SYSmark energy usage scores measure total system power consumption, excluding the display. Our SYSmark test system idles at around 26 W and peaks at over 60 W measured at the wall during the benchmark run. SATA SSDs seldom exceed 5 W and idle at a fraction of a watt, and the SSDs spend most of the test idle. This means the energy usage scores will inevitably be very close. A typical notebook system will tend to be better optimized for power efficiency than this desktop system, so the SSD would account for a much larger portion of the total and the score difference between SSDs would be more noticeable.
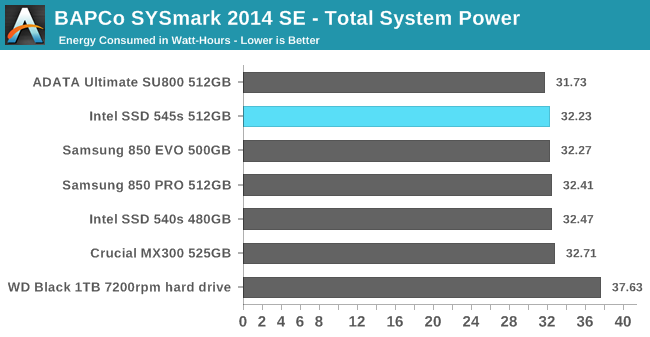
Rather than judging these scores by their percentage difference, it's probably more useful to consider the raw number of Watt-hours saved by using a more efficient SSD. The difference here between the best and worst SSD is just under 1 Wh, compared to a typical ultrabook battery capacity of around 50 Wh. Since the overall performance scores with each SSD were so close together, we know that the test runs took essentially the same amount of time and the differences in energy usage are due mostly to differences in the idle power consumption of the SSDs.


74 Comments
View All Comments
t.s - Tuesday, June 27, 2017 - link
But of course, "If you want to play it safe", you could always go for the intel 545s /sDanNeely - Tuesday, June 27, 2017 - link
What happened to the performance consistency testing?Ryan Smith - Tuesday, June 27, 2017 - link
It's coming. But we had a rather short period of time to work on this."This launch comes at a bit of an awkward time for us. I've retired our aging 2015 SSD testbed and moved all the custom and homemade power measurement equipment over to a new system. Windows 8.1 is out and Windows 10 is in, and our IOmeter synthetic benchmarks are being replaced with Linux-based FIO tests that are more suited to modern TLC SSDs with SLC caches. For the past few weeks I've been focusing my efforts on validating the new testbed and test suite against NVMe SSDs, so the arrival at short notice of a new SATA SSD left me with no relevant comparison data."
Billy Tallis - Tuesday, June 27, 2017 - link
I didn't have time. I'll be doing it later this week. The new 2017 performance consistency test will be more thorough about testing different overprovisioning amounts, but that also makes it take longer to run.jjj - Tuesday, June 27, 2017 - link
The only interesting part is the rushed launch.Is anything much better about to hit the market or is Intel just trying to ship some more NAND in Q2 to "fix" the results? I suppose the Crucial BX300 is due in a couple of weeks, anything else?
Billy Tallis - Tuesday, June 27, 2017 - link
Intel wanted to beat WD and Toshiba to market with 64-layer 3D NAND. The Toshiba XG5 is already in the hands of OEMs but I'm not aware of any systems shipping with it yet. WD's 3D NAND SSDs are set to ship in Q3. They're all likely to have more powerful controllers than SM2259, and their charge trap flash cell architecture is closer to Samsung's V-NAND than IMFT 3D floating gate. Intel's right to want to be ahead of the others, but I think they could have spared another week.jjj - Tuesday, June 27, 2017 - link
Another week is no good, July 4th compromises the entire week.I was thinking more about value than perf when it comes to beating other new prods but chances are it is also about Q2 results, they want to boost the NAND segment a bit.
Do you have the Toshiba XG5 for review?
Billy Tallis - Tuesday, June 27, 2017 - link
Yes, the XG5 is what got bumped off the testbed to make room for these SATA drives. I'll be switching the testbed back to PCIe drives in a few days, after finishing up a few more tests on this batch of SATA drives.jjj - Tuesday, June 27, 2017 - link
Looking forward to that one.With the new tests, do you still look at mixed workloads?
Billy Tallis - Tuesday, June 27, 2017 - link
Yes. I'm not planning huge changes to the mixed workload tests, other than testing at 10% increments instead of 20%. My biggest goal with the new test suite is to have things more automated, which makes it easy to increase the level of detail in a lot of the tests (but it also makes it too easy to make the test suite take forever to run).