The Intel Kaby Lake-X i7 7740X and i5 7640X Review: The New Single-Threaded Champion, OC to 5GHz
by Ian Cutress on July 24, 2017 8:30 AM EST- Posted in
- CPUs
- Intel
- Kaby Lake
- X299
- Basin Falls
- Kaby Lake-X
- i7-7740X
- i5-7640X
Benchmarking Performance: CPU Rendering Tests
Rendering tests are a long-time favorite of reviewers and benchmarkers, as the code used by rendering packages is usually highly optimized to squeeze every little bit of performance out. Sometimes rendering programs end up being heavily memory dependent as well - when you have that many threads flying about with a ton of data, having low latency memory can be key to everything. Here we take a few of the usual rendering packages under Windows 10, as well as a few new interesting benchmarks.
All of our benchmark results can also be found in our benchmark engine, Bench.
Corona 1.3: link
Corona is a standalone package designed to assist software like 3ds Max and Maya with photorealism via ray tracing. It's simple - shoot rays, get pixels. OK, it's more complicated than that, but the benchmark renders a fixed scene six times and offers results in terms of time and rays per second. The official benchmark tables list user submitted results in terms of time, however I feel rays per second is a better metric (in general, scores where higher is better seem to be easier to explain anyway). Corona likes to pile on the threads, so the results end up being very staggered based on thread count.
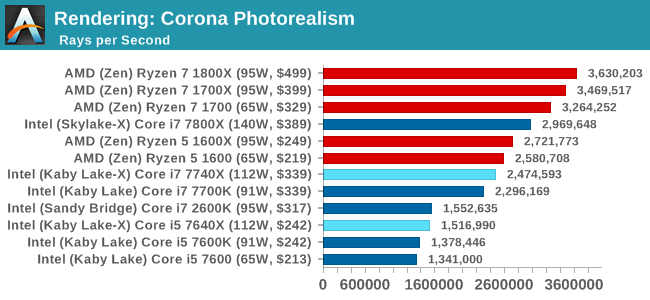
More threads win the day, although the Core i7 does knock at the door of the Ryzen 5 (presumably with $110 in hand as well). It is worth noting that the Core i5-7640X and the older Core i7-2600K are on equal terms.
Blender 2.78: link
For a render that has been around for what seems like ages, Blender is still a highly popular tool. We managed to wrap up a standard workload into the February 5 nightly build of Blender and measure the time it takes to render the first frame of the scene. Being one of the bigger open source tools out there, it means both AMD and Intel work actively to help improve the codebase, for better or for worse on their own/each other's microarchitecture.
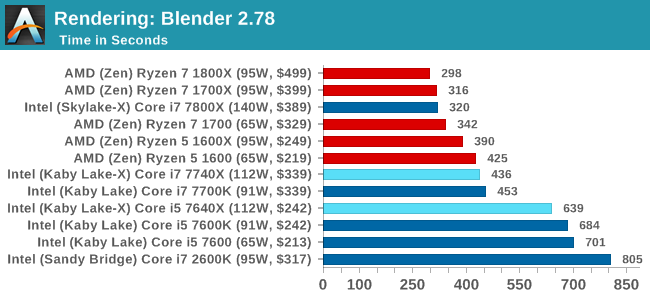
Similar to Corona, more threads means a faster time.
LuxMark v3.1: Link
As a synthetic, LuxMark might come across as somewhat arbitrary as a renderer, given that it's mainly used to test GPUs, but it does offer both an OpenCL and a standard C++ mode. In this instance, aside from seeing the comparison in each coding mode for cores and IPC, we also get to see the difference in performance moving from a C++ based code-stack to an OpenCL one with a CPU as the main host.
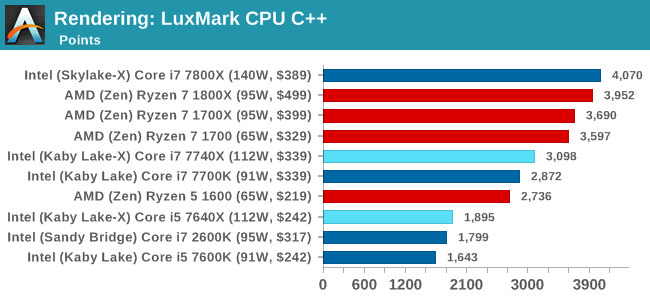
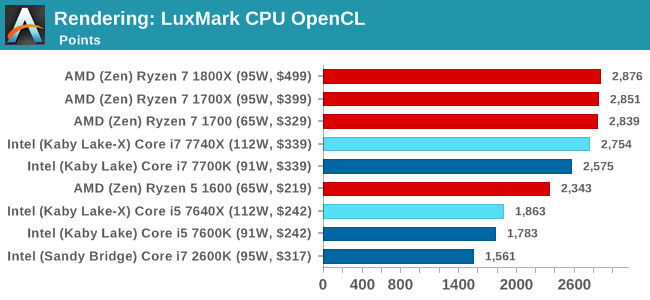
Luxmark is more thread and cache dependent, and so the Core i7 nips at the heels of the AMD parts with double the threads. The Core i5 sits behind the the Ryzen 5 parts though, due to the 1:3 thread difference.
POV-Ray 3.7.1b4: link
Another regular benchmark in most suites, POV-Ray is another ray-tracer but has been around for many years. It just so happens that during the run up to AMD's Ryzen launch, the code base started to get active again with developers making changes to the code and pushing out updates. Our version and benchmarking started just before that was happening, but given time we will see where the POV-Ray code ends up and adjust in due course.
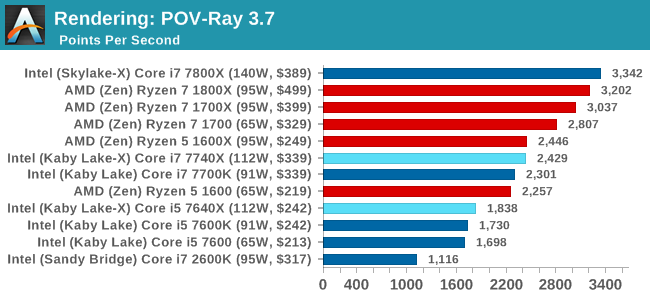
Mirror Mirror on the wall...
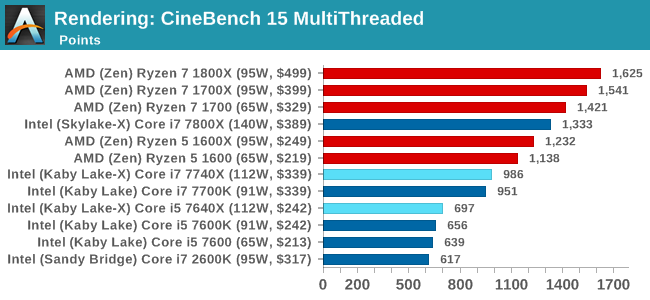
Cinebench R15: link
The latest version of CineBench has also become one of those 'used everywhere' benchmarks, particularly as an indicator of single thread performance. High IPC and high frequency gives performance in ST, whereas having good scaling and many cores is where the MT test wins out.
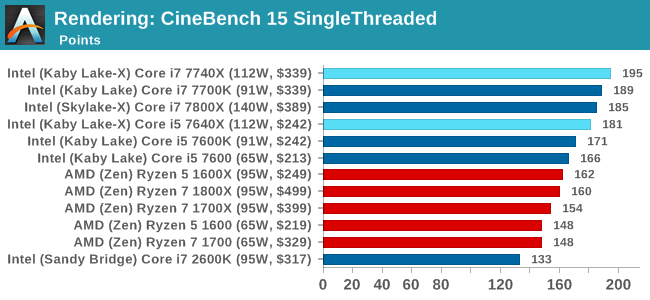
CineBench gives us singlethreaded numbers, and it is clear who rules the roost, almost scoring 200. The Core i7-2600K, due to its lack of instruction support, sits in the corner.


176 Comments
View All Comments
Ian Cutress - Monday, July 24, 2017 - link
In the way everyone has historically been reporting PCIe lanes, Ryzen only has 16 PCIe lanes intended for graphics, with the other four for the chipset and another four for storage as an SoC. We've repeated this over and over and over again. Same with Threadripper: 60, plus four for chipset. If we're going to start counting PCIe lanes for chipsets (and DMI equivalents) and SoC related PCIe lanes for storage and others, we'll have to go and rewrite the PCIe lane counts for the last several generations of Intel and AMD CPUs.Kalelovil - Monday, July 24, 2017 - link
If the category is PCIe lanes for graphics that is quite right.But by that token doesn't (non cut-down) Broadwell-E/Skylake-E only have 32 lanes intended for graphics, as the switching logic allows for 2x16 and 4x8 configurations.
Although this is getting quite in-the-weeds. Overall I really appreciate the time and effort put into PC component reviews by the Anandtech staff.
FreckledTrout - Monday, July 24, 2017 - link
I agree with Ian as 4 PCIe lanes are always taken since you are running Ryzen with a chipset with no real way around that. I also would agree with say Skylake-x reporting 4 less PCIe lanes for the DMI link.Trenteth - Wednesday, July 26, 2017 - link
except Ryzen has 16x GPU lanes, $x to the chipset and 4x diect to an NVMe or U.2 drive. it's 20 PCIe 3.0 lanes off the CPU usable.Notmyusualid - Tuesday, July 25, 2017 - link
I got 40 lanes on my E5-2690.I'm running 4x 1070s on that, and PCIe based storage, and I doubled my throughput by moving the SSD to a riser card (until the 4th GPU went in), which means its back on the m/b.
Though, you can't notice in everyday use. Oddly.
Trenteth - Wednesday, July 26, 2017 - link
Having the 4x PCIe 3.0 lanes for a NVMe drive is an advantage, it's connected directly to the CPU and bypasses the chipset link which allows more bandwidth for USB/PCIe 2.0 lanes and SATA. I don't agree with you on not counting them.Kalelovil - Monday, July 24, 2017 - link
Your charts seem to label the i7 7740X with a $329 MSRP.In contrast your first page (and Intel ARK) lists a $339-$350 MSRP.
I assume the former is a mistake?
Ian Cutress - Monday, July 24, 2017 - link
$339 is the 1k tray price - the one that Intel quotes in the price lists and applicable if you buy 1000 OEM CPUs. $350 is MSRP that retailers will apply from their stock from distributors. Add more if you want a cooler. The issue here is that sometimes Intel never quotes an MSRP for some OEM-only processors, and AMD never seem to quote tray/OEM prices for retail parts. I'll edit this and make it clearer.Kalelovil - Monday, July 24, 2017 - link
Oh, by former I was referring to the $329 in your charts not the $339 on ARKIan Cutress - Monday, July 24, 2017 - link
Oops, I misread the price and misread your comment. Graphs should be updated with a cache refresh.