The Intel Kaby Lake-X i7 7740X and i5 7640X Review: The New Single-Threaded Champion, OC to 5GHz
by Ian Cutress on July 24, 2017 8:30 AM EST- Posted in
- CPUs
- Intel
- Kaby Lake
- X299
- Basin Falls
- Kaby Lake-X
- i7-7740X
- i5-7640X
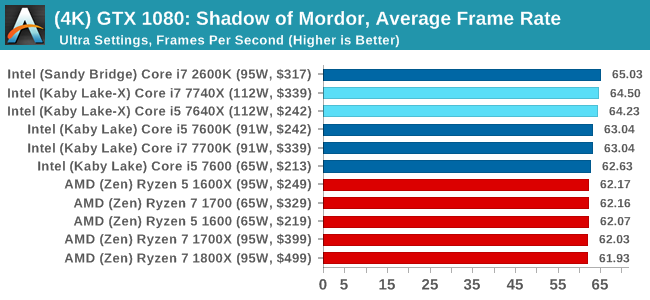
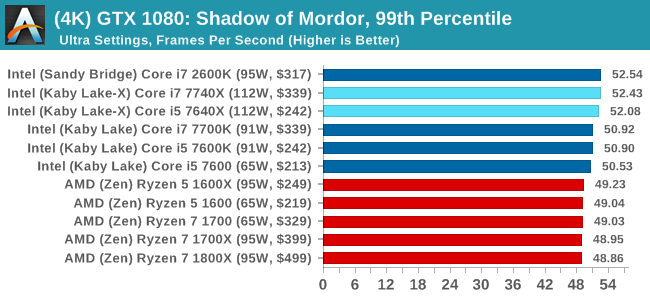
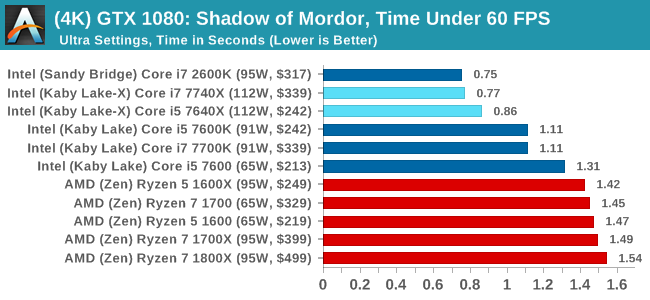
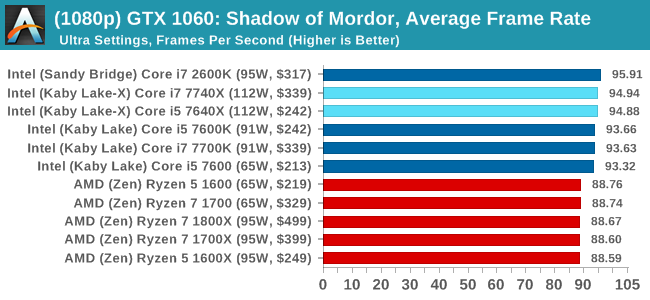
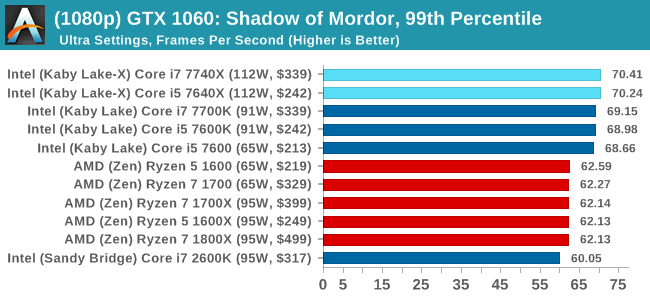
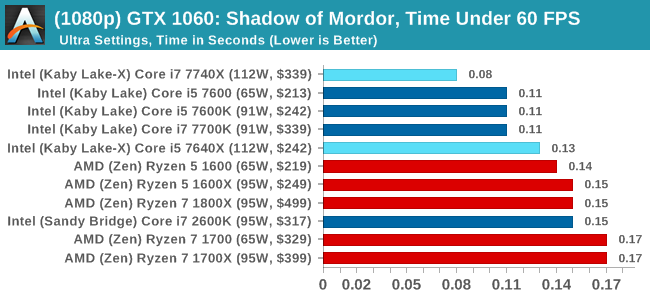
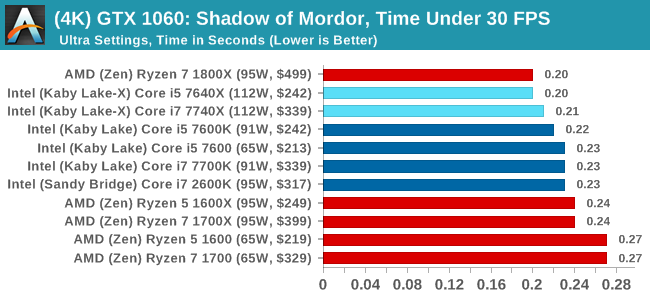
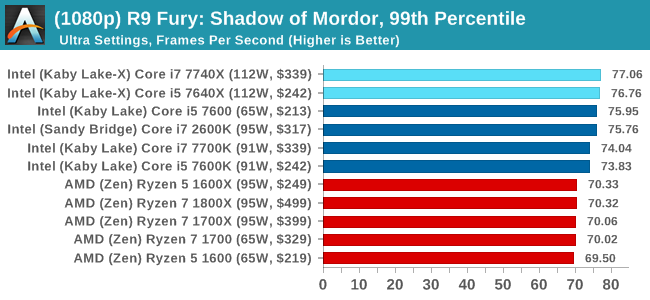
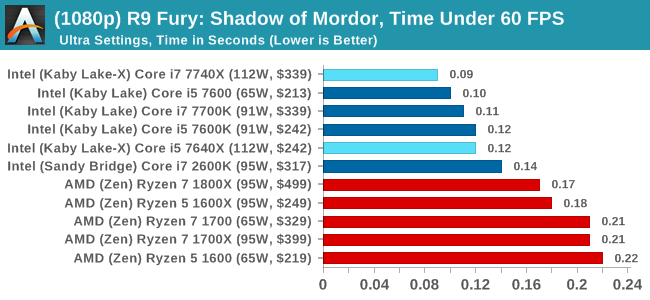
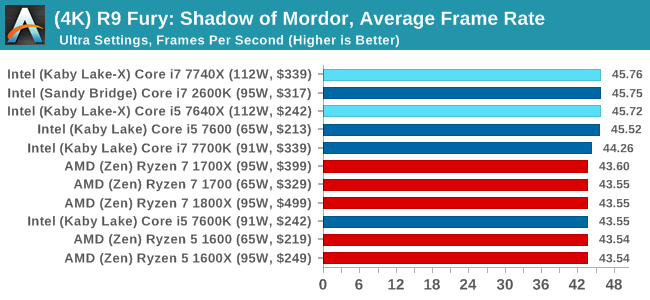
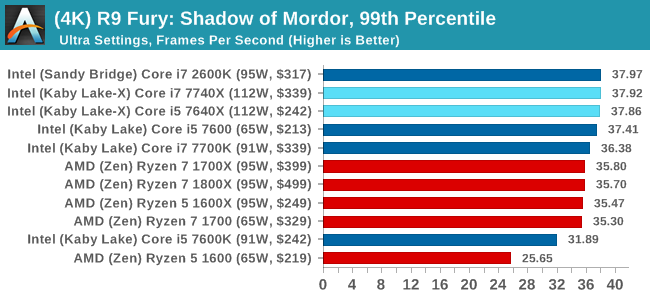
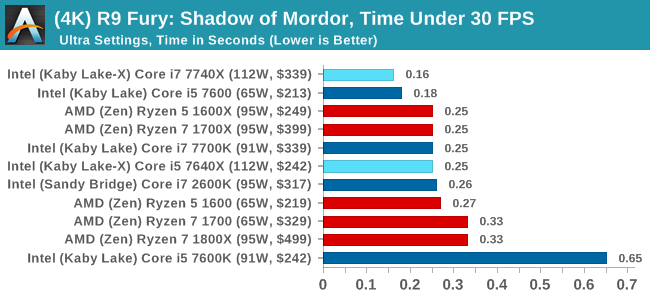
Shadow of Mordor
The next title in our testing is a battle of system performance with the open world action-adventure title, Middle Earth: Shadow of Mordor (SoM for short). Produced by Monolith and using the LithTech Jupiter EX engine and numerous detail add-ons, SoM goes for detail and complexity. The main story itself was written by the same writer as Red Dead Redemption, and it received Zero Punctuation’s Game of The Year in 2014.

A 2014 game is fairly old to be testing now, however SoM has a stable code and player base, and can still stress a PC down to the ones and zeroes. At the time, SoM was unique, offering a dynamic screen resolution setting allowing users to render at high resolutions that are then scaled down to the monitor. This form of natural oversampling was designed to let the user experience a truer vision of what the developers wanted, assuming you had the graphics hardware to power it but had a sub-4K monitor.
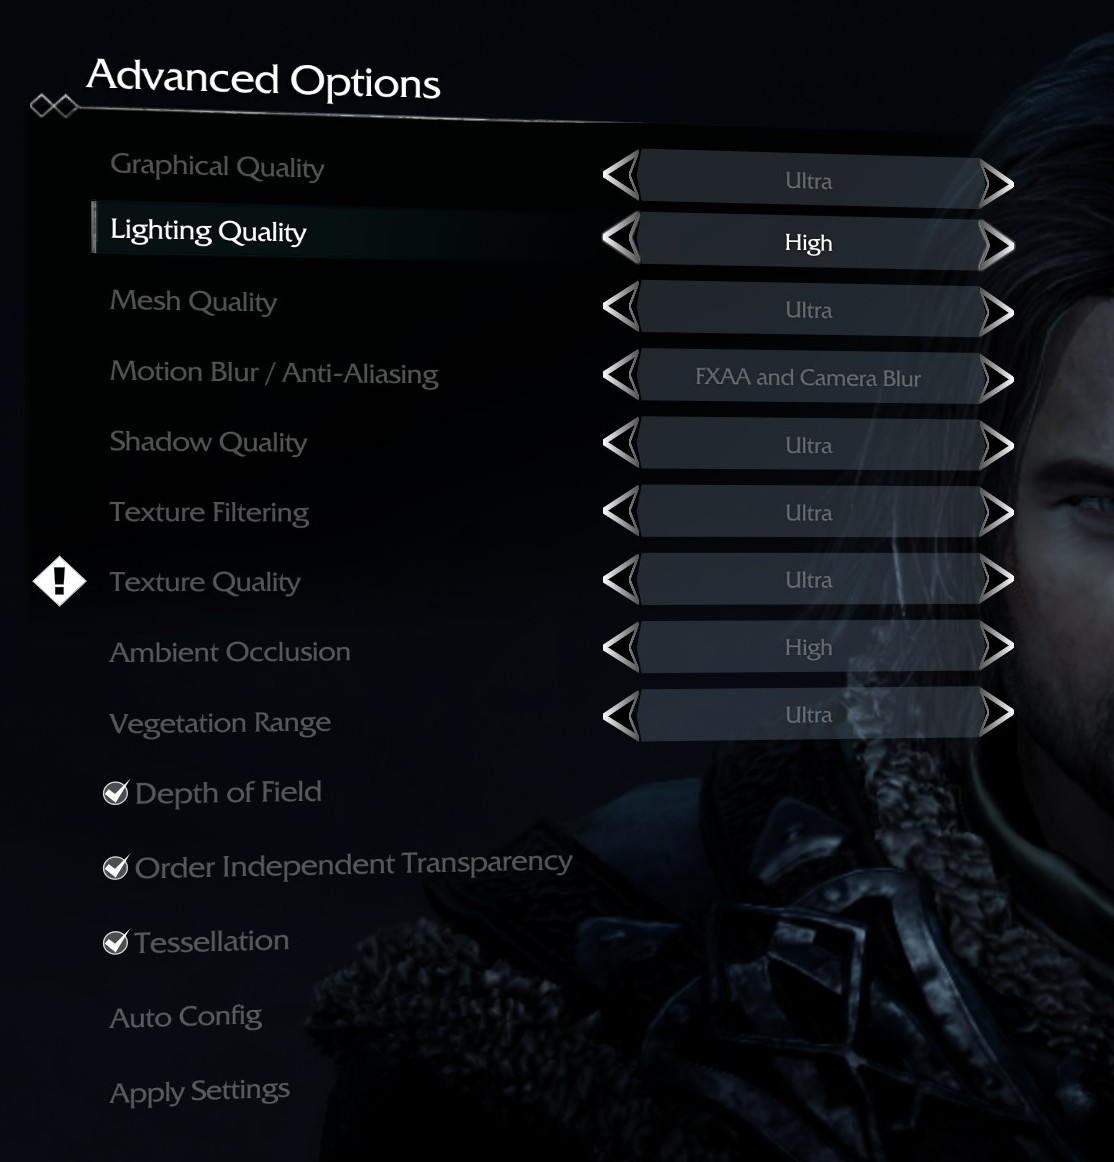
The title has an in-game benchmark, for which we run with an automated script implement the graphics settings, select the benchmark, and parse the frame-time output which is dumped on the drive. The graphics settings include standard options such as Graphical Quality, Lighting, Mesh, Motion Blur, Shadow Quality, Textures, Vegetation Range, Depth of Field, Transparency and Tessellation. There are standard presets as well.
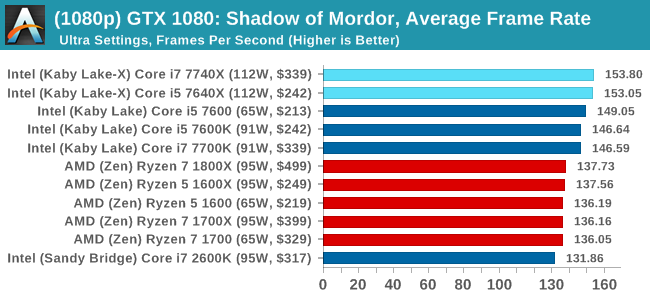
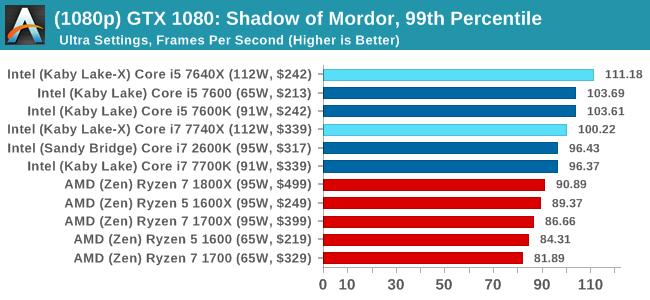
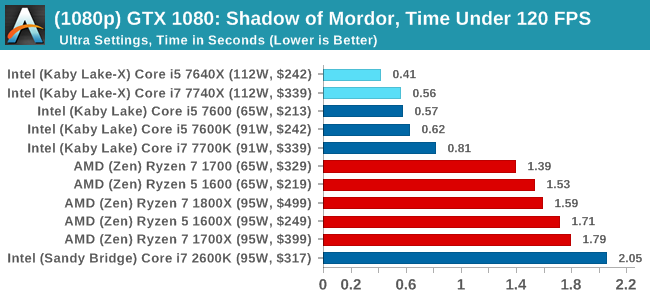
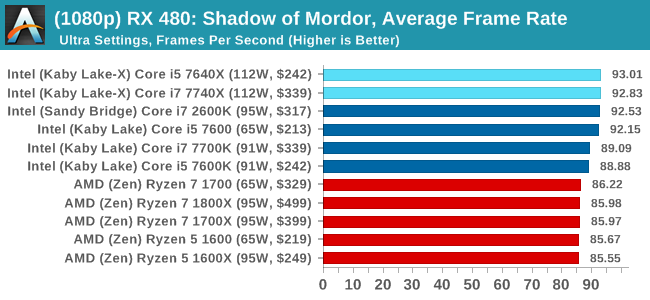
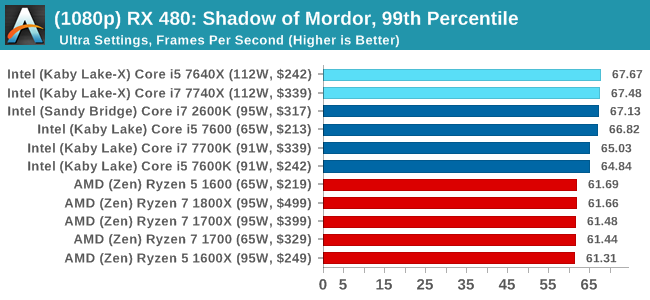
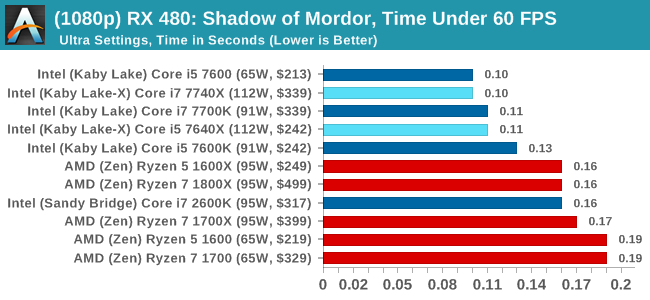
We run the benchmark at 1080p and a native 4K, using our 4K monitors, at the Ultra preset. Results are averaged across four runs and we report the average frame rate, 99th percentile frame rate, and time under analysis.
For all our results, we show the average frame rate at 1080p first. Mouse over the other graphs underneath to see 99th percentile frame rates and 'Time Under' graphs, as well as results for other resolutions. All of our benchmark results can also be found in our benchmark engine, Bench.
MSI GTX 1080 Gaming 8G Performance
1080p
4K
ASUS GTX 1060 Strix 6GB Performance
1080p
4K


Sapphire R9 Fury 4GB Performance

1080p
4K
Sapphire RX 480 8GB Performance
1080p
4K

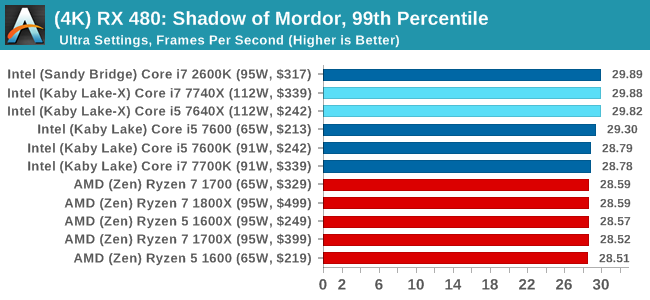
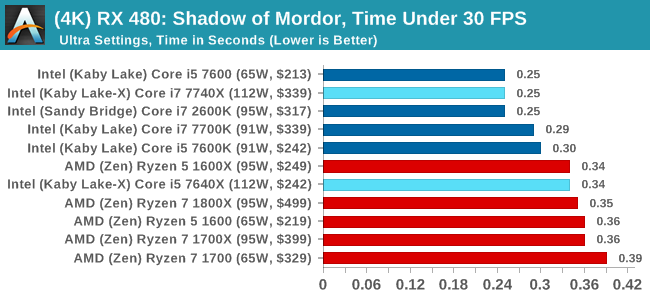
Shadow of Mordor Conclusions
Again, a win across the board for Intel, with the Core i7 taking the top spot in pretty much every scenario. AMD isn't that far behind for the most part.


176 Comments
View All Comments
Ian Cutress - Monday, July 24, 2017 - link
In the way everyone has historically been reporting PCIe lanes, Ryzen only has 16 PCIe lanes intended for graphics, with the other four for the chipset and another four for storage as an SoC. We've repeated this over and over and over again. Same with Threadripper: 60, plus four for chipset. If we're going to start counting PCIe lanes for chipsets (and DMI equivalents) and SoC related PCIe lanes for storage and others, we'll have to go and rewrite the PCIe lane counts for the last several generations of Intel and AMD CPUs.Kalelovil - Monday, July 24, 2017 - link
If the category is PCIe lanes for graphics that is quite right.But by that token doesn't (non cut-down) Broadwell-E/Skylake-E only have 32 lanes intended for graphics, as the switching logic allows for 2x16 and 4x8 configurations.
Although this is getting quite in-the-weeds. Overall I really appreciate the time and effort put into PC component reviews by the Anandtech staff.
FreckledTrout - Monday, July 24, 2017 - link
I agree with Ian as 4 PCIe lanes are always taken since you are running Ryzen with a chipset with no real way around that. I also would agree with say Skylake-x reporting 4 less PCIe lanes for the DMI link.Trenteth - Wednesday, July 26, 2017 - link
except Ryzen has 16x GPU lanes, $x to the chipset and 4x diect to an NVMe or U.2 drive. it's 20 PCIe 3.0 lanes off the CPU usable.Notmyusualid - Tuesday, July 25, 2017 - link
I got 40 lanes on my E5-2690.I'm running 4x 1070s on that, and PCIe based storage, and I doubled my throughput by moving the SSD to a riser card (until the 4th GPU went in), which means its back on the m/b.
Though, you can't notice in everyday use. Oddly.
Trenteth - Wednesday, July 26, 2017 - link
Having the 4x PCIe 3.0 lanes for a NVMe drive is an advantage, it's connected directly to the CPU and bypasses the chipset link which allows more bandwidth for USB/PCIe 2.0 lanes and SATA. I don't agree with you on not counting them.Kalelovil - Monday, July 24, 2017 - link
Your charts seem to label the i7 7740X with a $329 MSRP.In contrast your first page (and Intel ARK) lists a $339-$350 MSRP.
I assume the former is a mistake?
Ian Cutress - Monday, July 24, 2017 - link
$339 is the 1k tray price - the one that Intel quotes in the price lists and applicable if you buy 1000 OEM CPUs. $350 is MSRP that retailers will apply from their stock from distributors. Add more if you want a cooler. The issue here is that sometimes Intel never quotes an MSRP for some OEM-only processors, and AMD never seem to quote tray/OEM prices for retail parts. I'll edit this and make it clearer.Kalelovil - Monday, July 24, 2017 - link
Oh, by former I was referring to the $329 in your charts not the $339 on ARKIan Cutress - Monday, July 24, 2017 - link
Oops, I misread the price and misread your comment. Graphs should be updated with a cache refresh.