The Intel Kaby Lake-X i7 7740X and i5 7640X Review: The New Single-Threaded Champion, OC to 5GHz
by Ian Cutress on July 24, 2017 8:30 AM EST- Posted in
- CPUs
- Intel
- Kaby Lake
- X299
- Basin Falls
- Kaby Lake-X
- i7-7740X
- i5-7640X
Rise of the Tomb Raider
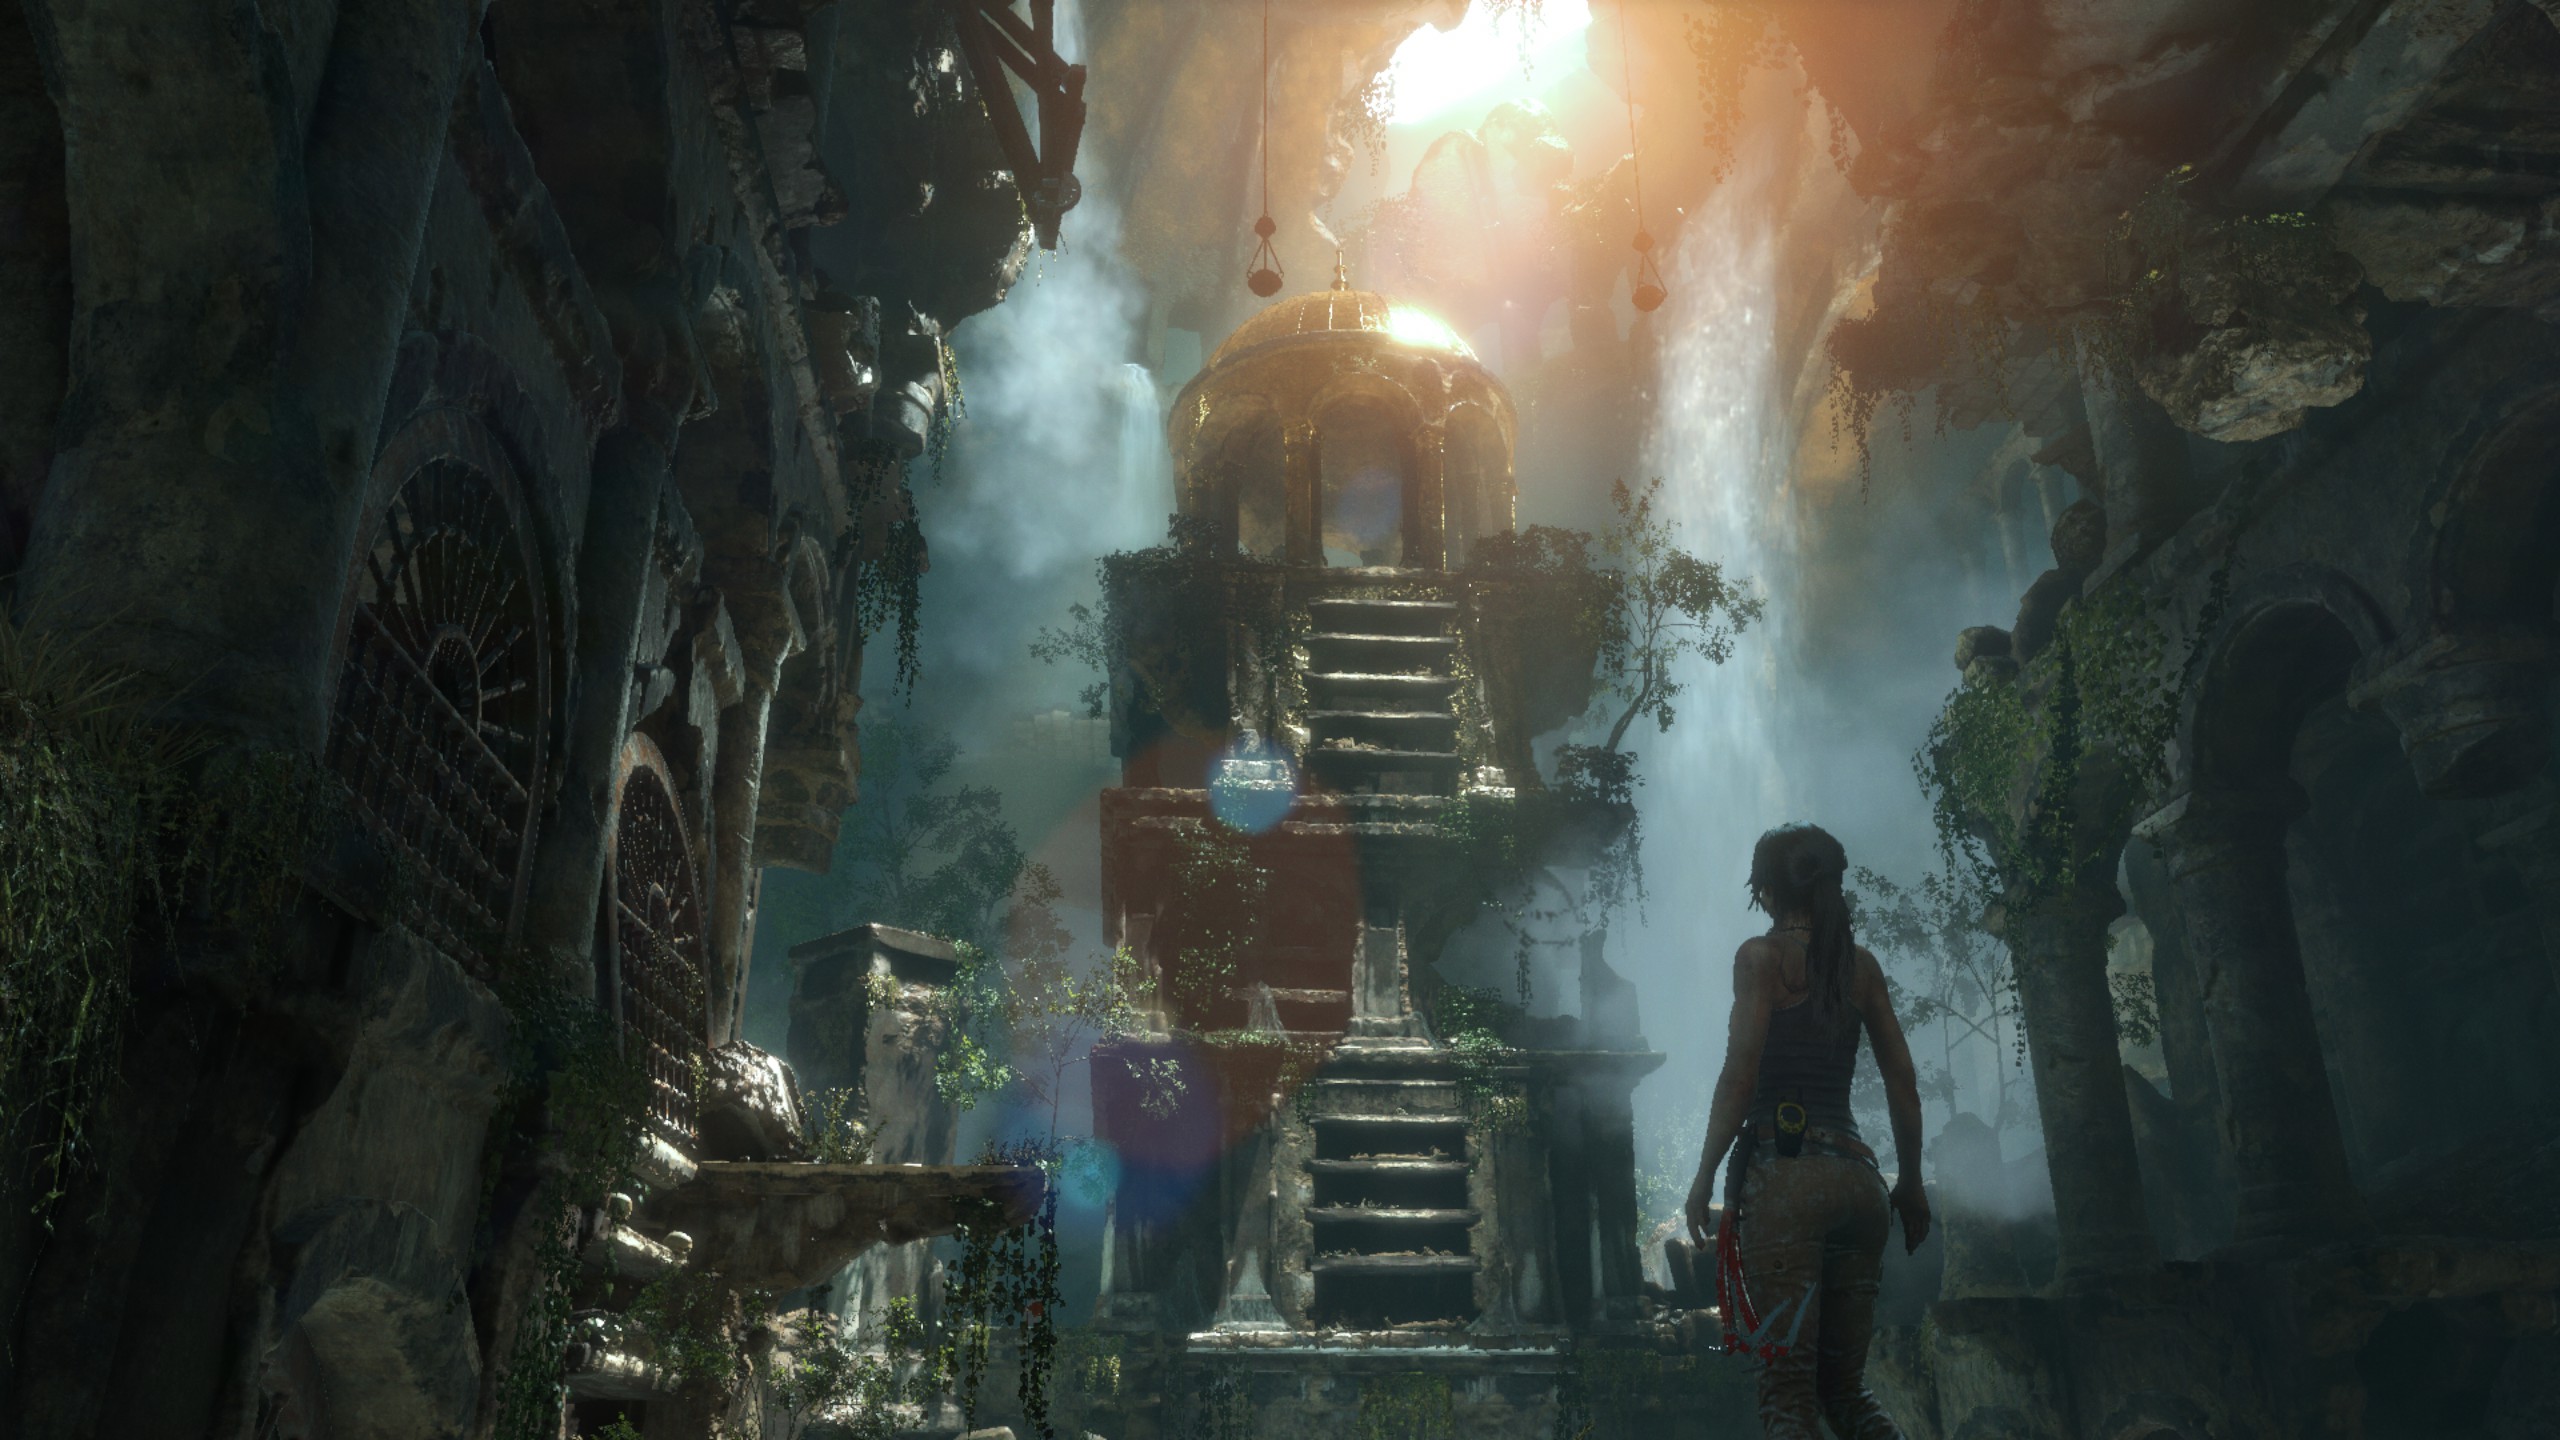
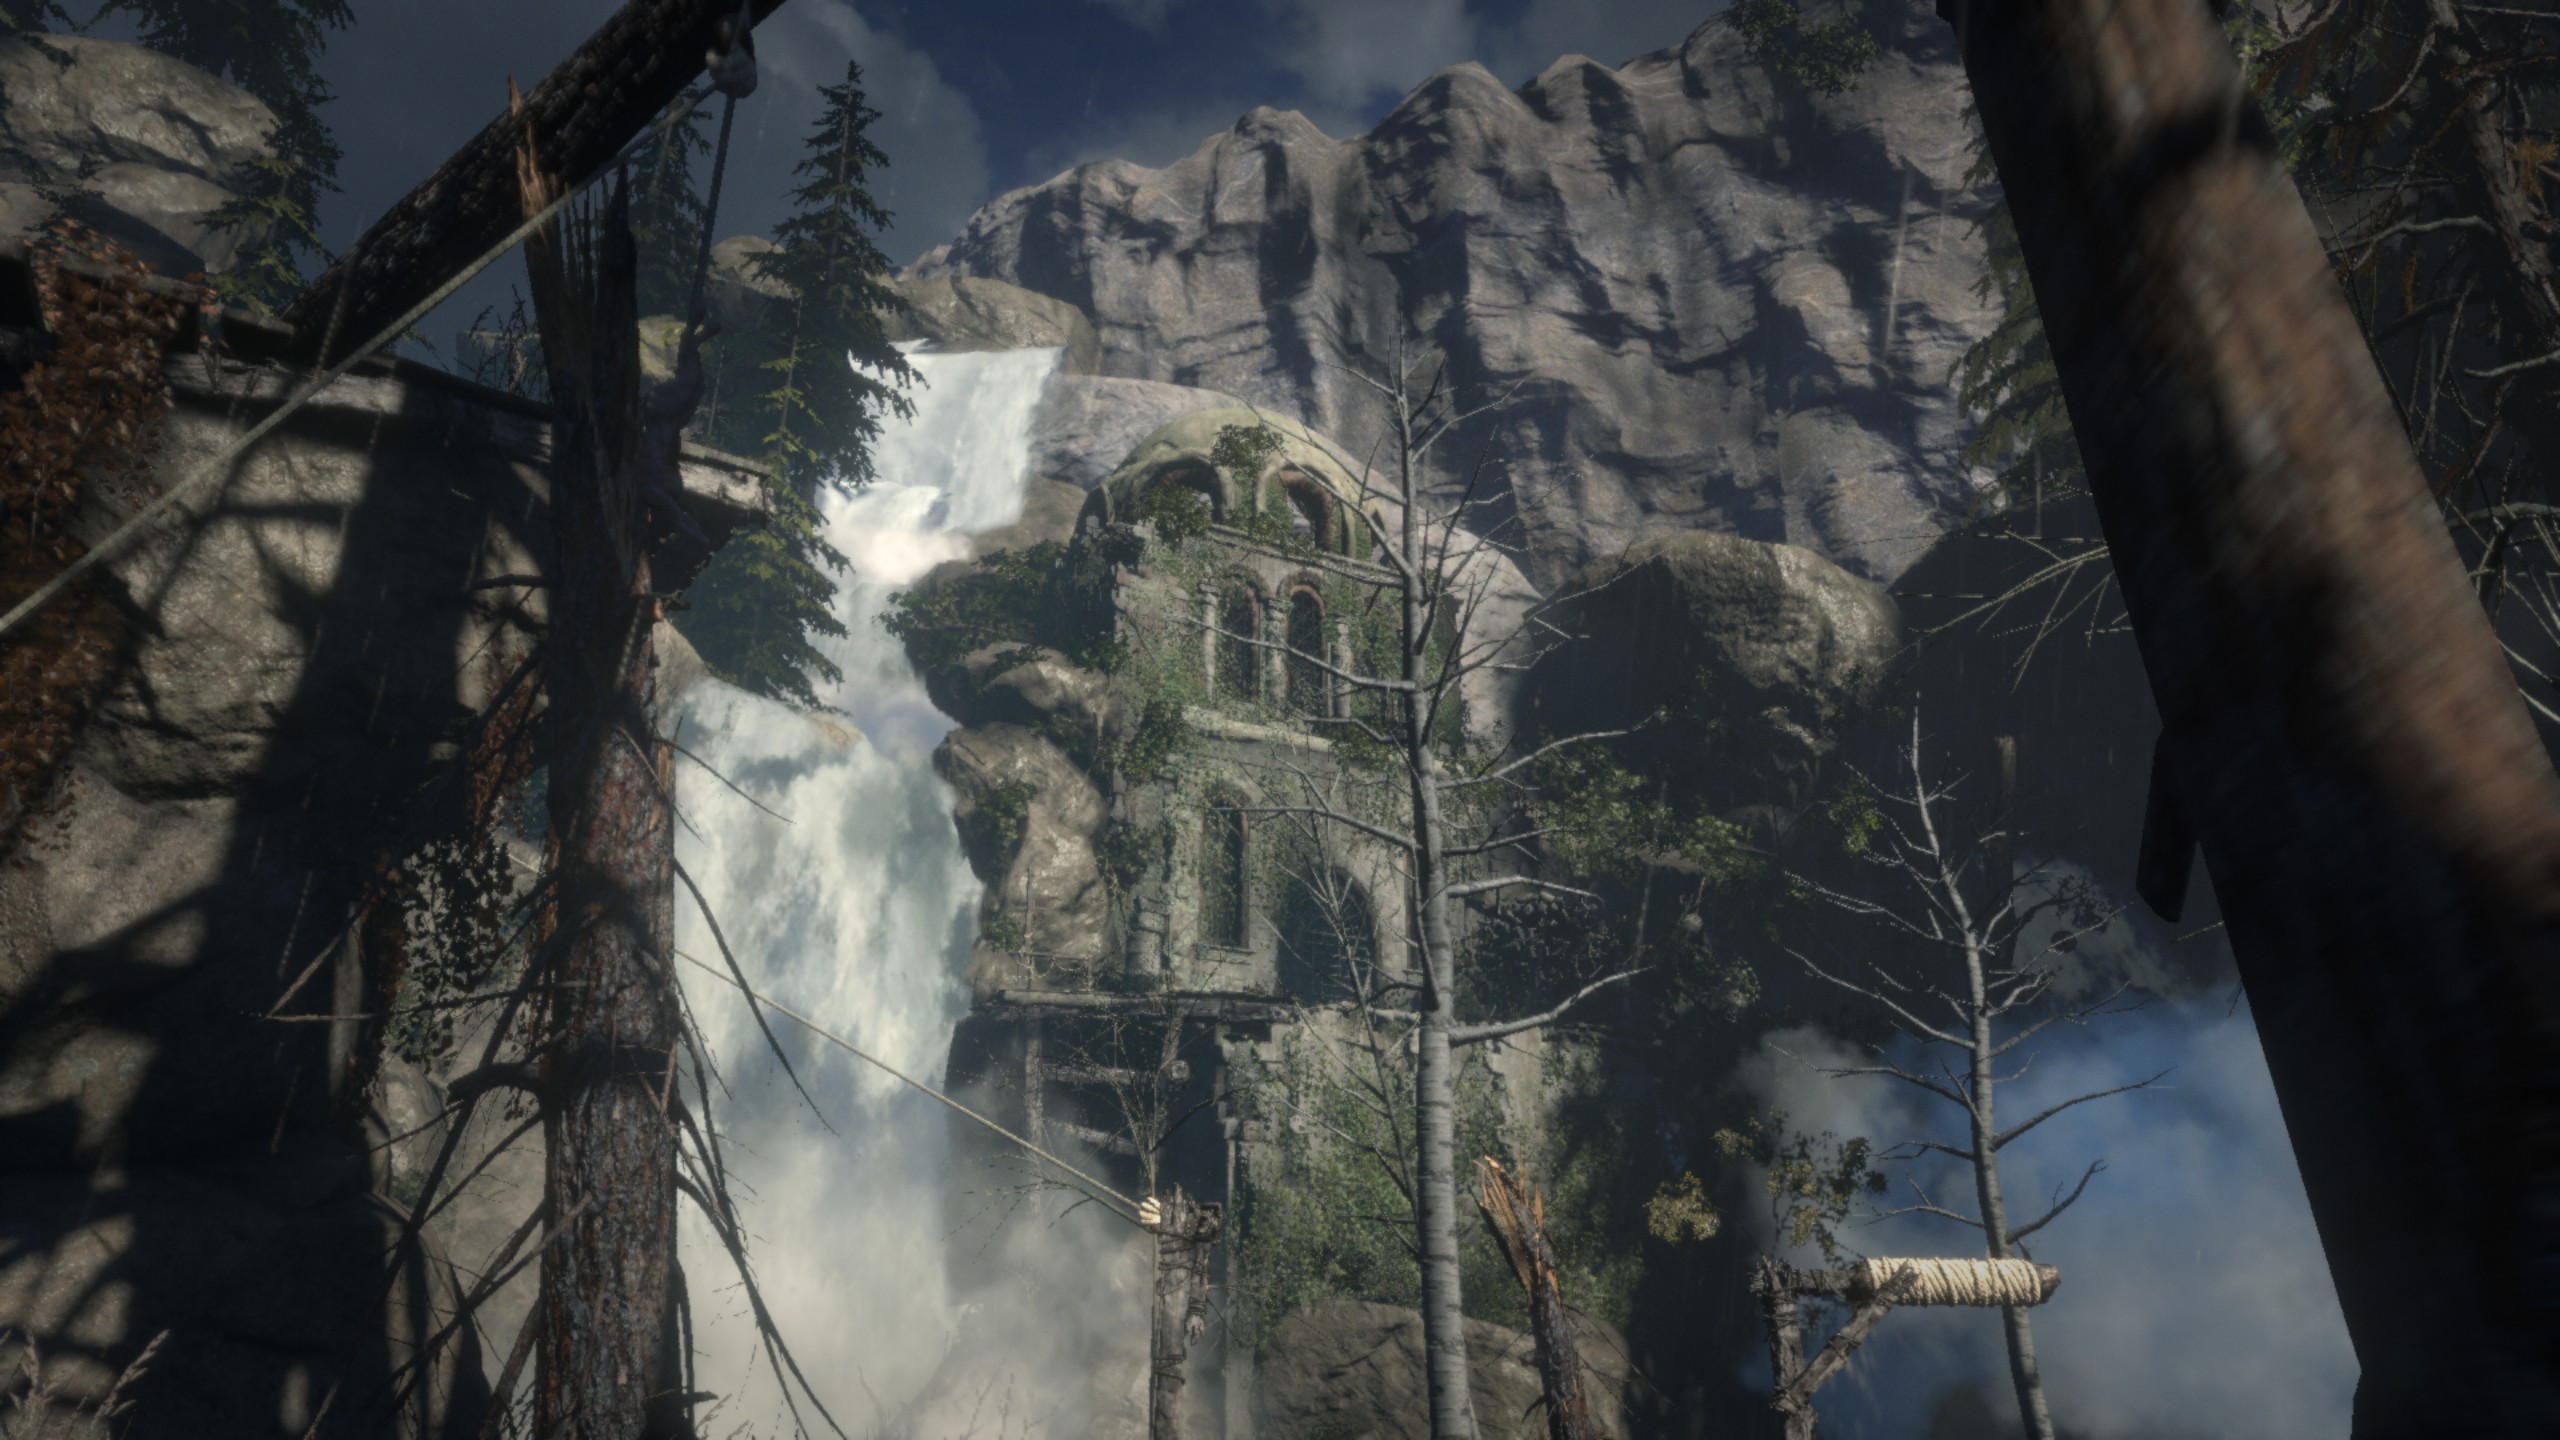
One of the newest games in the gaming benchmark suite is Rise of the Tomb Raider (RoTR), developed by Crystal Dynamics, and the sequel to the popular Tomb Raider which was loved for its automated benchmark mode. But don’t let that fool you: the benchmark mode in RoTR is very much different this time around.
Visually, the previous Tomb Raider pushed realism to the limits with features such as TressFX, and the new RoTR goes one stage further when it comes to graphics fidelity. This leads to an interesting set of requirements in hardware: some sections of the game are typically GPU limited, whereas others with a lot of long-range physics can be CPU limited, depending on how the driver can translate the DirectX 12 workload.
Where the old game had one benchmark scene, the new game has three different scenes with different requirements: Geothermal Valley (1-Valley), Prophet’s Tomb (2-Prophet) and Spine of the Mountain (3-Mountain) - and we test all three. These are three scenes designed to be taken from the game, but it has been noted that scenes like 2-Prophet shown in the benchmark can be the most CPU limited elements of that entire level, and the scene shown is only a small portion of that level. Because of this, we report the results for each scene on each graphics card separately.

Graphics options for RoTR are similar to other games in this type, offering some presets or allowing the user to configure texture quality, anisotropic filter levels, shadow quality, soft shadows, occlusion, depth of field, tessellation, reflections, foliage, bloom, and features like PureHair which updates on TressFX in the previous game.
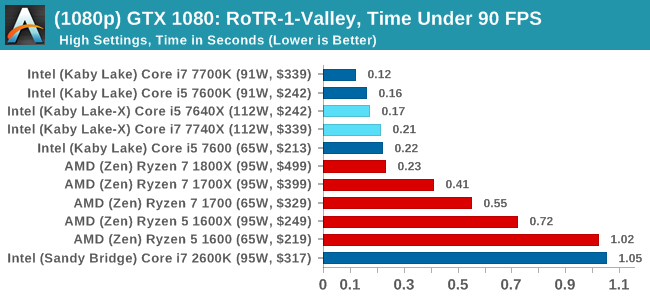
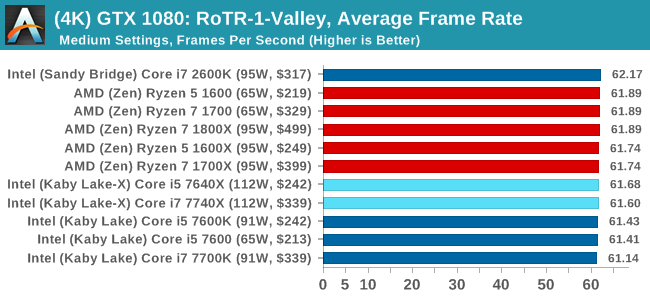
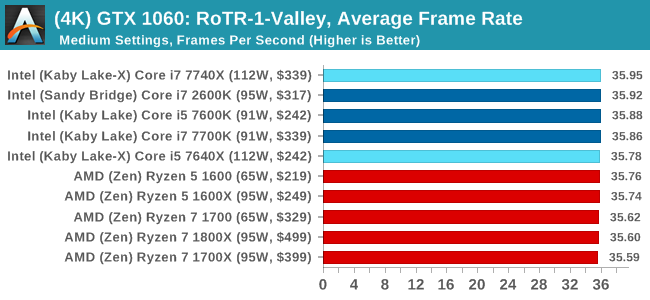
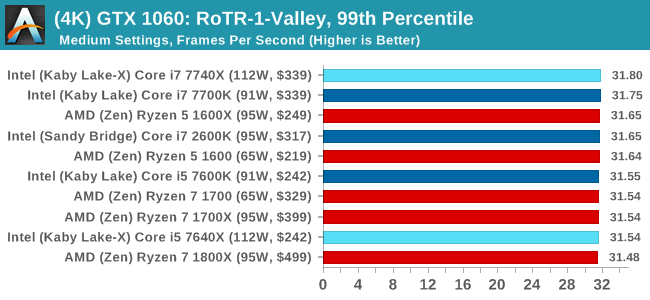
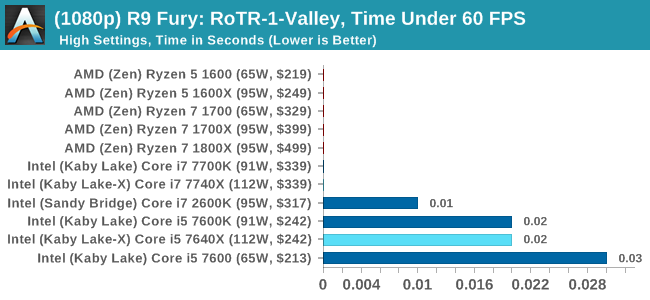
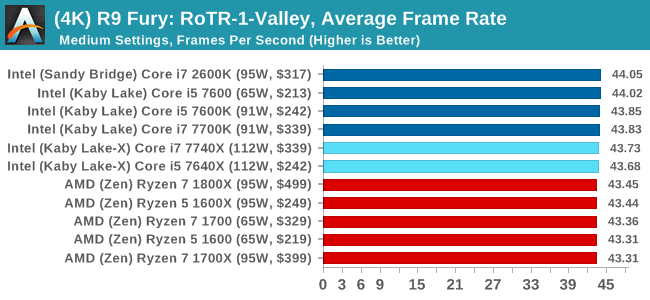
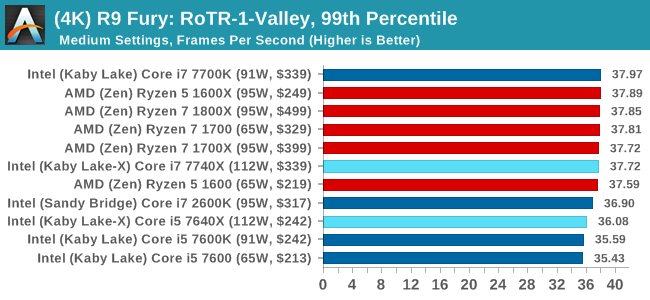
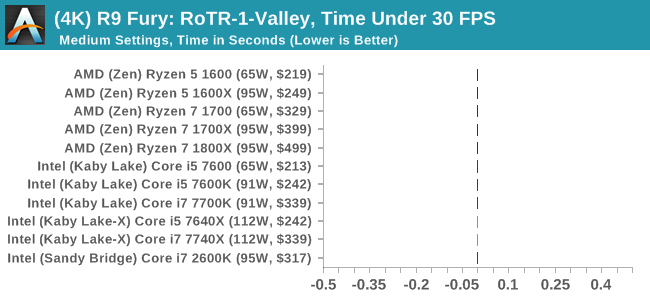
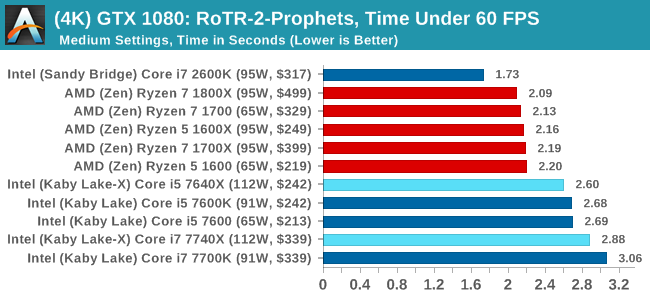
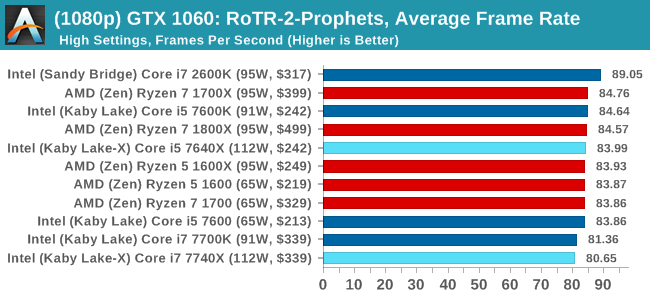
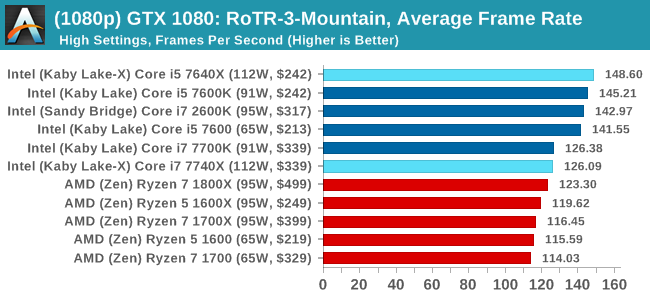
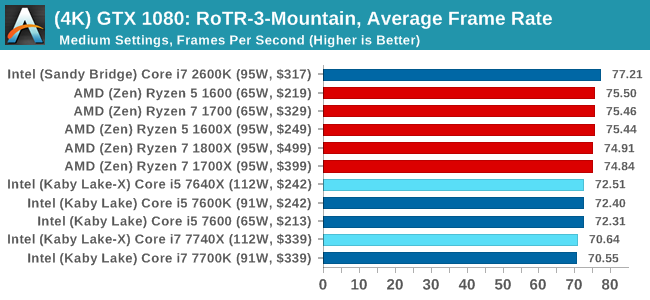
Again, we test at 1920x1080 and 4K using our native 4K displays. At 1080p we run the High preset, while at 4K we use the Medium preset which still takes a sizable hit in frame rate.
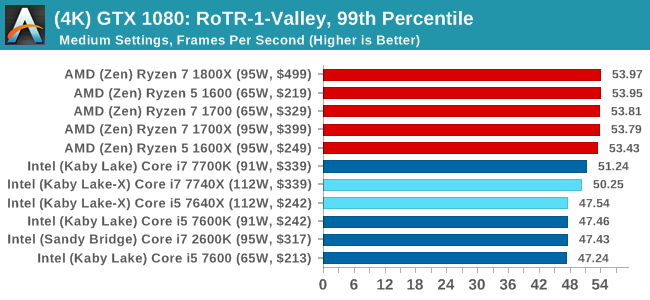
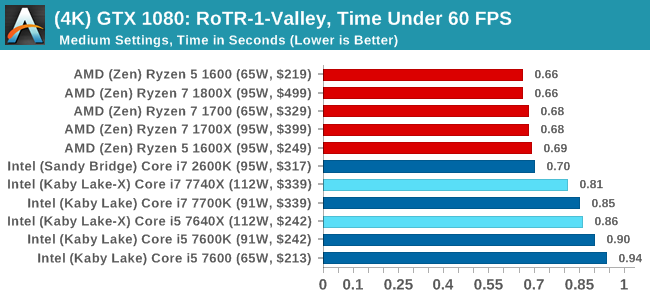
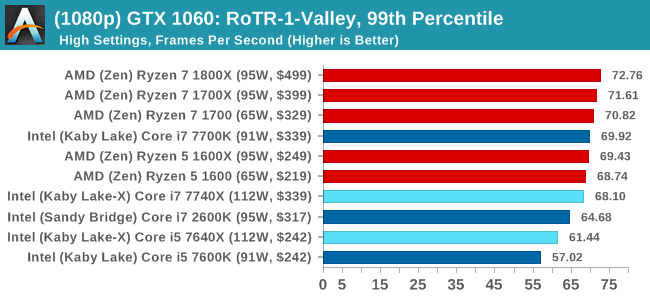
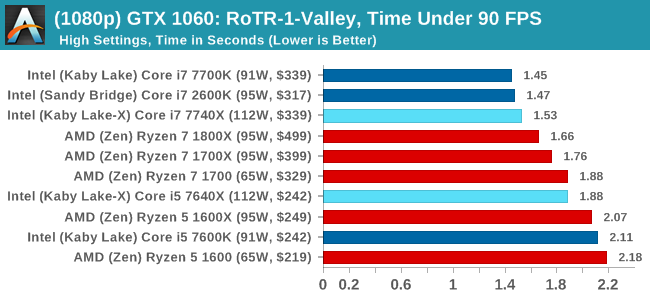
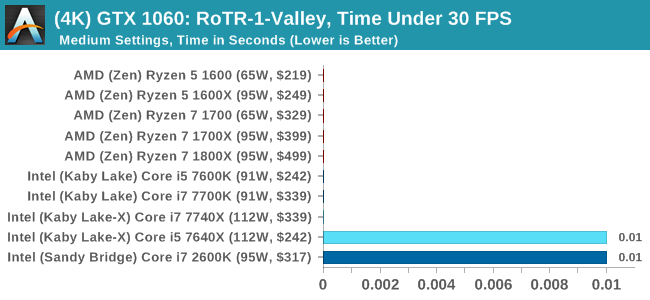
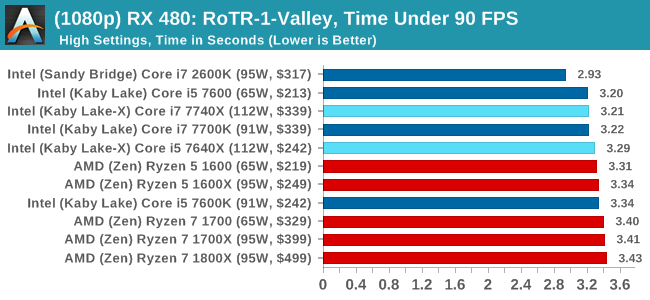
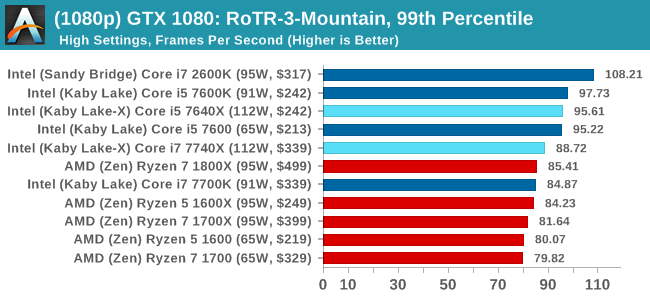
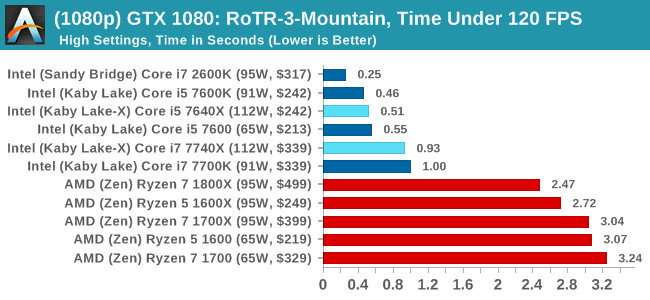
It is worth noting that RoTR is a little different to our other benchmarks in that it keeps its graphics settings in the registry rather than a standard ini file, and unlike the previous TR game the benchmark cannot be called from the command-line. Nonetheless we scripted around these issues to automate the benchmark four times and parse the results. From the frame time data, we report the averages, 99th percentiles, and our time under analysis.
For all our results, we show the average frame rate at 1080p first. Mouse over the other graphs underneath to see 99th percentile frame rates and 'Time Under' graphs, as well as results for other resolutions. All of our benchmark results can also be found in our benchmark engine, Bench.
#1 Geothermal Valley
MSI GTX 1080 Gaming 8G Performance
1080p
4K
ASUS GTX 1060 Strix 6GB Performance
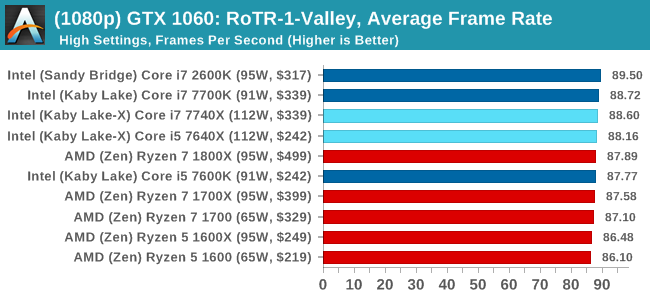
1080p
4K
Sapphire R9 Fury 4GB Performance
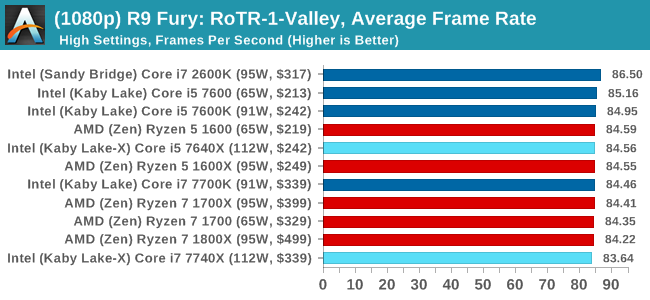
1080p
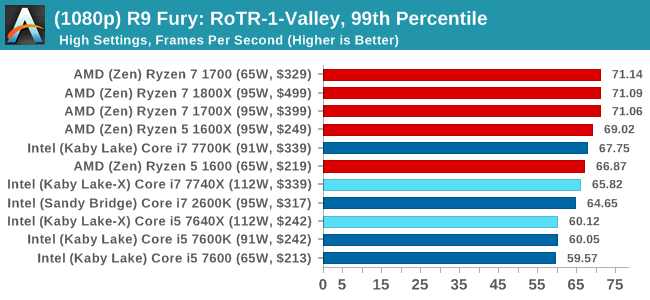
4K
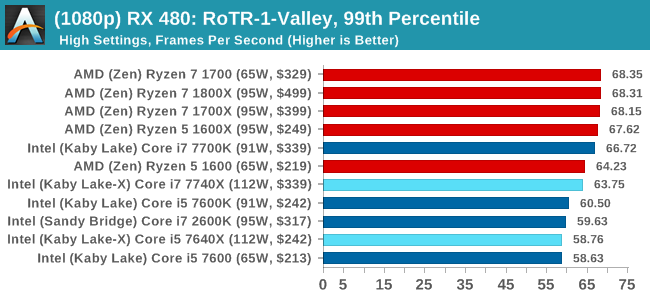
Sapphire RX 480 8GB Performance
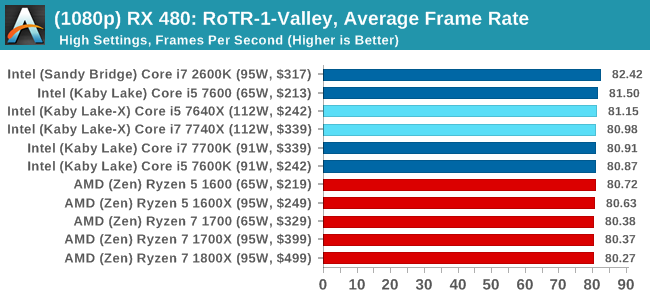
1080p
4K
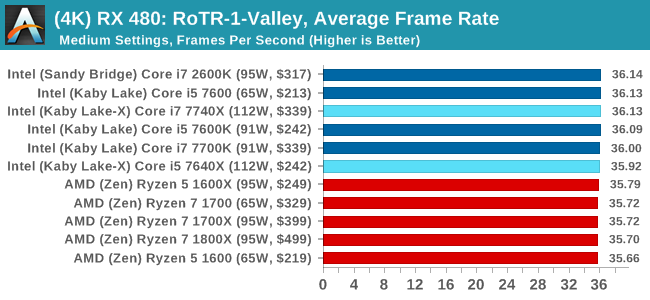
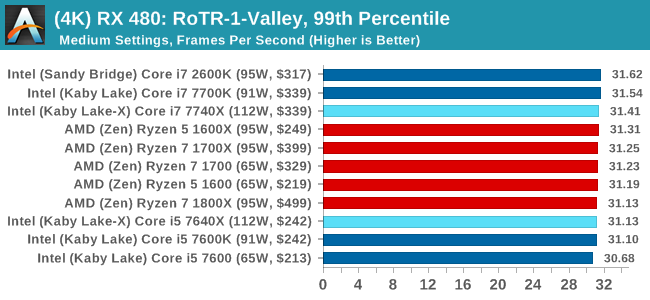
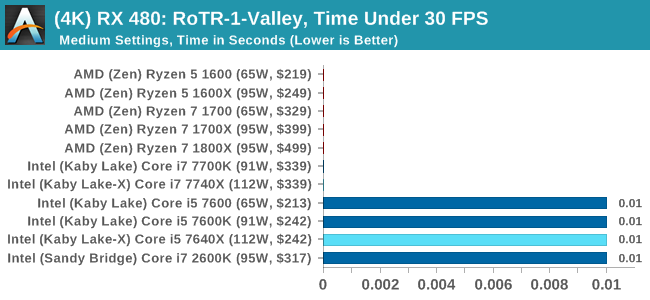
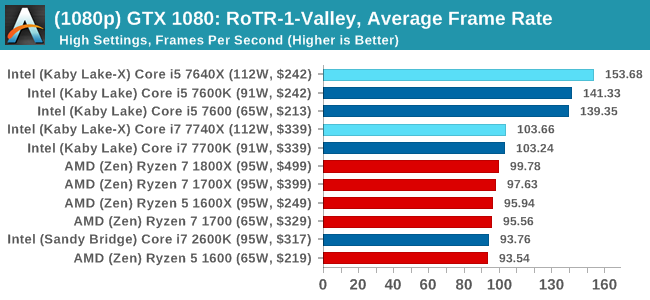
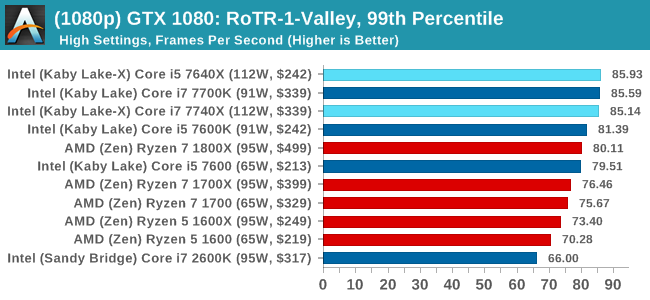
RoTR: Geothermal Valley Conclusions
If we were testing a single GTX 1080 at 1080p, you might think that the graph looks a little odd. All the quad-core, non HT processors (so, the Core i5s) get the best frame rates and percentiles on this specific test on this specific hardware by a good margin. The rest of the tests do not mirror that result though, with the results ping-ponging between Intel and AMD depending on the resolution and the graphics card.
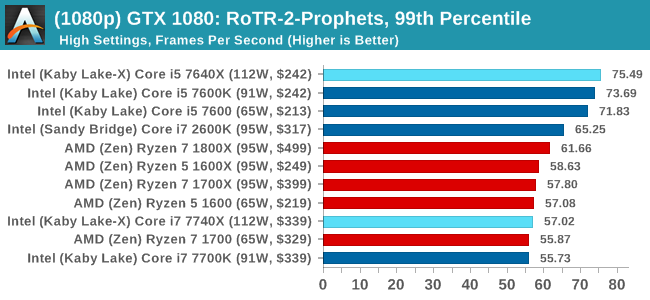
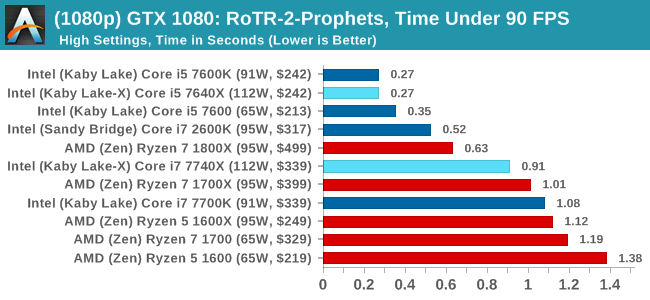
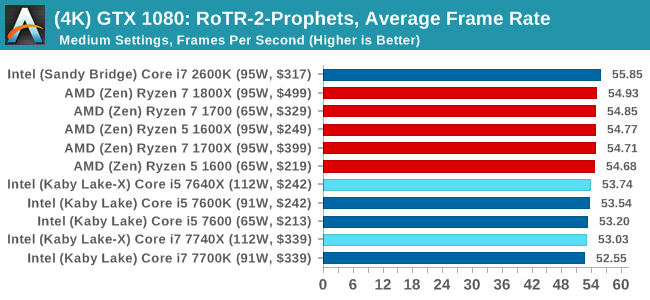
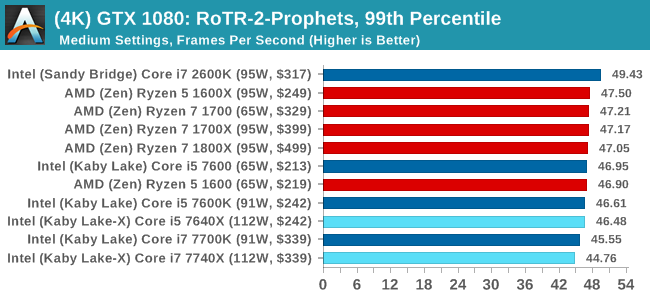
#2 Prophet's Tomb
MSI GTX 1080 Gaming 8G Performance
1080p
4K
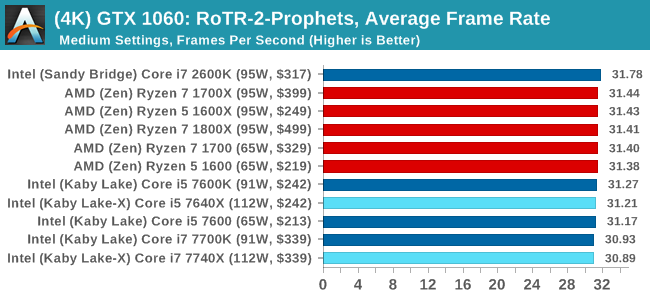
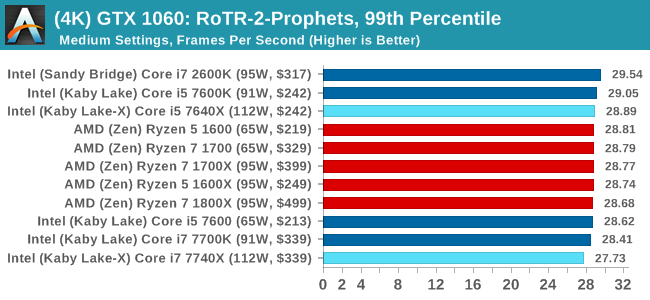
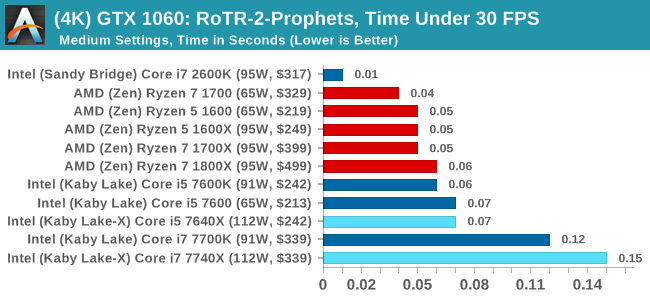
ASUS GTX 1060 Strix 6GB Performance
1080p
4K
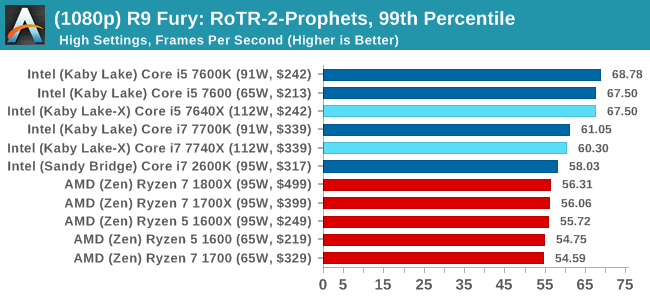
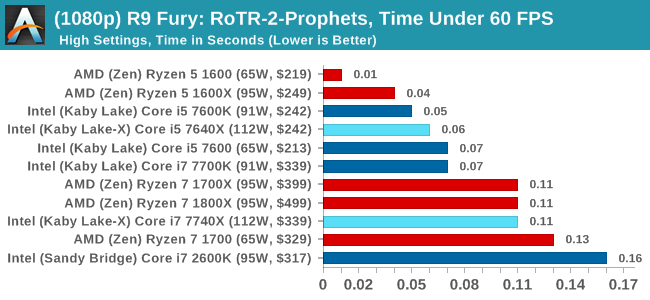
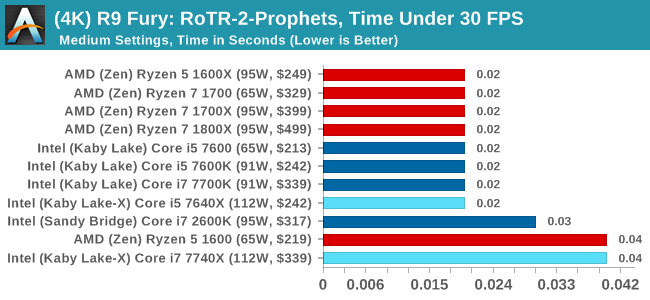
Sapphire R9 Fury 4GB Performance
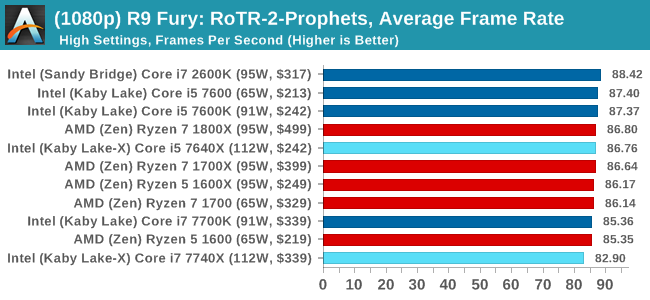
1080p
4K
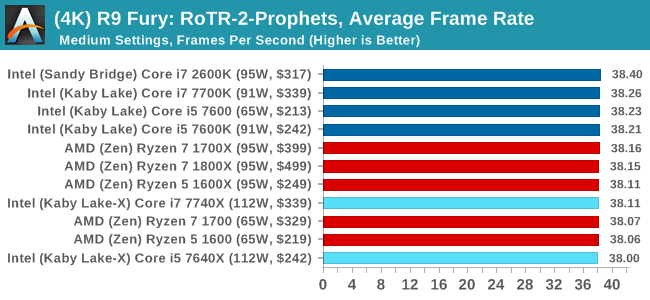
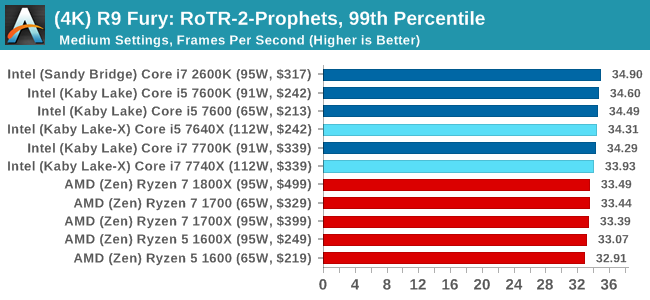
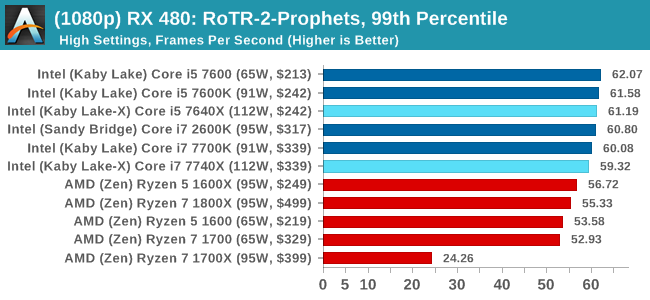
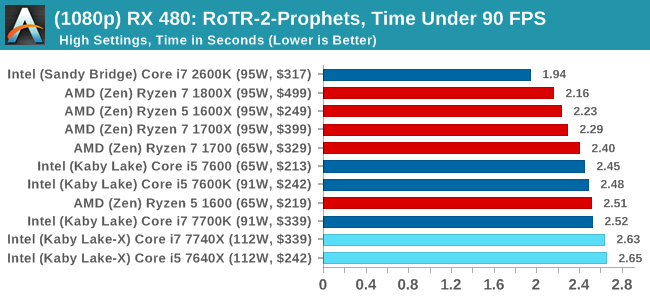
Sapphire RX 480 8GB Performance
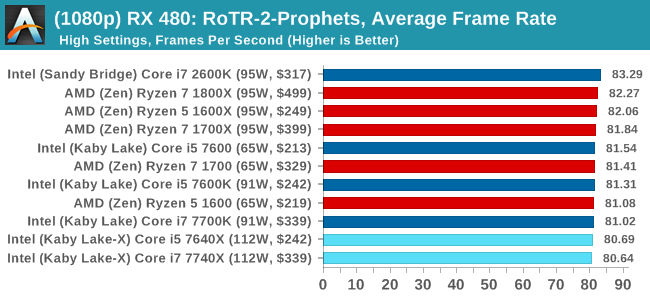
1080p
4K
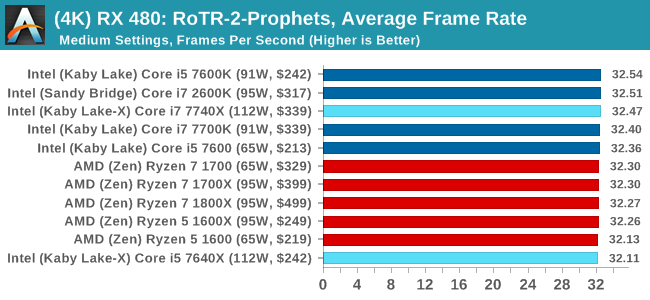
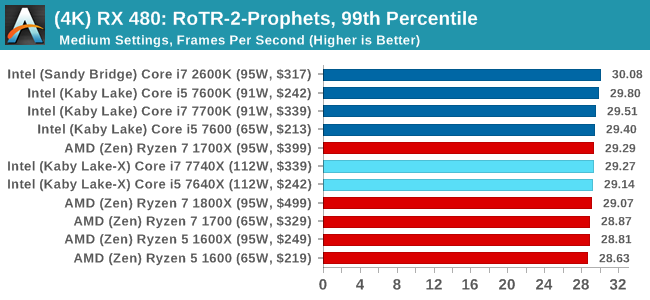
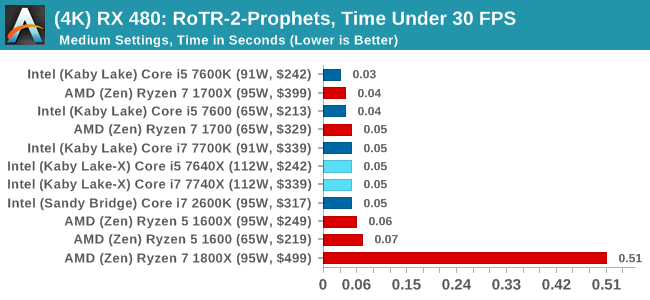
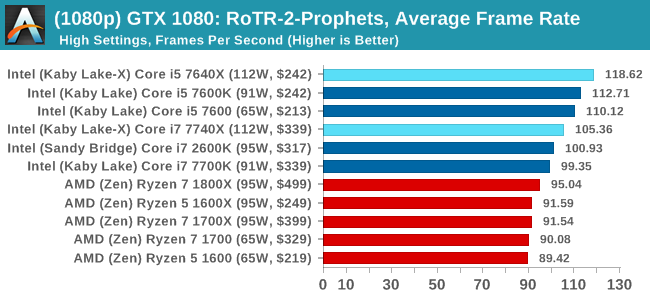
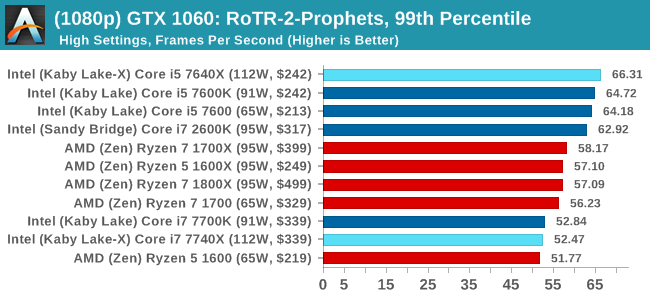
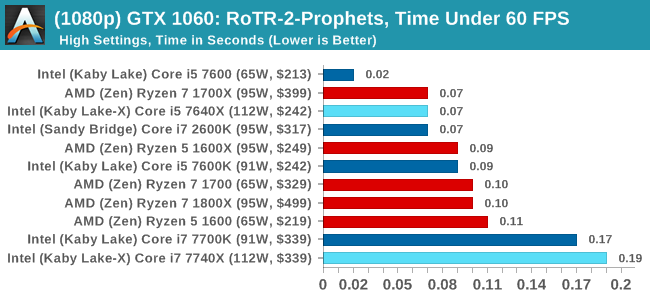
RoTR: Prophet's Tomb Conclusions
For Prophet's Tomb, we again see the Core i5s pull a win at 1080p using the GTX 1080, but the rest of the tests are a mix of results, some siding with AMD and others for Intel. There is the odd outlier in the Time Under analysis, which may warrant further inspection.
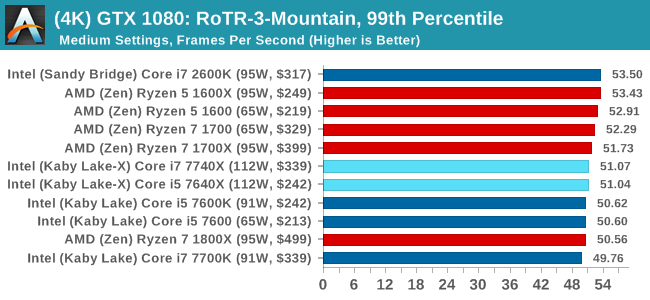
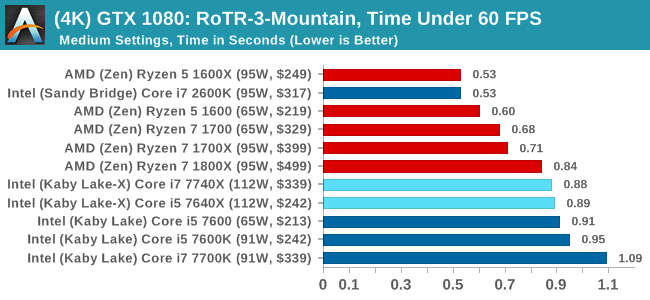
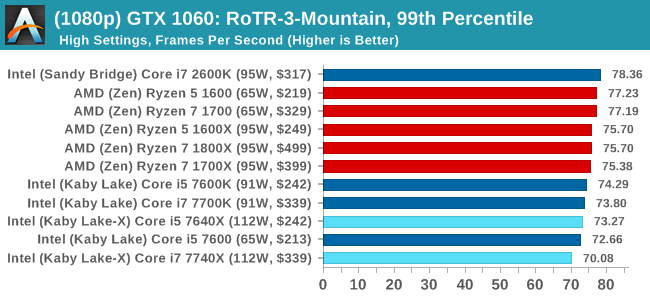
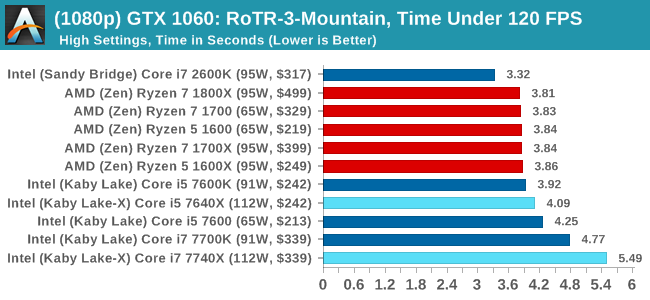
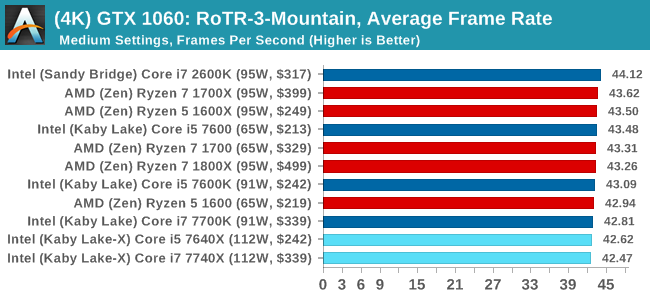
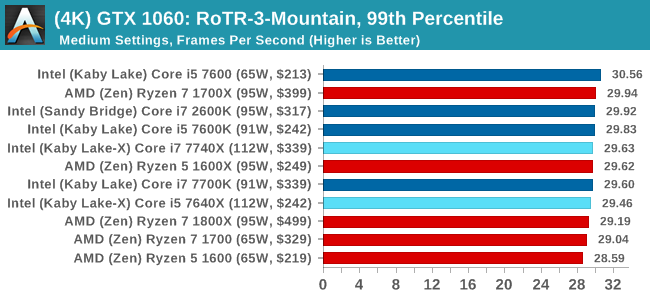
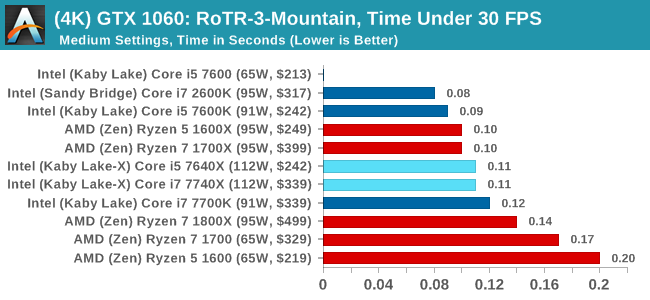
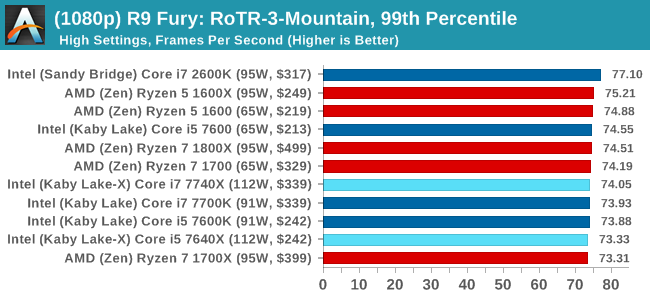
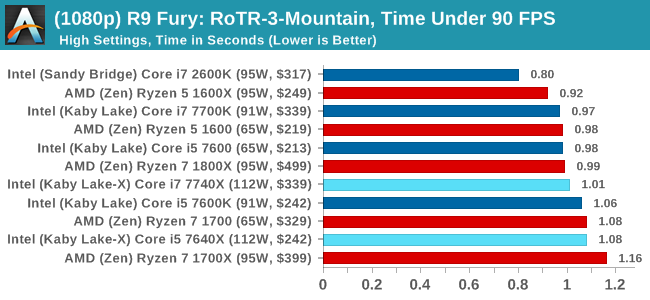
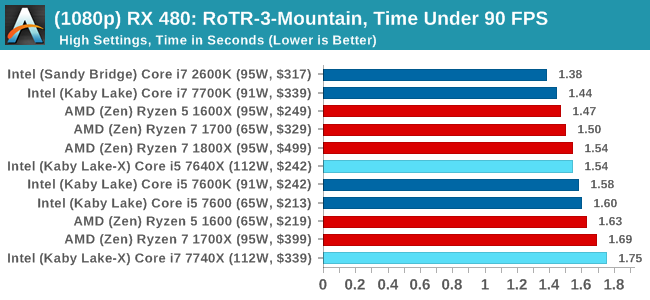
#3 Spine of the Mountain
MSI GTX 1080 Gaming 8G Performance
1080p
4K
ASUS GTX 1060 Strix 6GB Performance
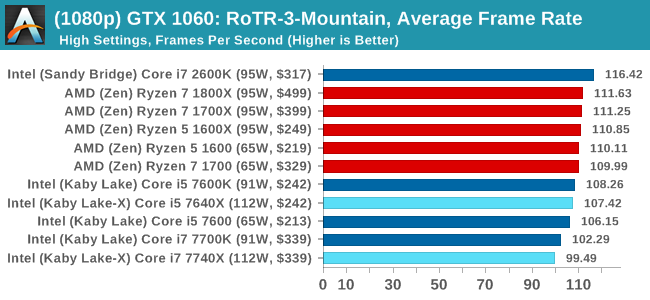
1080p
4K
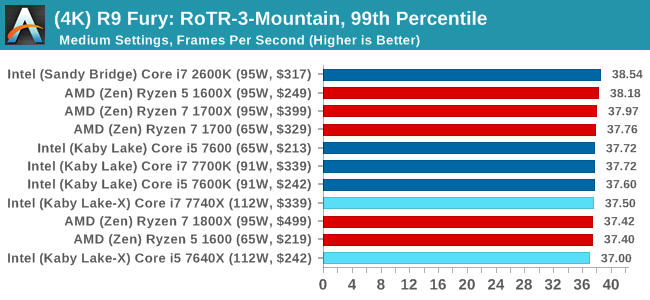
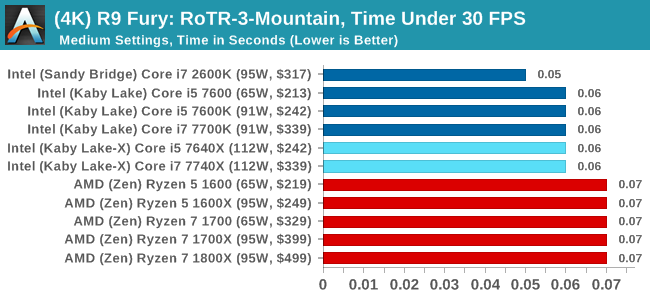
Sapphire R9 Fury 4GB Performance
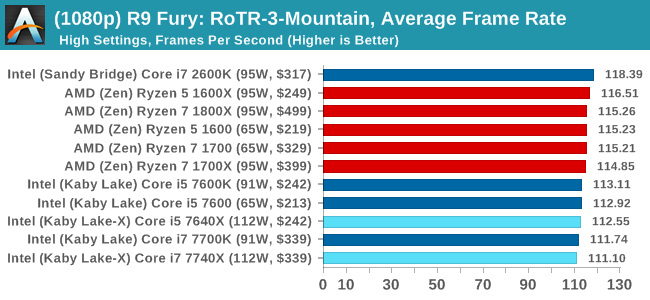
1080p
4K
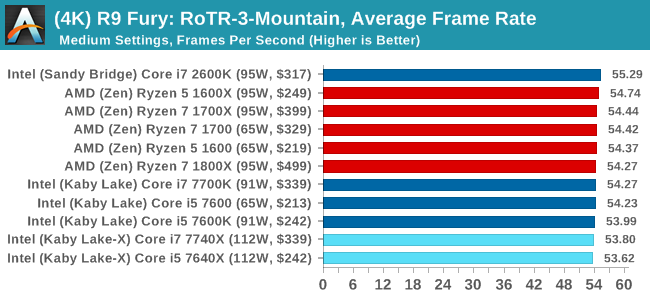
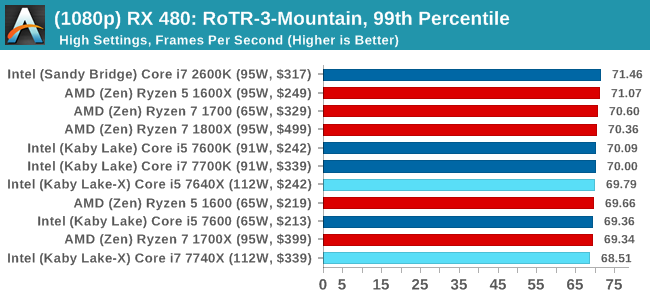
Sapphire RX 480 8GB Performance
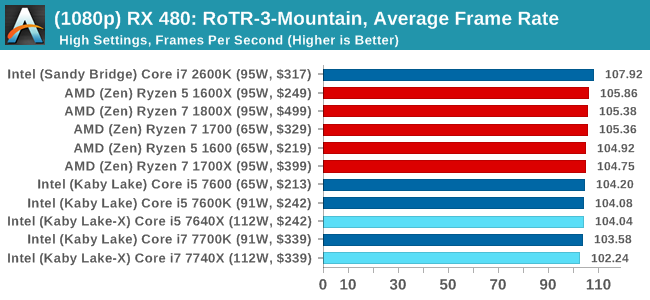
1080p
4K
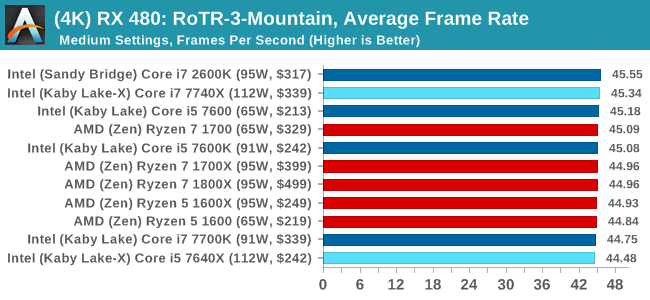
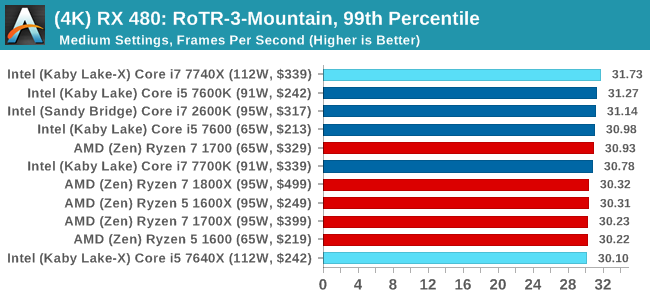
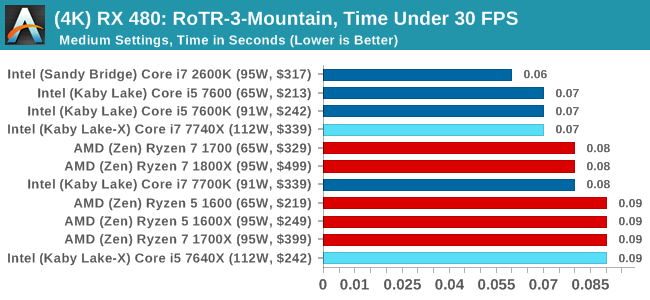
RoTR: Spine of the Mountain Conclusions
Core i5, we're assigning you to run at 1080p with a GTX 1080. That's an order. The rest of you, stand easy.


176 Comments
View All Comments
Firebat5 - Tuesday, July 25, 2017 - link
Ian,i'm interested in the details of the agility benchmark? how many photos are in your dataset and at what resolution? am doing similar work and i notice the working time doesn't seem to be linear with the number of photos.
Firebat5 - Tuesday, July 25, 2017 - link
agisoft* autocorrect strikes again.damianrobertjones - Thursday, July 27, 2017 - link
Capitals can be a good thing.Gothmoth - Tuesday, July 25, 2017 - link
reading this article again i must say im realyl ashamed. anandtech was once a great place but now it´s just like car magazines. who pays best gets the best reviews. where is the criticism? everyone and his grandmother things intel has big issues (tim, heat, pci lanes nonsense product) are you bend over so intel can inject more money more easily?damianrobertjones - Thursday, July 27, 2017 - link
Is your shift key broke? Where's are your capitals?zodiacfml - Wednesday, July 26, 2017 - link
Impressive benchmarks. I could not ask for more. This revealed that Intel clearly doesn't have the premium or value position anymore. It is simply not there. They have to be in the 10nm process now to be superior in value and/or performance.Walkeer - Wednesday, July 26, 2017 - link
Hi, what RAM frequency is the AMD platform running on? if its the official maximum of 2666MHz, you can get +10-15% more performance using 3200MHz or faster memorywarner001 - Wednesday, July 26, 2017 - link
Hey, This is a very useful post for the new ones. Thanks a lot. please visit http://forums.cat.com/t5/user/viewprofilepage/user...warner001 - Wednesday, July 26, 2017 - link
nice blogedsib1 - Wednesday, July 26, 2017 - link
Please redo the Ryzen benchmarks using DDR3200 now it is officially supported, and also use the latest updates of the games - eg ROTR v770.1+ where Ryzen gets a 25% increase.You can't compare one platform with the latest updates, and the other without - thats pointless