The Intel Kaby Lake-X i7 7740X and i5 7640X Review: The New Single-Threaded Champion, OC to 5GHz
by Ian Cutress on July 24, 2017 8:30 AM EST- Posted in
- CPUs
- Intel
- Kaby Lake
- X299
- Basin Falls
- Kaby Lake-X
- i7-7740X
- i5-7640X
Rise of the Tomb Raider
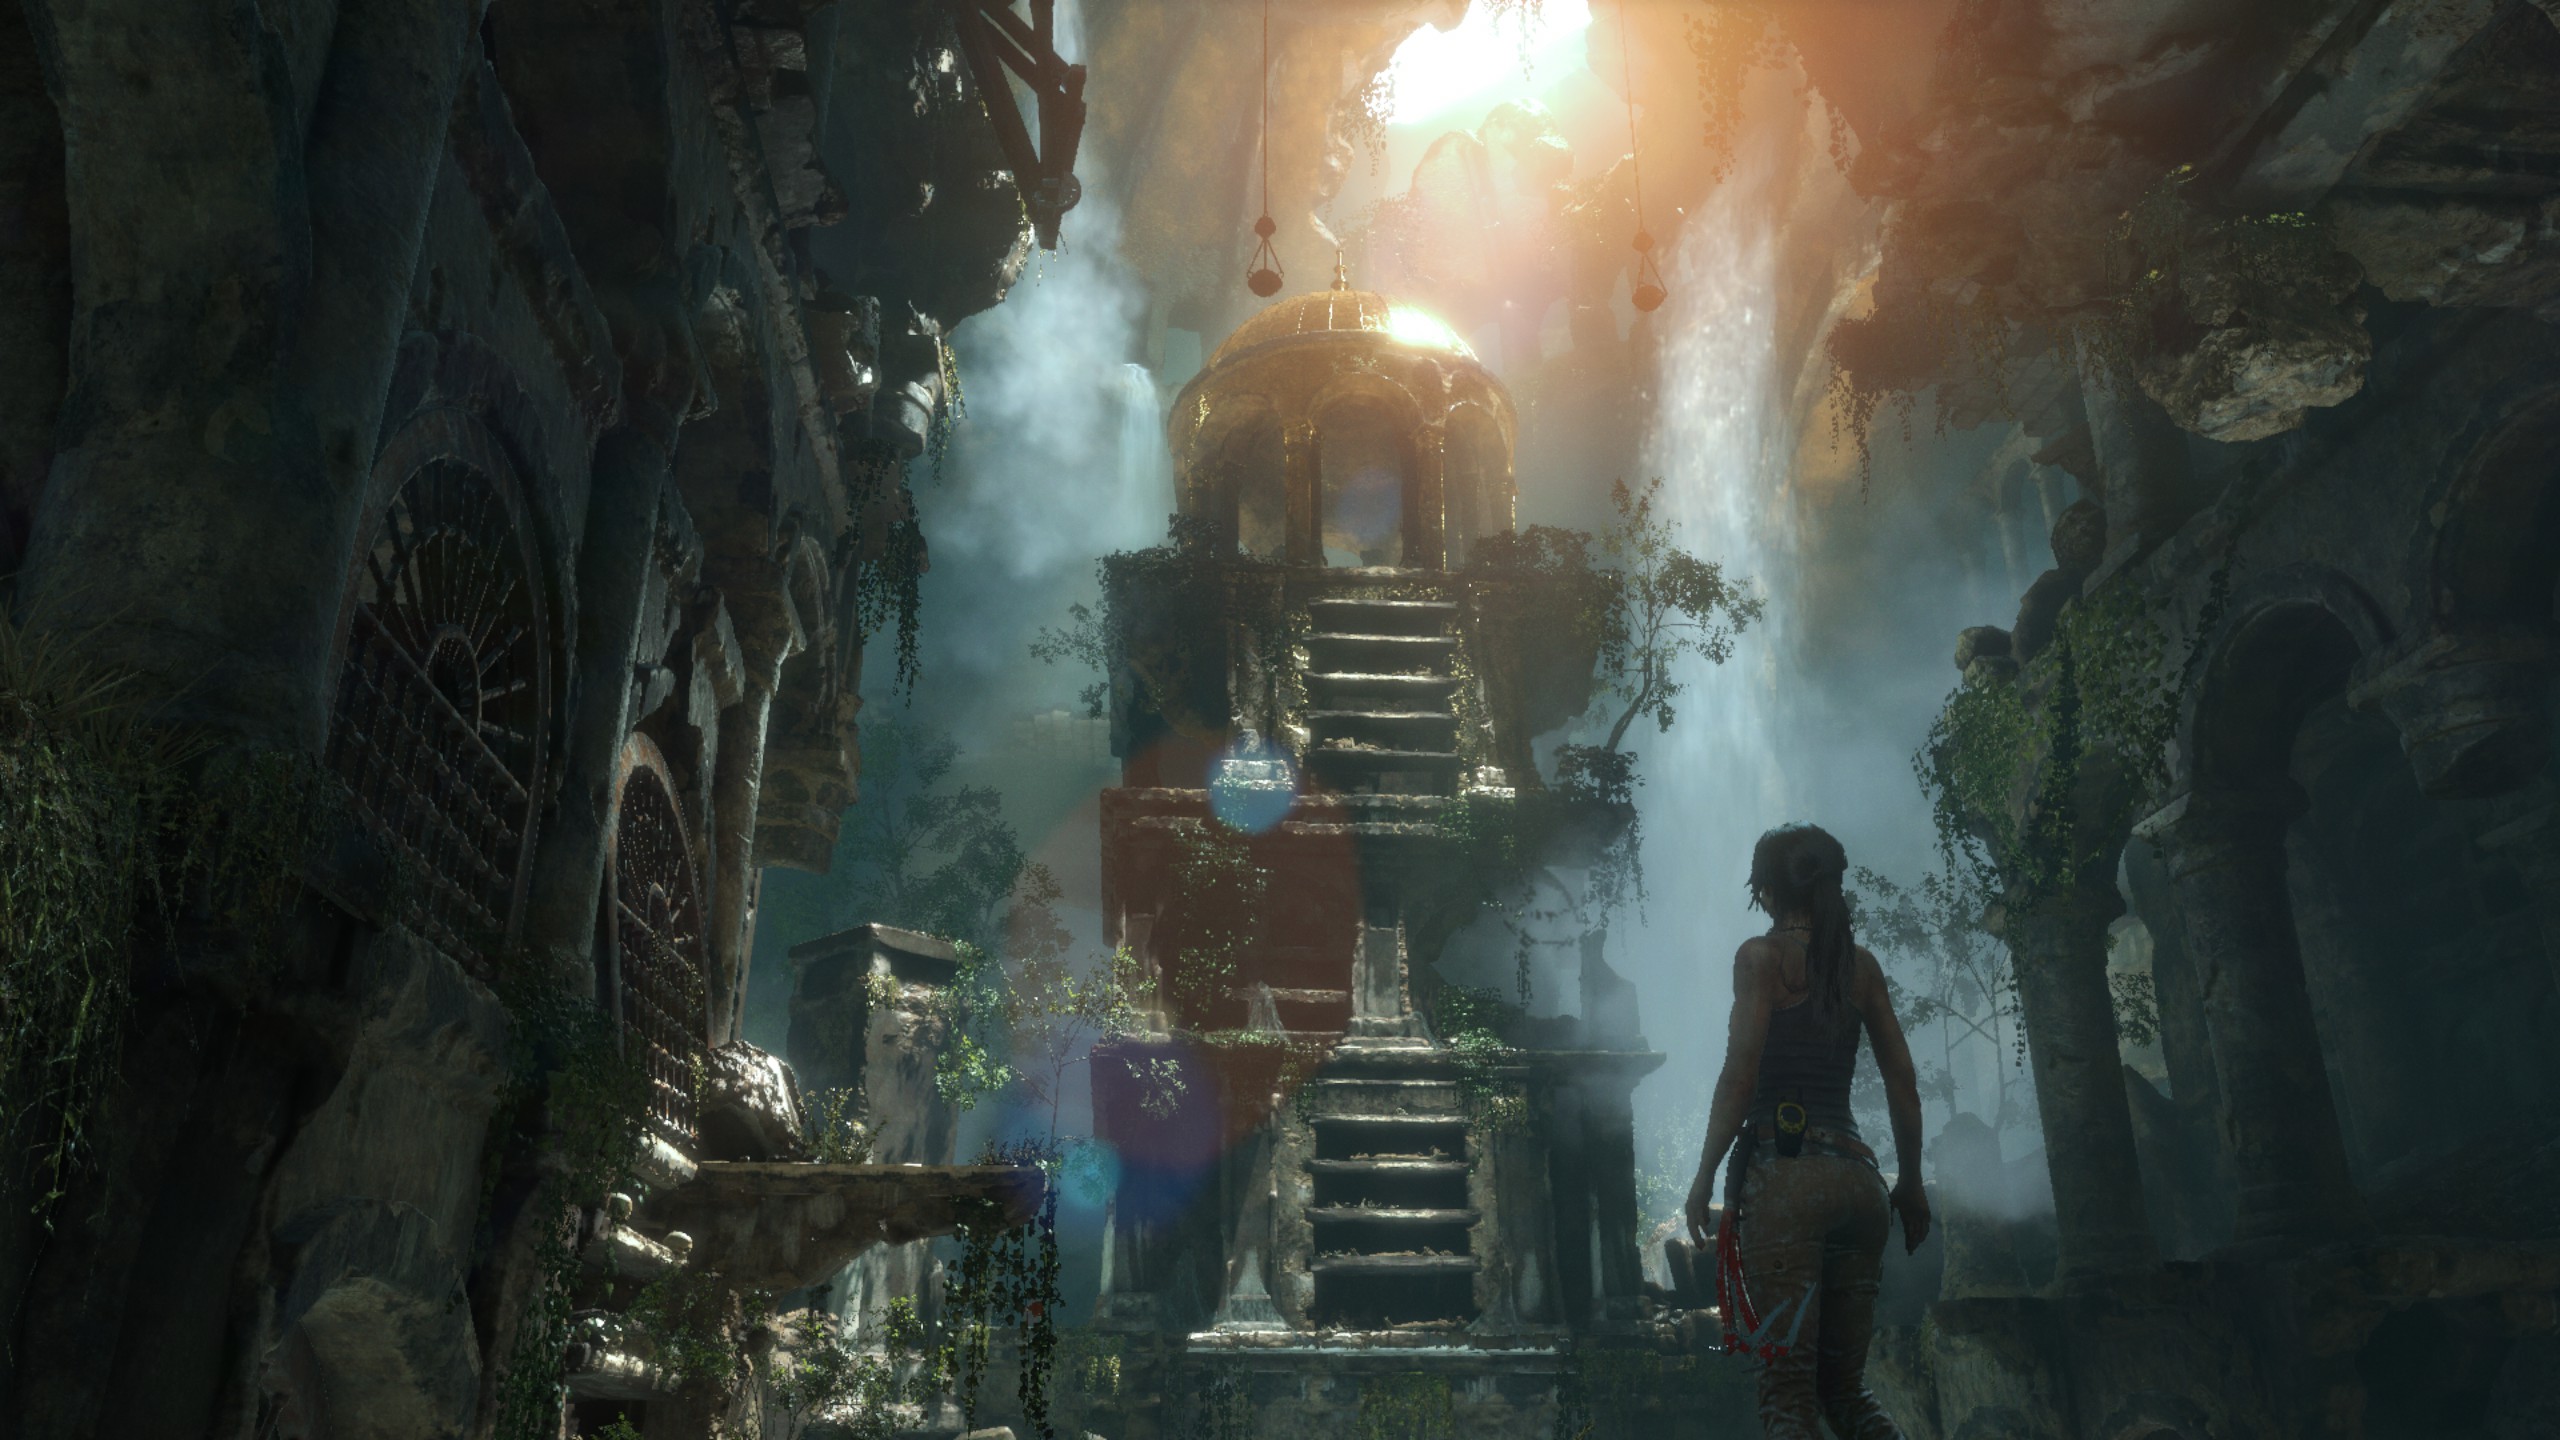
One of the newest games in the gaming benchmark suite is Rise of the Tomb Raider (RoTR), developed by Crystal Dynamics, and the sequel to the popular Tomb Raider which was loved for its automated benchmark mode. But don’t let that fool you: the benchmark mode in RoTR is very much different this time around.
Visually, the previous Tomb Raider pushed realism to the limits with features such as TressFX, and the new RoTR goes one stage further when it comes to graphics fidelity. This leads to an interesting set of requirements in hardware: some sections of the game are typically GPU limited, whereas others with a lot of long-range physics can be CPU limited, depending on how the driver can translate the DirectX 12 workload.
Where the old game had one benchmark scene, the new game has three different scenes with different requirements: Geothermal Valley (1-Valley), Prophet’s Tomb (2-Prophet) and Spine of the Mountain (3-Mountain) - and we test all three. These are three scenes designed to be taken from the game, but it has been noted that scenes like 2-Prophet shown in the benchmark can be the most CPU limited elements of that entire level, and the scene shown is only a small portion of that level. Because of this, we report the results for each scene on each graphics card separately.

Graphics options for RoTR are similar to other games in this type, offering some presets or allowing the user to configure texture quality, anisotropic filter levels, shadow quality, soft shadows, occlusion, depth of field, tessellation, reflections, foliage, bloom, and features like PureHair which updates on TressFX in the previous game.
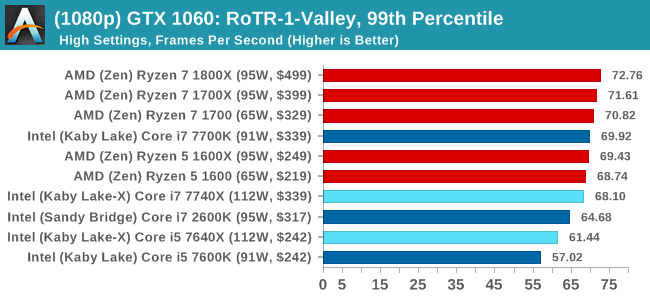
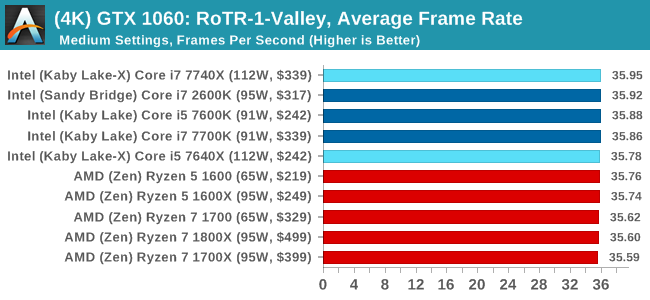
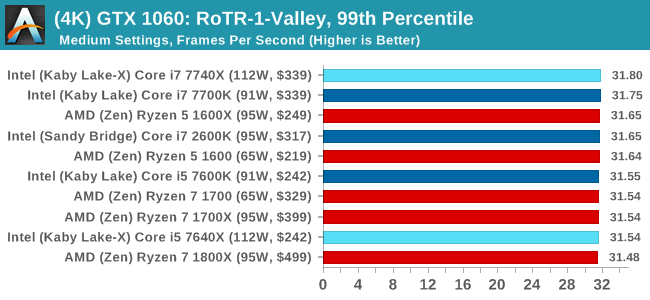
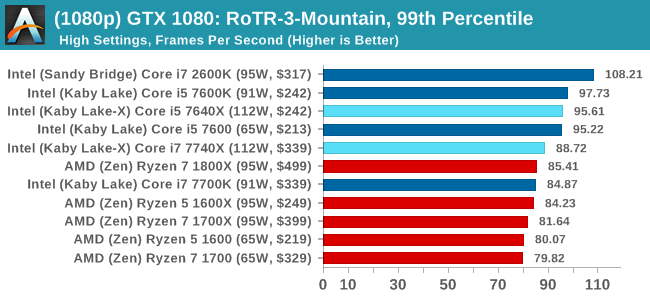
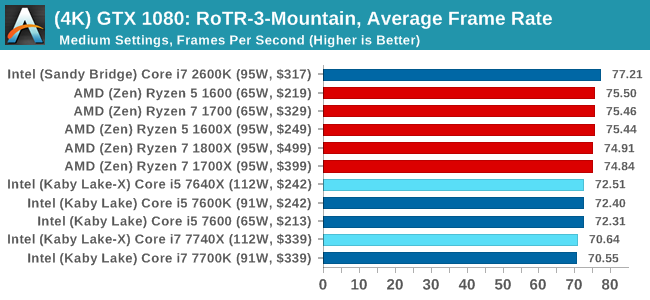
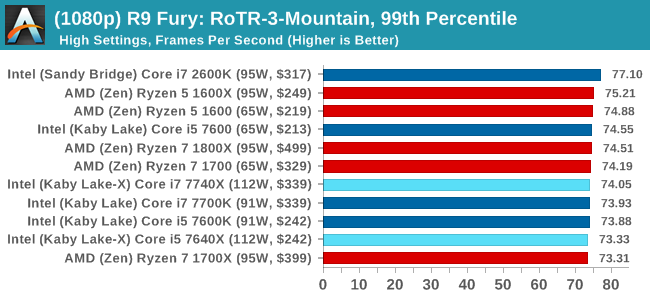
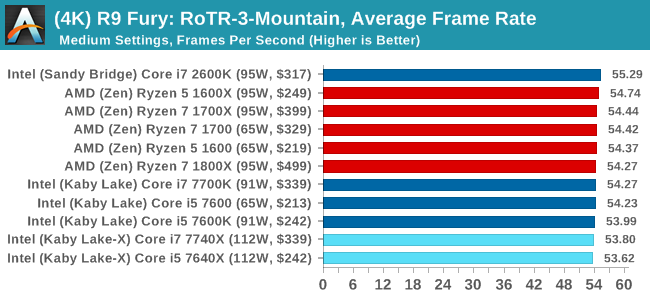
Again, we test at 1920x1080 and 4K using our native 4K displays. At 1080p we run the High preset, while at 4K we use the Medium preset which still takes a sizable hit in frame rate.
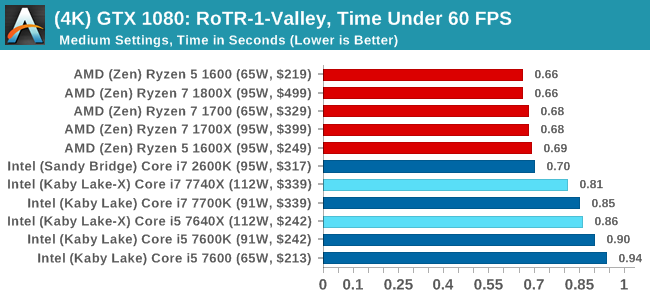
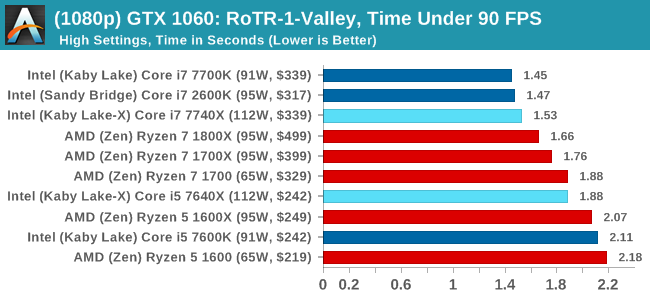
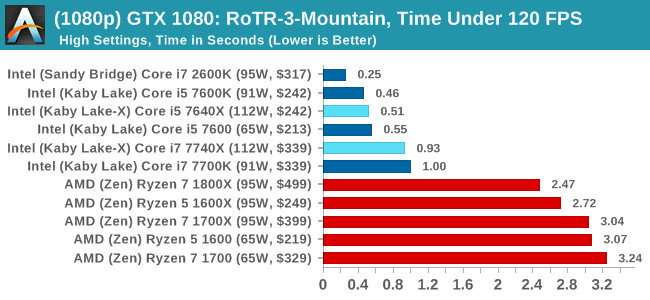
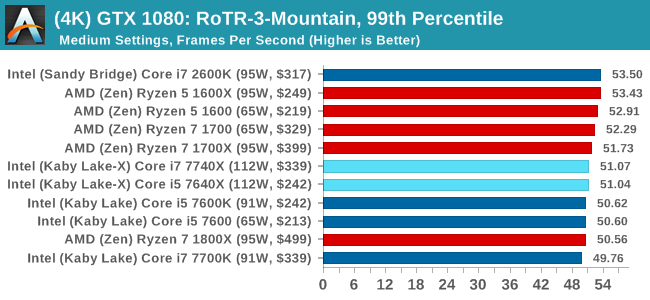
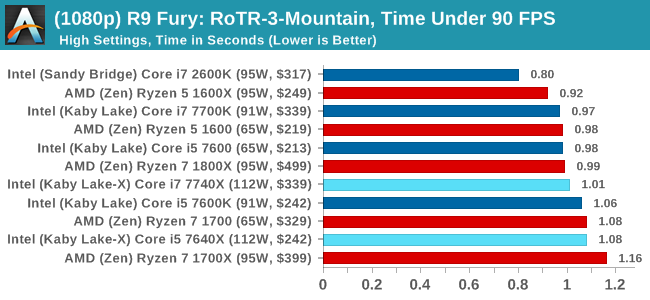
It is worth noting that RoTR is a little different to our other benchmarks in that it keeps its graphics settings in the registry rather than a standard ini file, and unlike the previous TR game the benchmark cannot be called from the command-line. Nonetheless we scripted around these issues to automate the benchmark four times and parse the results. From the frame time data, we report the averages, 99th percentiles, and our time under analysis.
For all our results, we show the average frame rate at 1080p first. Mouse over the other graphs underneath to see 99th percentile frame rates and 'Time Under' graphs, as well as results for other resolutions. All of our benchmark results can also be found in our benchmark engine, Bench.
#1 Geothermal Valley

MSI GTX 1080 Gaming 8G Performance
1080p
4K
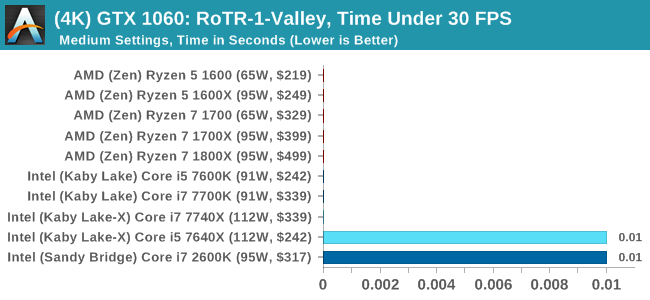
ASUS GTX 1060 Strix 6GB Performance
1080p
4K
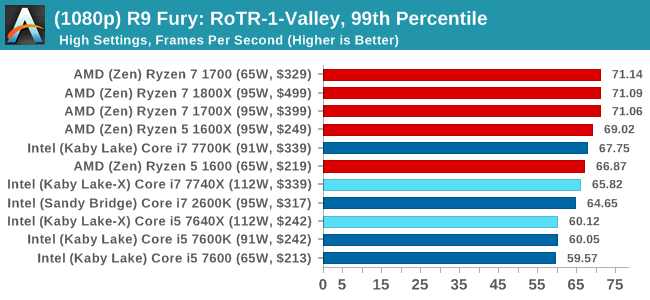
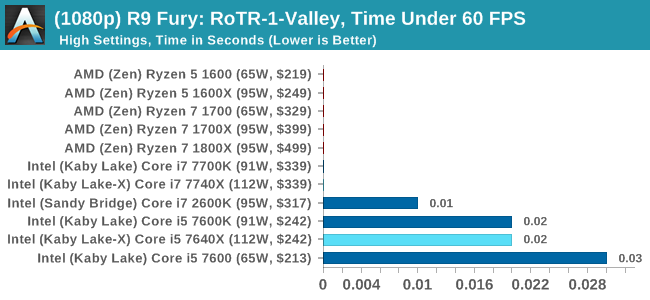
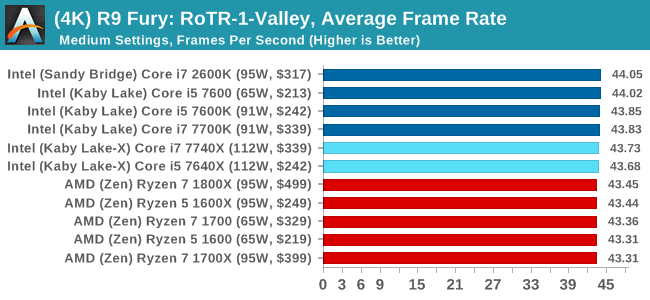
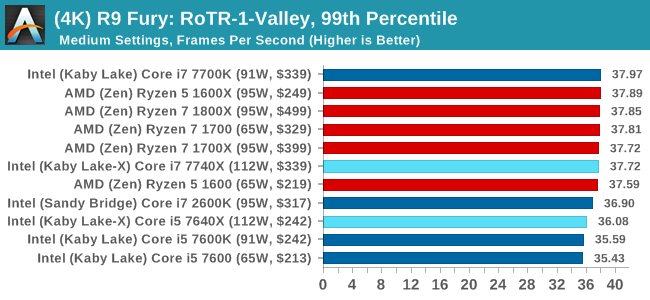
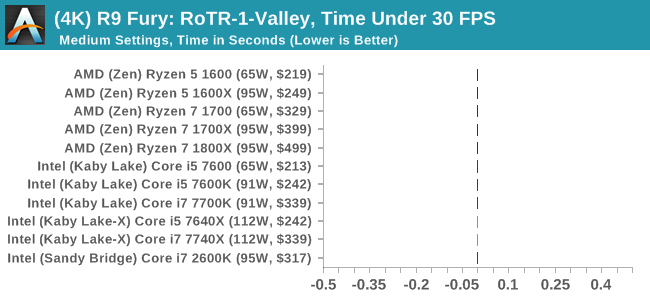
Sapphire R9 Fury 4GB Performance
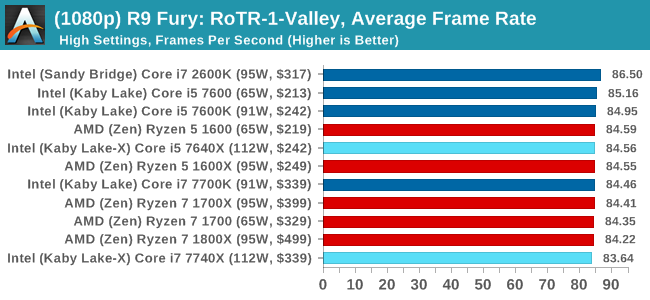
1080p
4K
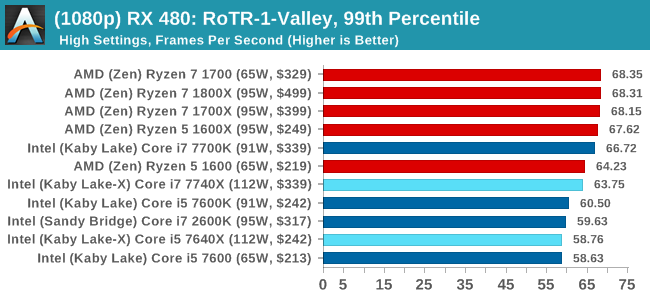
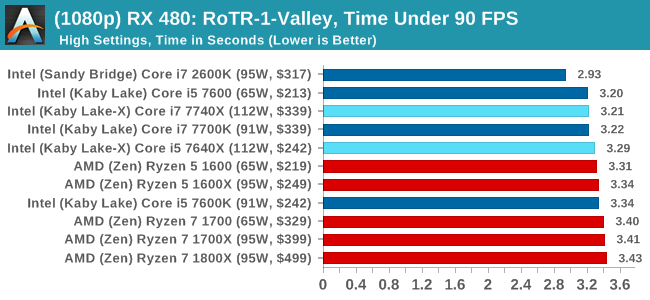
Sapphire RX 480 8GB Performance
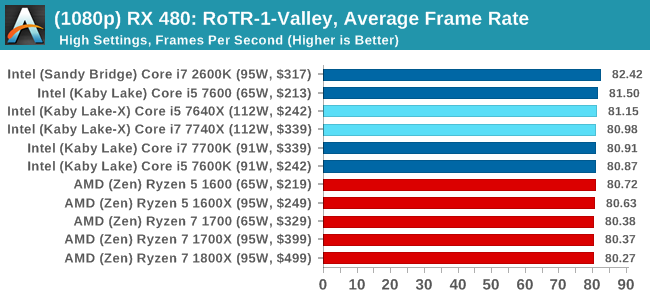
1080p
4K
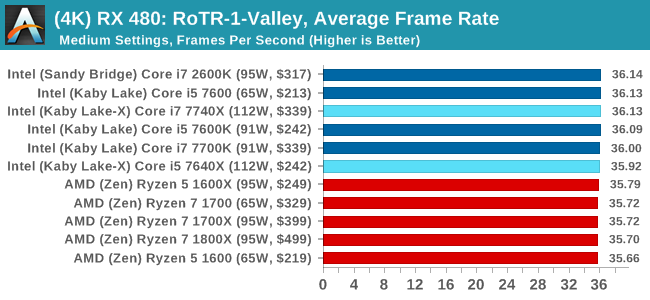
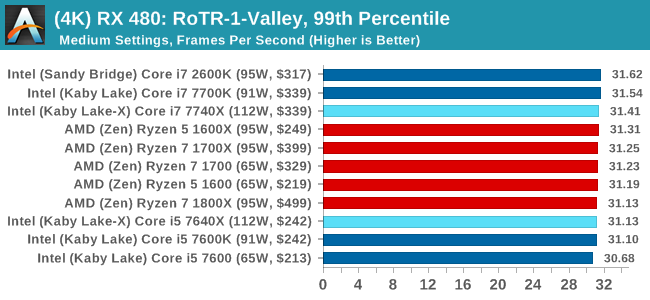
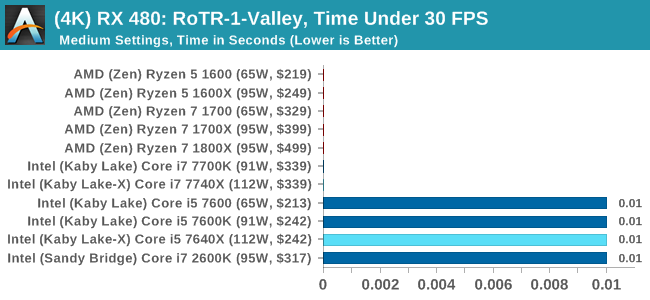
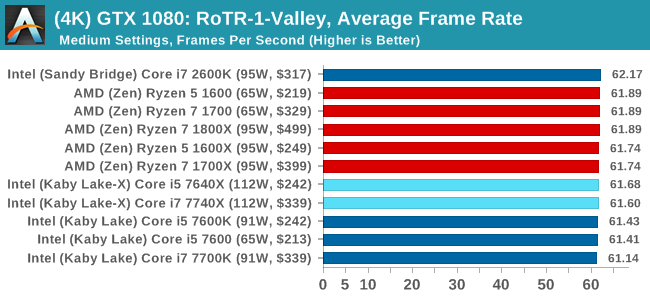
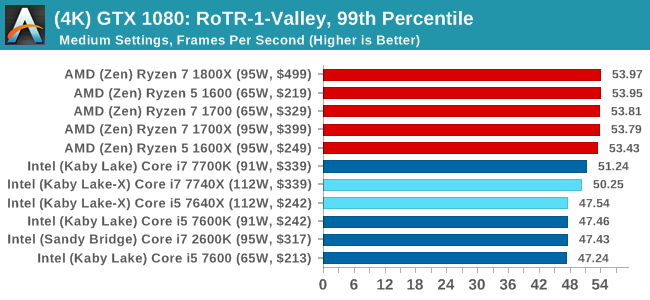
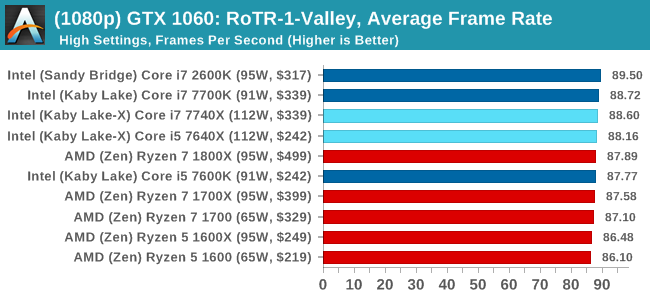
RoTR: Geothermal Valley Conclusions
If we were testing a single GTX 1080 at 1080p, you might think that the graph looks a little odd. All the quad-core, non HT processors (so, the Core i5s) get the best frame rates and percentiles on this specific test on this specific hardware by a good margin. The rest of the tests do not mirror that result though, with the results ping-ponging between Intel and AMD depending on the resolution and the graphics card.
#2 Prophet's Tomb
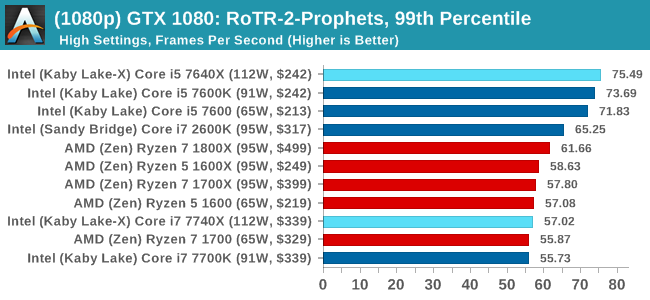
MSI GTX 1080 Gaming 8G Performance
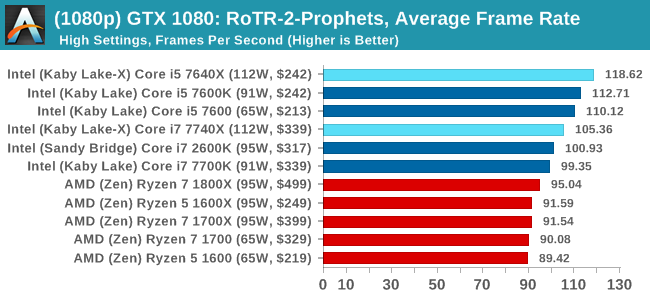
1080p
4K
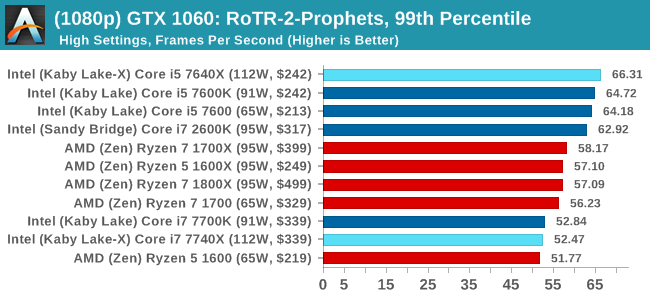
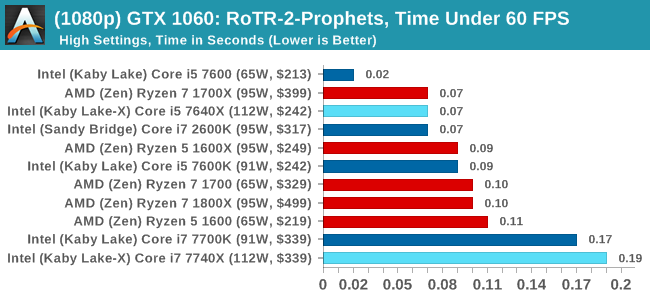
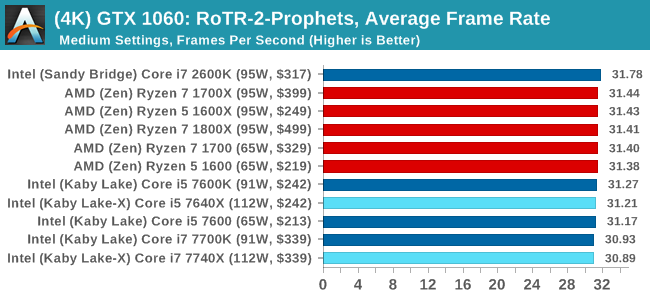
ASUS GTX 1060 Strix 6GB Performance
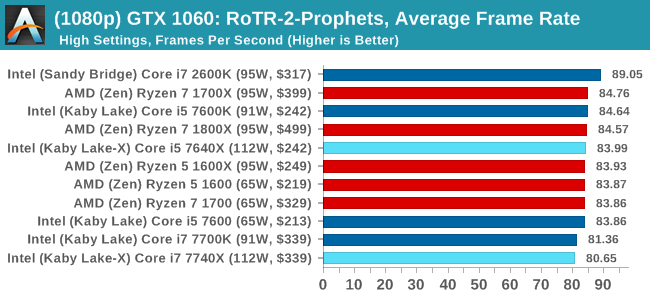
1080p
4K
Sapphire R9 Fury 4GB Performance
1080p
4K
Sapphire RX 480 8GB Performance
1080p
4K
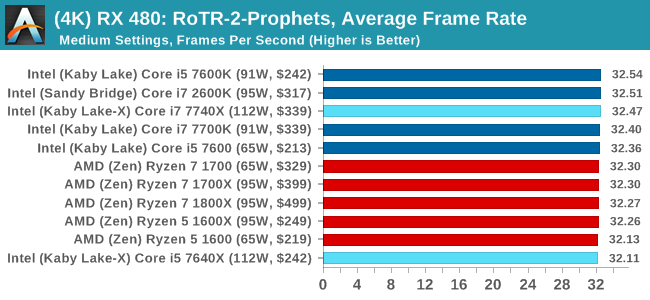
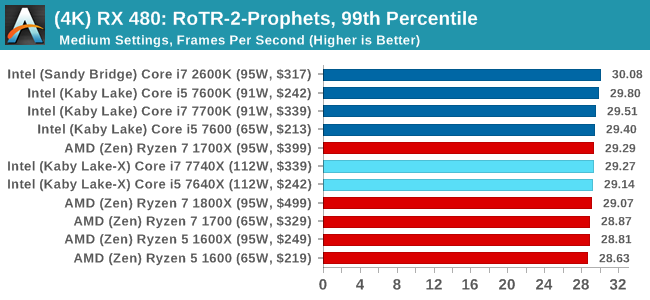
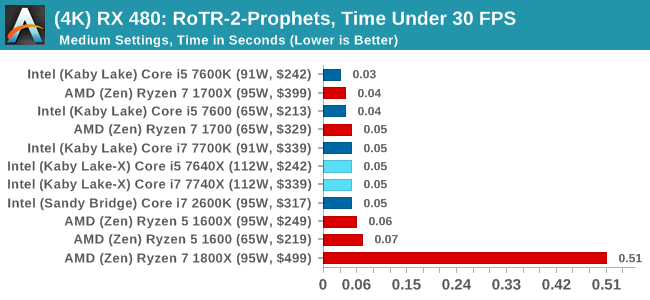
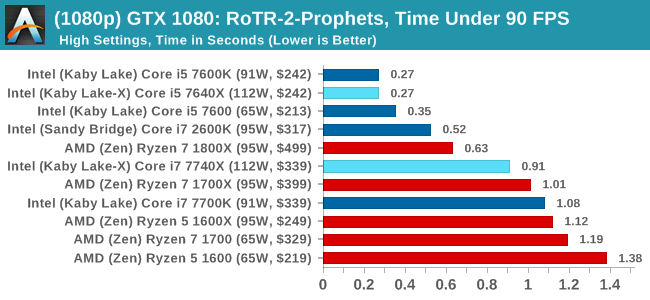
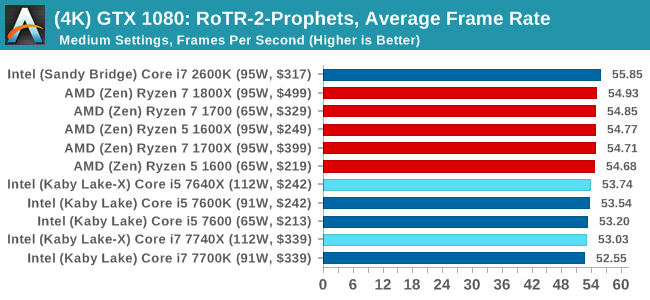
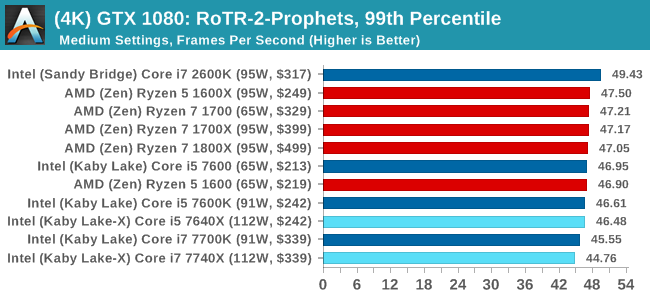
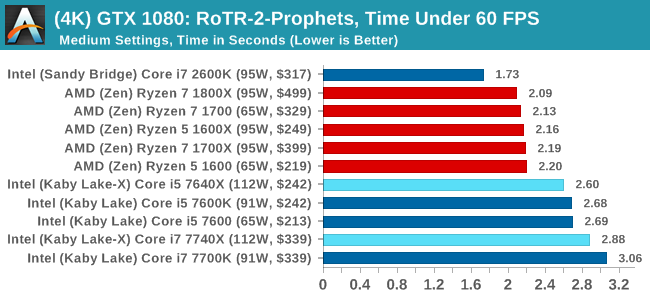
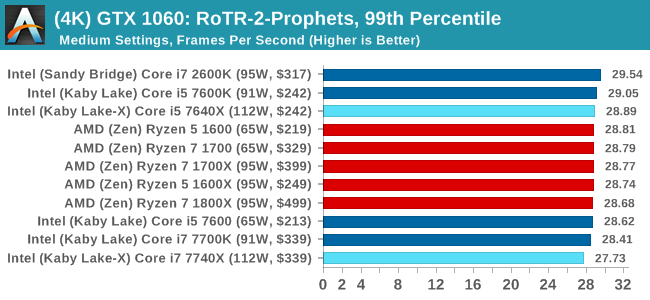
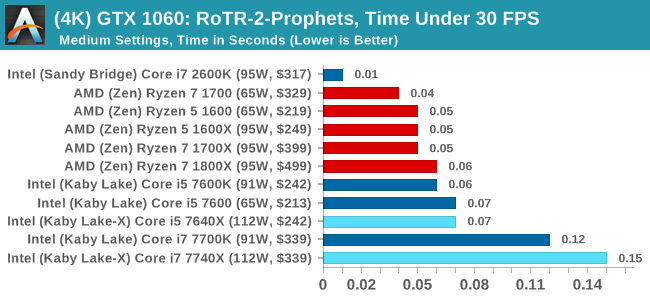
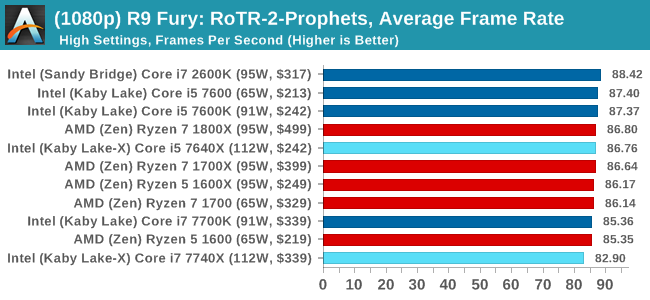
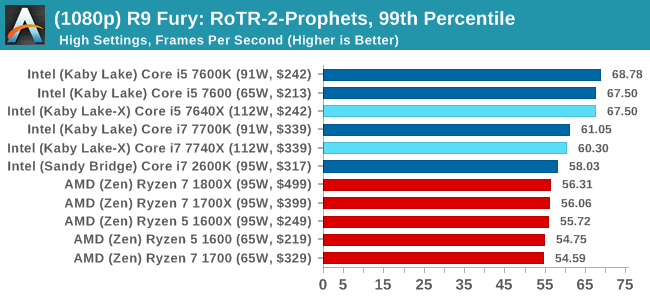
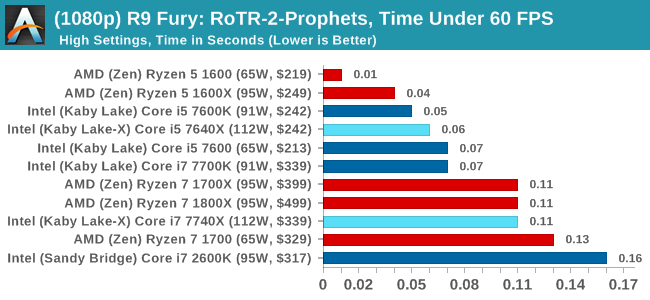
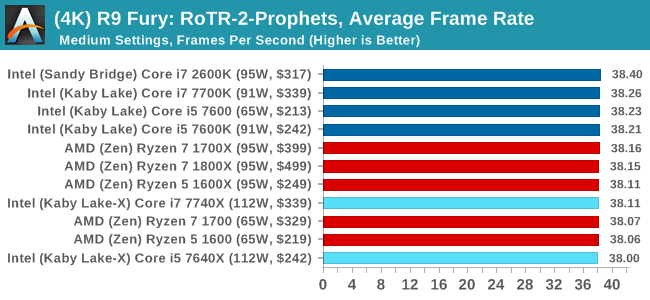
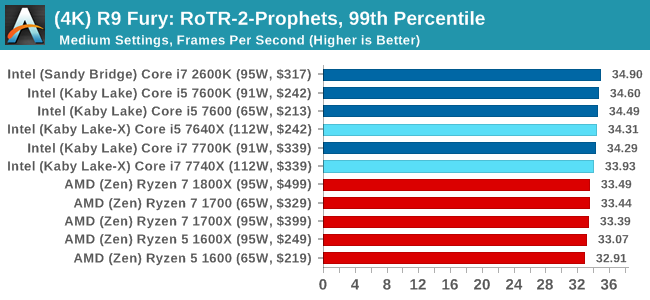
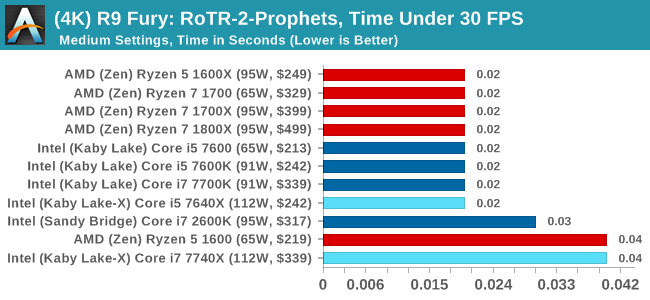
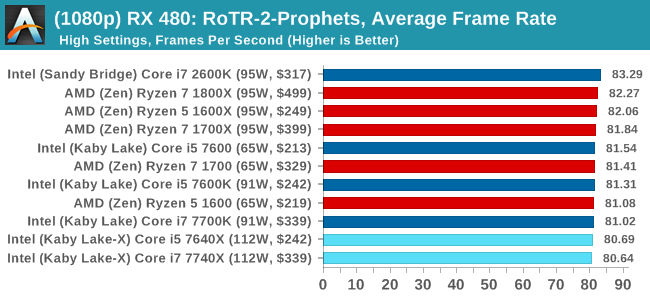
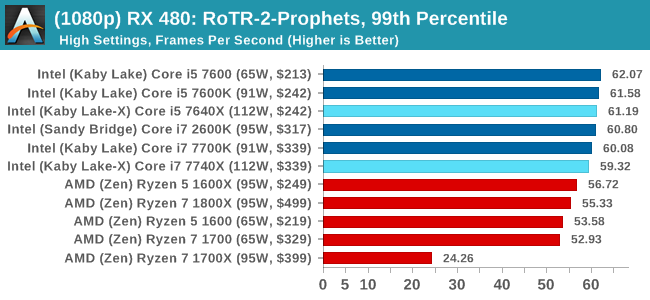
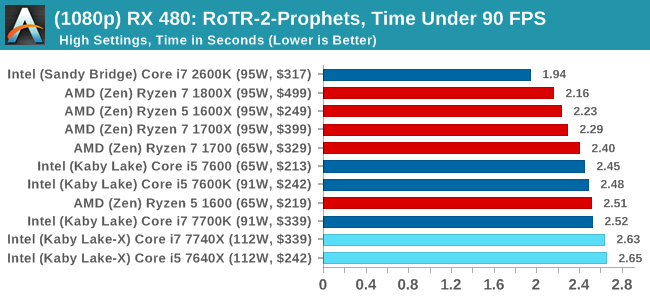
RoTR: Prophet's Tomb Conclusions
For Prophet's Tomb, we again see the Core i5s pull a win at 1080p using the GTX 1080, but the rest of the tests are a mix of results, some siding with AMD and others for Intel. There is the odd outlier in the Time Under analysis, which may warrant further inspection.
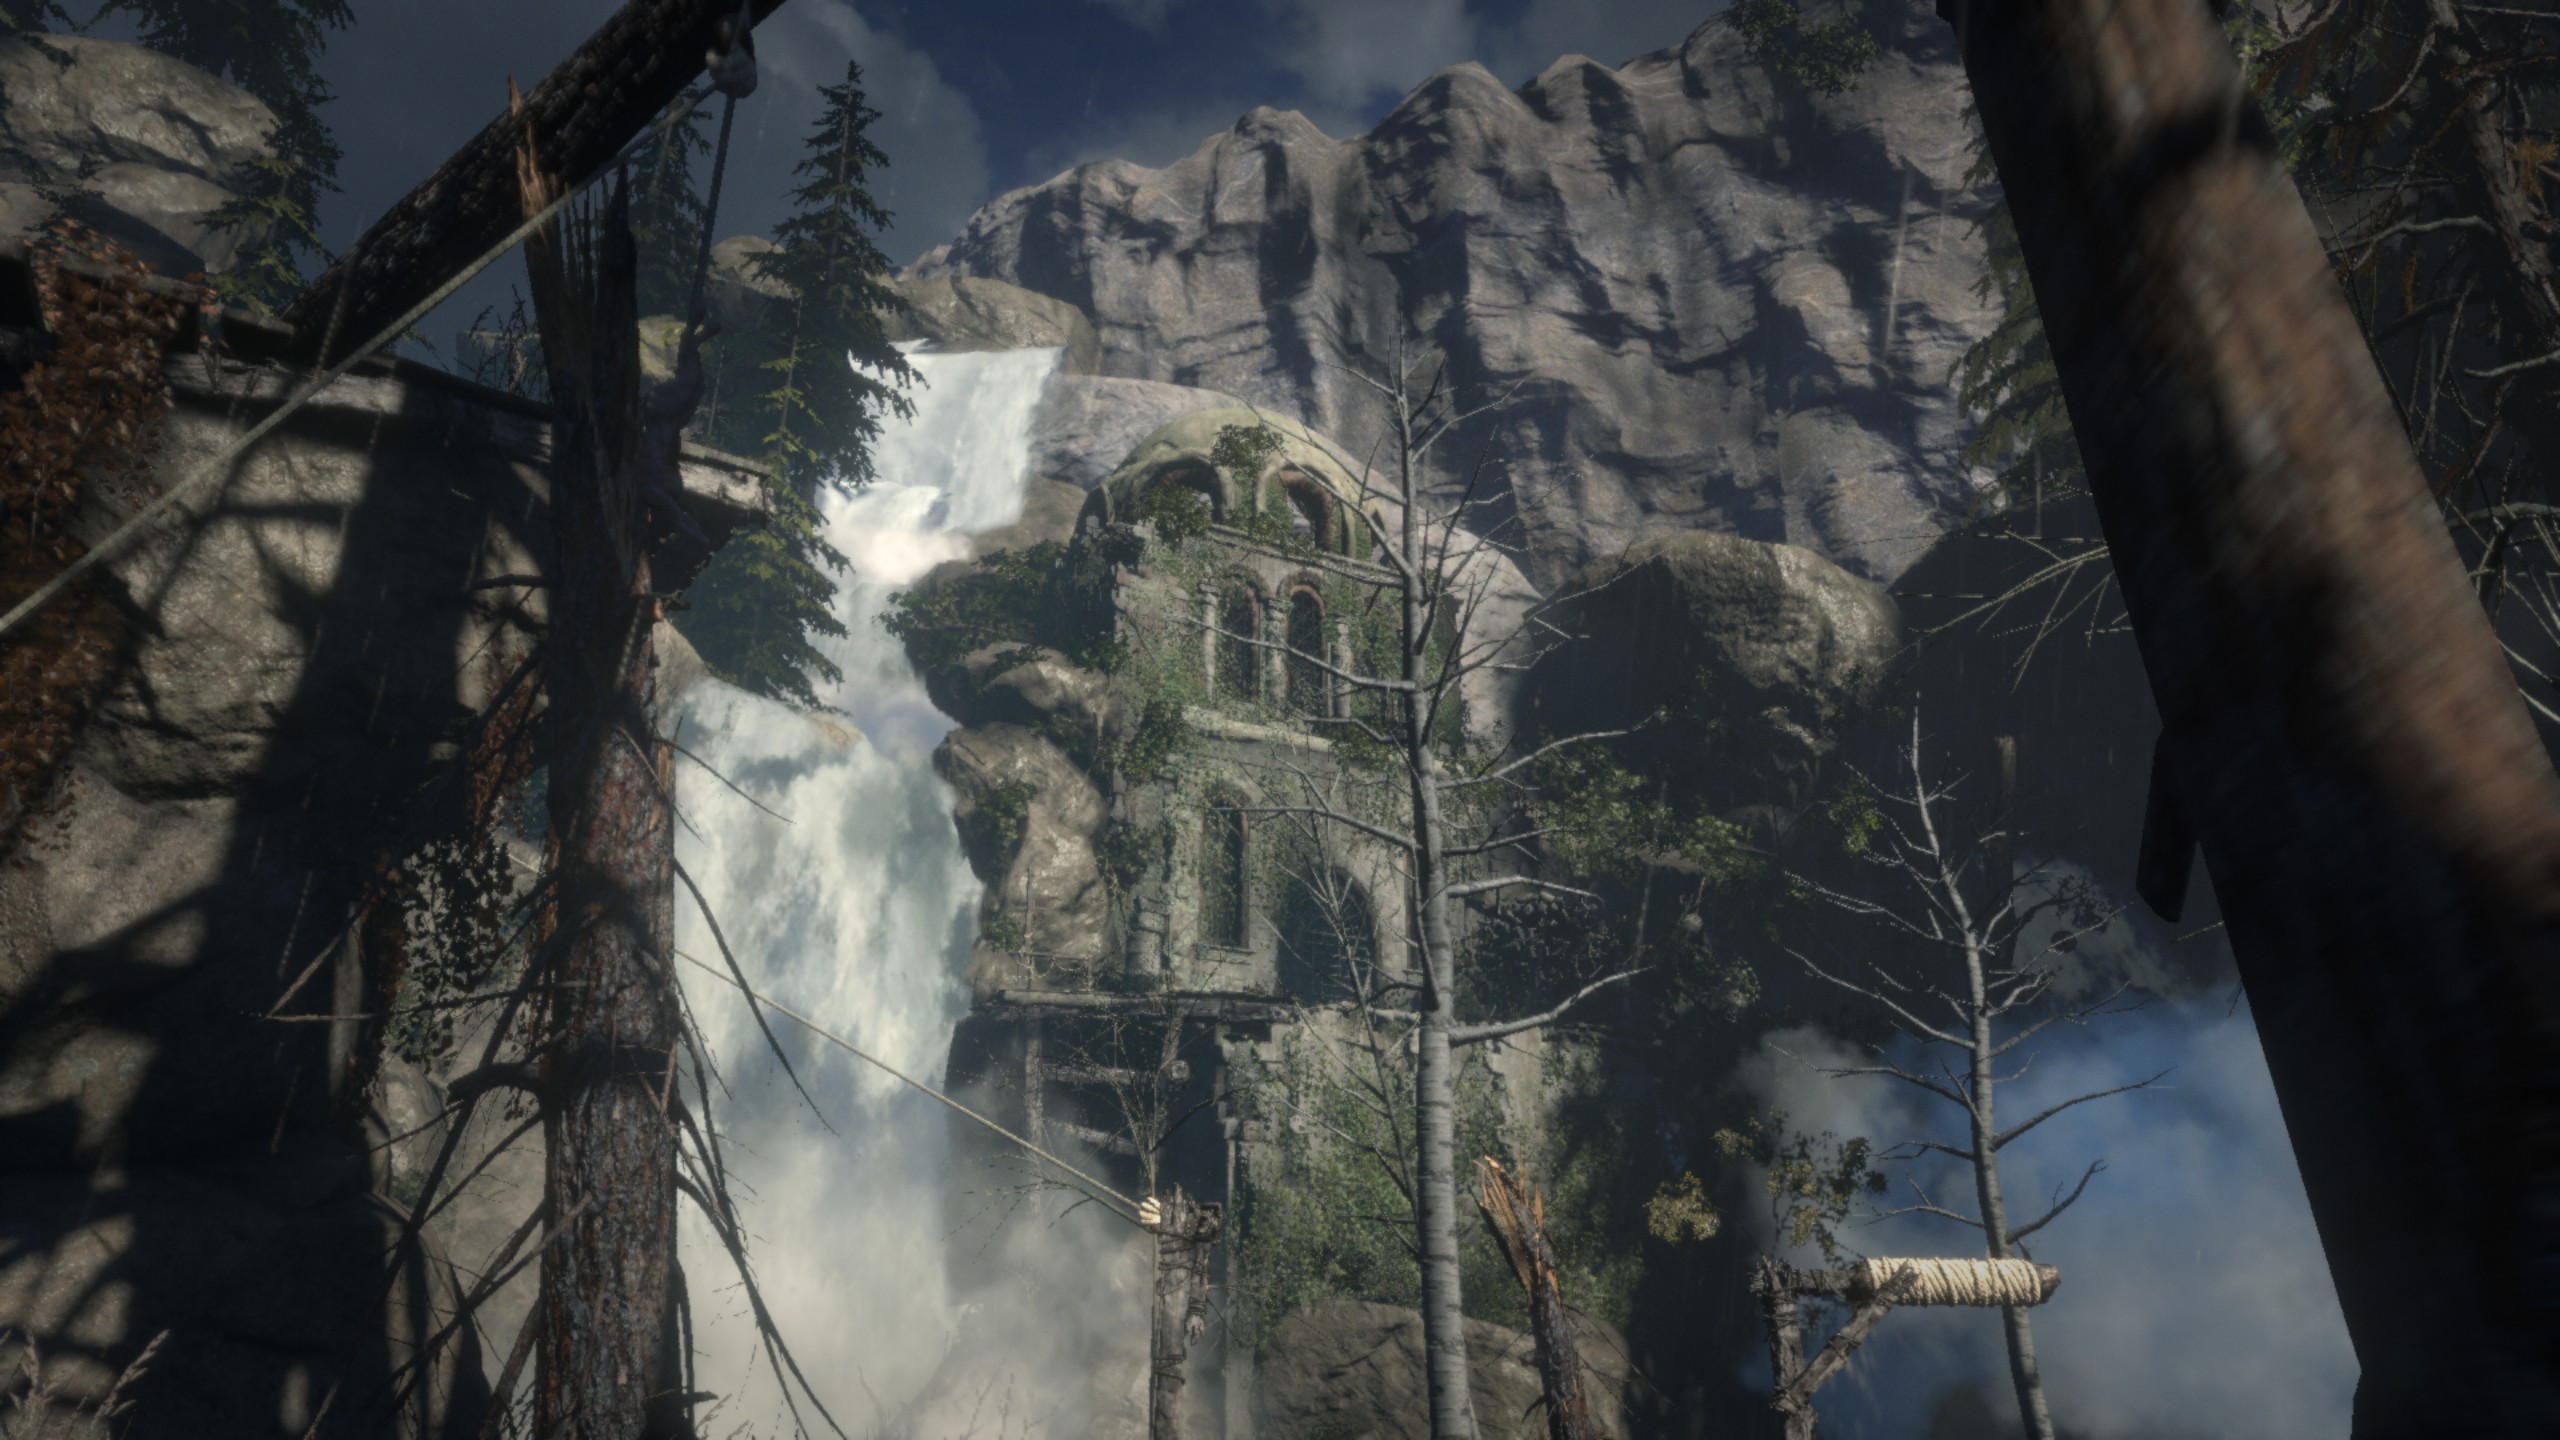
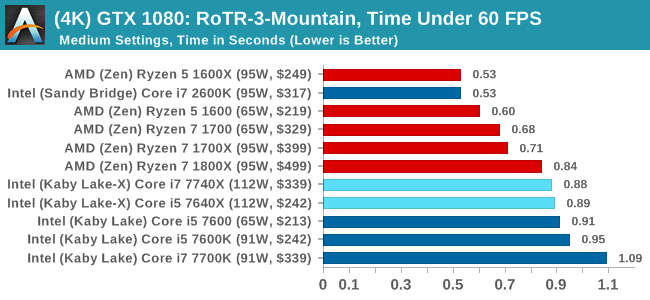
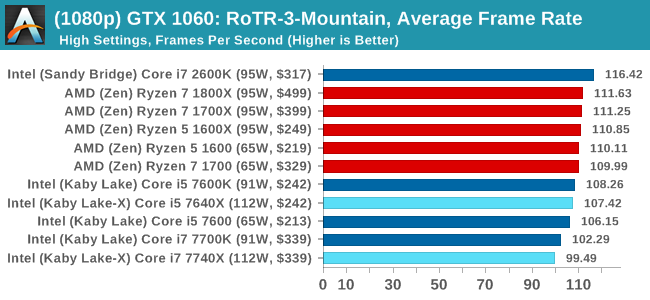
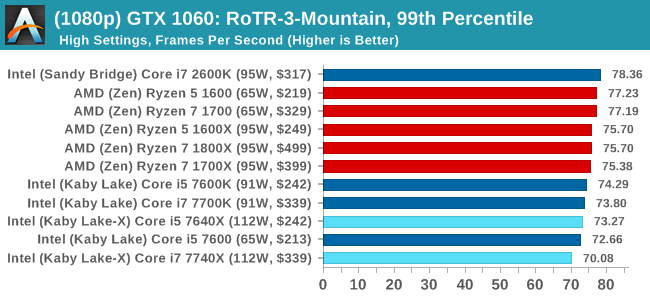
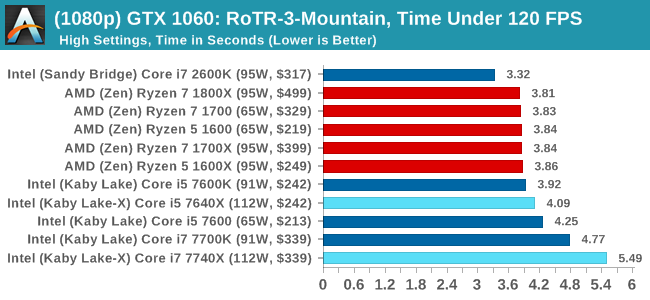
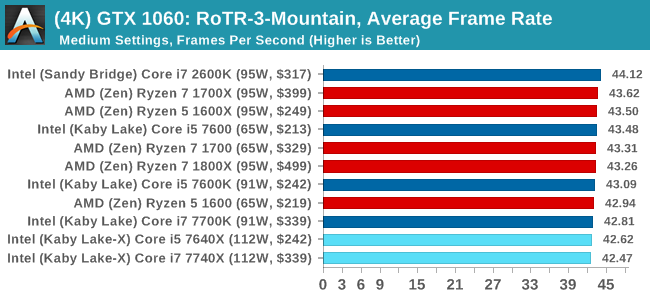
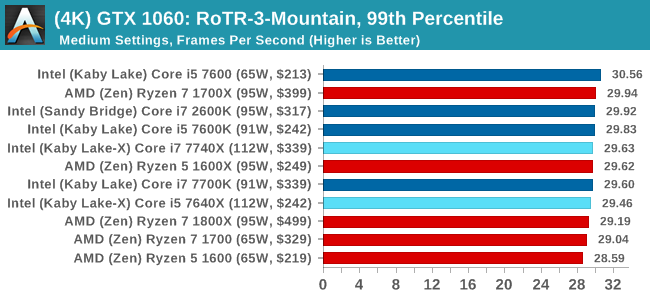
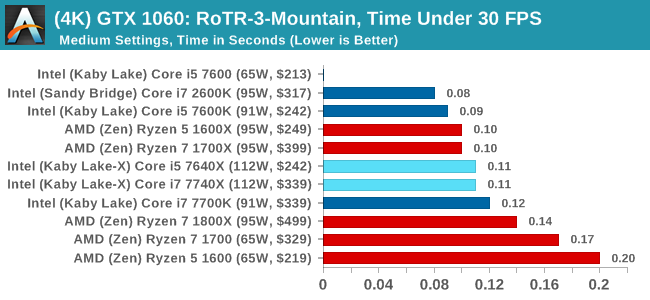
#3 Spine of the Mountain
MSI GTX 1080 Gaming 8G Performance
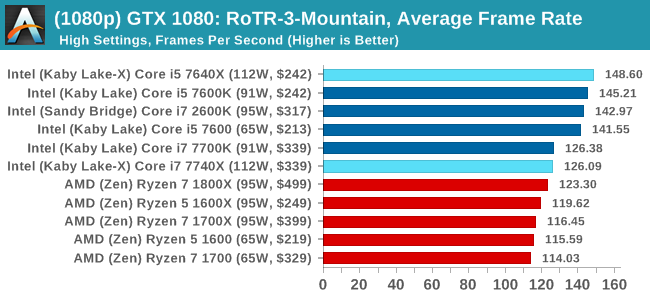
1080p
4K
ASUS GTX 1060 Strix 6GB Performance
1080p
4K
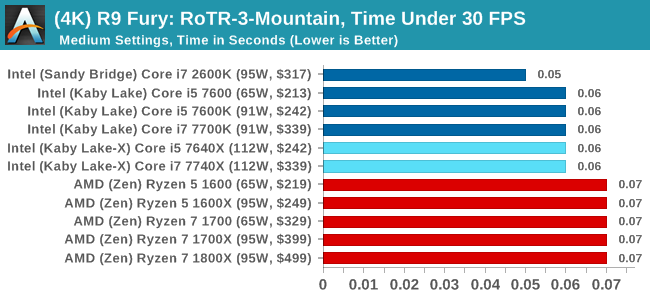
Sapphire R9 Fury 4GB Performance
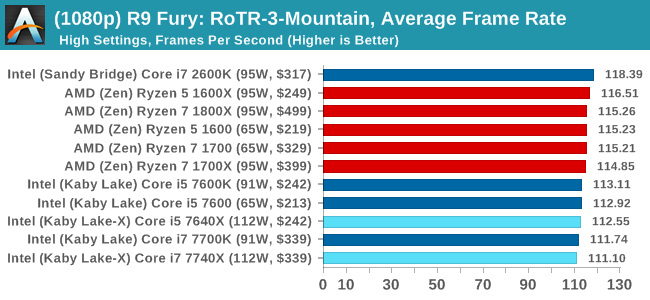
1080p
4K
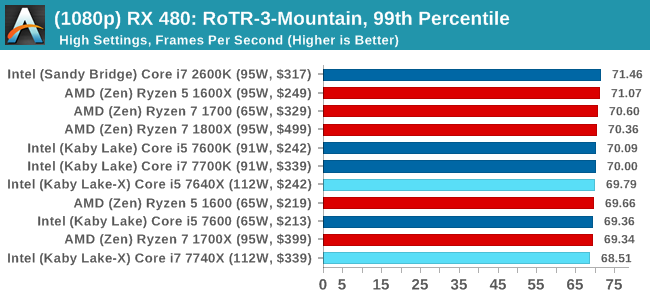
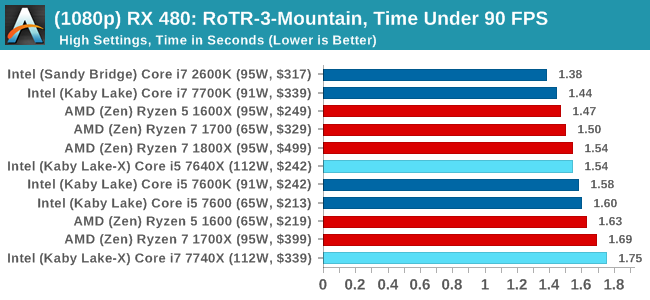
Sapphire RX 480 8GB Performance
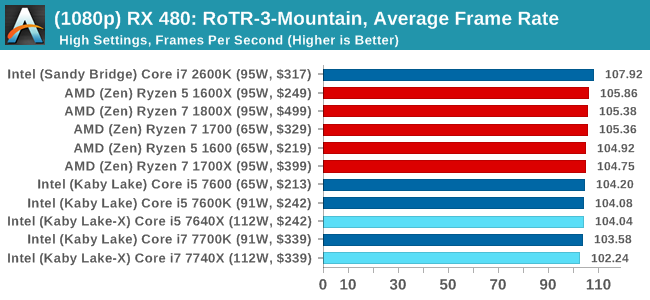
1080p
4K
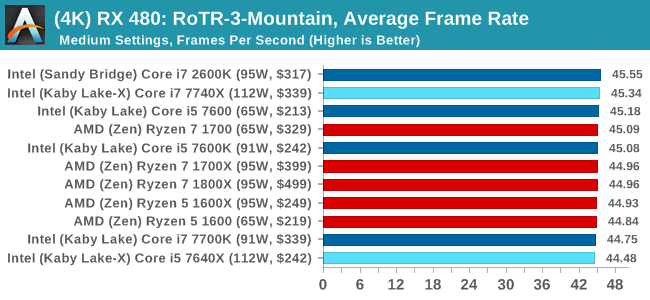
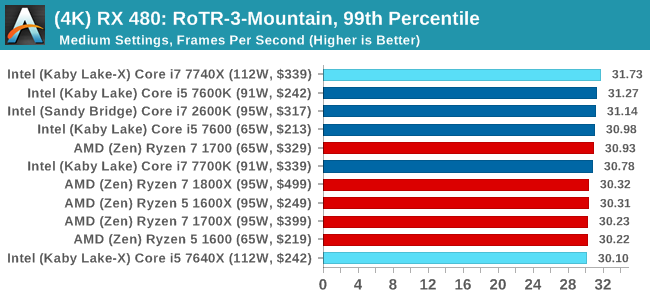
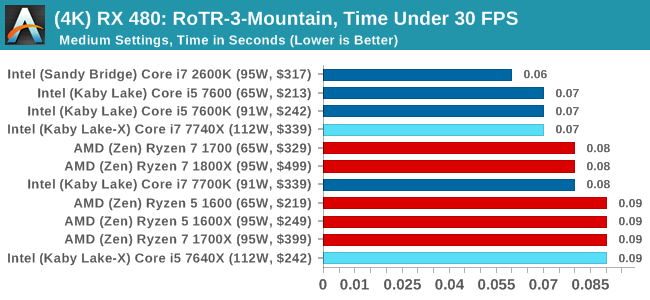
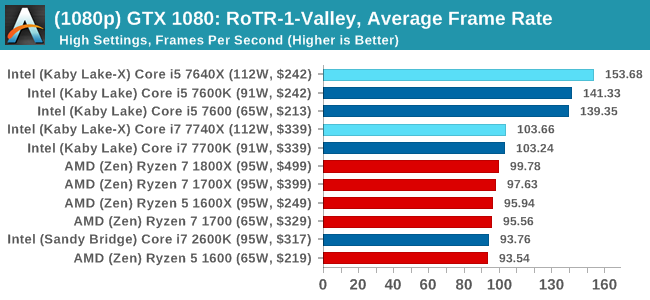
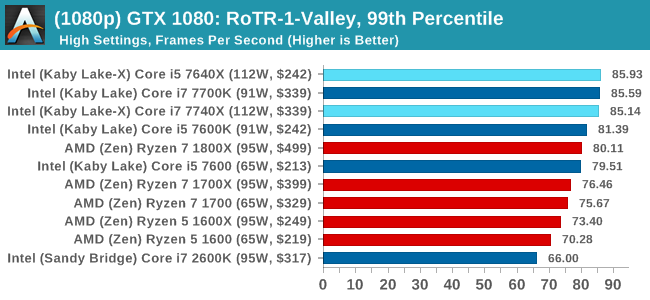
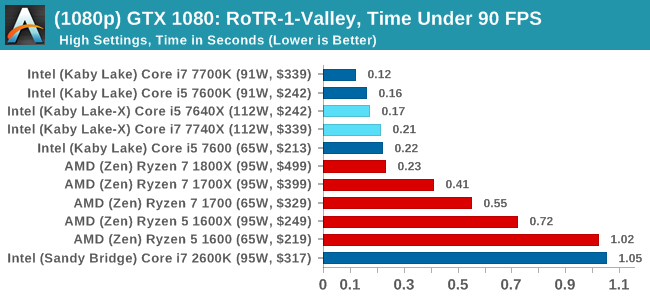
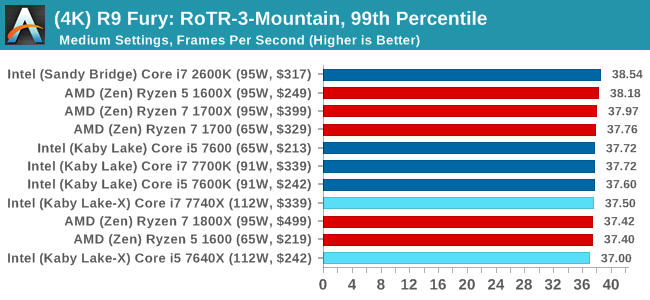
RoTR: Spine of the Mountain Conclusions
Core i5, we're assigning you to run at 1080p with a GTX 1080. That's an order. The rest of you, stand easy.


176 Comments
View All Comments
Gothmoth - Tuesday, July 25, 2017 - link
so why not test at 640x480... shifts the bottleneck even more to the cpu... you are kidding yourself.silverblue - Tuesday, July 25, 2017 - link
Not really. If the GPU becomes the bottleneck at or around 1440p, and as such the CPU is the limiting factor below that, why go so far down when practically nobody games below 1080p anymore?Zaxx420 - Monday, July 24, 2017 - link
"Over the last few generations, Intel has increased IPC by 3-10% each generation, making a 30-45% increase since 2010 and Sandy Bridge..."I have an old Sandy i5 2500K on an Asus Z68 that can do 5GHz all day on water and 4.8 on air. I know it's ancient IP...but I wonder if it could hold it's own vs a stock clocked Skylake i5? hmmmm...
hbsource - Tuesday, July 25, 2017 - link
Great review. Thanks.I think I've picked the best nit yet: On the Civ 6 page, you inferred that Leonard Nimoy did the voiceover on Civ 5 when he actually did it on Civ 4.
gammaray - Tuesday, July 25, 2017 - link
it's kind of ridiculous to see the Sandy bridge chip beating new cpus at 4k gaming...Zaxx420 - Tuesday, July 25, 2017 - link
Kinda makes me grin...I have an old Sandy i5 2500K on an Asus Z68 that can do 5GHz all day on water and 4.8 on air. I know it's ancient IP...but I wonder if it could hold it's own vs a stock clocked Skylake i5? hmmmm...
Mugur - Tuesday, July 25, 2017 - link
Much ado about nothing. So the best case for 7740 is Office applications or opening PDF files? The author seems to have lost the sight of the forest because of the trees.Some benchmarks are odd, some are useless in the context. I watched the YouTube version of this: https://www.techspot.com/review/1442-intel-kaby-la... and it looked like a more realistic approach for a 7740k review.
Gothmoth - Tuesday, July 25, 2017 - link
well i guess intel is putting more advertising money on anandtech.otherwise i cant´t explain how an overpriced product with heat problems and artificial crippled pci lanes on an enthusiast platform(!) can get so much praise without much criticism.
jabber - Tuesday, July 25, 2017 - link
I miss the days when you saw a new bunch of CPUs come out and the reviews showed that there was a really good case for upgrading if you could afford to. You know a CPU upgrade once or twice a year. Now I upgrade (maybe) once every 6-7 years. Sure it's better but not so much fun.Dragonstongue - Tuesday, July 25, 2017 - link
Intel wins for the IO and chipset, offering 24 PCIe 3.0 lanes for USB 3.1/SATA/Ethernet/storage, while AMD is limited on that front, having 8 PCIe 2.0 from the chipset.Funny that is, seeing as AM4 has 16 pci-e lanes available to it unless when go down the totem pole those lanes get segregated differently , even going from the above table Intel is offering 16 for x299not 24 as you put directly into words, so who wins in IO, no one, they both offer 16 lanes. Now if you are comparing via price, x299 is obviously a premium product, at least compare to current AM4 premium end which is x370 chipset, pretty even footing on the motherboards when compared similar "specs" comparing the best AMD will offer in the form of x399, it makes the best "specs" of x299 laughable.
AMD seems to NOT be shortchanging pci-e lanes, DRAM ability (or speed) functional, proper thermal interface used etc etc.
Your $ by all means, but seriously folks need to take blinders off, how much raw power is this "95w TDP" processors using when ramped to 5+Ghz, sure in theory it will be the fastest for per core performance, but how long will the cpu last running at that level, how much extra power will be consumed, what price of an acceptable cooler is needed to maintain it within thermal spec and so forth.
Interesting read, but much seems out of context to me. May not like it, but AMD has given a far better selection of product range this year for cpu/motherboard chipsets, more core, more threads, lots of IO connectivity options, fair pricing overall (the $ value in Canada greed of merchants does not count as a fault against AMD)
Am done.