The Intel Kaby Lake-X i7 7740X and i5 7640X Review: The New Single-Threaded Champion, OC to 5GHz
by Ian Cutress on July 24, 2017 8:30 AM EST- Posted in
- CPUs
- Intel
- Kaby Lake
- X299
- Basin Falls
- Kaby Lake-X
- i7-7740X
- i5-7640X
Power Consumption
With the two Kaby Lake-X processors, the main comparison for power consumption is going to be against their Kaby Lake-S counterparts on the mainstream platform. For an extra 100 MHz, Intel is moving from a 95W TDP to a 112W TDP, indicating that these processors will need better cooling – but when we tested KBL-S we were rather surprised by the power, especially on the Core i5.
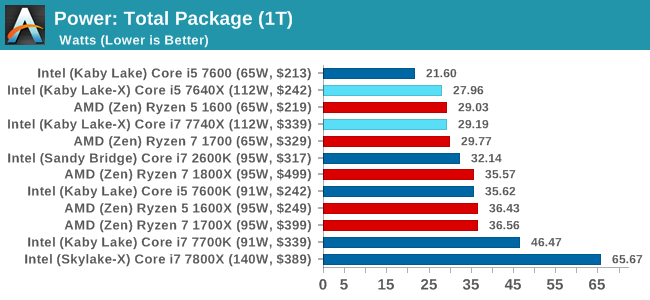
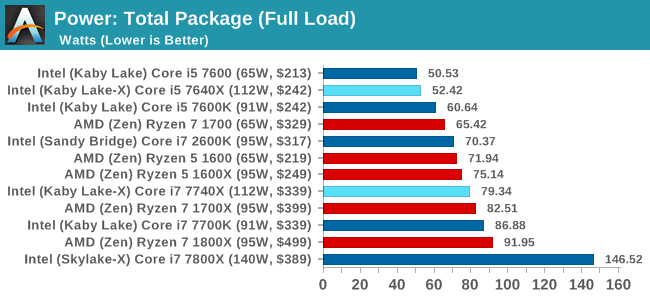
The Core i5-7640X almost perfectly matches up with its Core i5 counterparts, even beating the Core i5-7600K in every situation but especially at load. For users who want to overclock near to the official TDP, it looks like there’s some headroom (other circumstances permitting). The Core i7-7740X is noticeably more power hungry at full load, hitting 79W, but lower than the Core i7-7700K at 87W.
Overclocking to 5.0 GHz
One of the elements promoted at the launch of Basin Falls was overclockability: Intel ran a private invite-only extreme overclocking workshop with sub-zero coolants that week, which was then followed by ASUS and GIGABYTE both stepping it up another gear by using liquid helium rather than liquid nitrogen. For some of these chips, the colder the better, and liquid helium is going to be limit for cooling (and cost) as there is inherent difficulty in using sub-zero coolants for records.

Those sub-zero events for records are just on single benchmarks, or single frequency records, and are not meant to be run at those speeds all day every day. This makes the air and water overclocking potential of the CPUs more important for regular users and enthusiasts.
When Kaby Lake-S was launched, we saw good overclocking performance on the Core i7-7700K: our set of 4.2 GHz base processors reached a range between 4.6 to 4.8 GHz, arguably giving a 8-15% overclock and given some of the numbers we had seen in the wild, the consistency between the processors meant that most of the 7700K CPUs could reach that amount. One of the reasons for such good performance on these CPUs was that Intel had incorporated a new feature for overclocking, the AVX offset. This allows overclockers to reduce the frequency that AVX code runs at, as this can be a limiting factor when it comes to a stable overclock. This feature is in Kaby Lake-X as well.
The end result is that the Core i7-7740X went one further in our testing, and hit 5.0 GHz all-cores at 1.25V, and completed our CPU testing suite with a -10 AVX offset. We went for 5.1 GHz all-core, up to 1.35 volts, but the temperatures were getting high and the system was still not stable. 5.0 GHz is a very respectable result, even if we only have a sample of one.
The results at 5.0 GHz are as follows. Gain is absolute for the benchmark for the 5.0 GHz value, with anything within 2.0% listed in orange. Green indicates a win for the faster chip.
| Comparison: Intel Core i7-7740X at Stock vs 5 GHz | |||
| 4.3 GHz Base 4.5 GHz Turbo Auto AVX |
5.0 GHz Base 5.0 GHz Turbo 4.0 GHz AVX |
||
| Score / Time | Web Benchmarks | Score / Time | Gain |
| 135 ms | Sunspider | 133 ms | +1.6% |
| 622 ms | Kraken | 642 ms | -3.1% |
| 45485 | Octane | 45279 | -0.5% |
| 561 | WebXPRT15 | 570 | +1.5% |
| System Tests | |||
| 2229 ms | PDF Opening | 2055 ms | +8.5% |
| 46.172 s | FCAT | 45.656 s | +1.1% |
| 1287 | 3DPM 2.1 | 1429 | +11.0% |
| 282 s | Dolphin v5 | 280 s | +0.7% |
| 891.56 s | Agisoft Total | 830.06 s | +7.4% |
| Rendering | |||
| 2474593 | Corona | 2660002 | +7.5% |
| 436 s | Blender | 485 s | -10.1% |
| 195 | Cinebench 15 ST | 215 | +10.6% |
| 986 | Cinebench 15 MT | 1084 | +10.0% |
| Encoding | |||
| 27433 | 7-zip | 29433 | +8.9% |
| 48.698 s | WinRAR | 46.633 s | +4.4% |
| 5.5 GB/s | AES | 6.2 GB/s | +12.7% |
| 25.2 FPS | Handbrake HEVC | 22.6 FPS | -10.2% |
| Office Tests | |||
| 4878 | PCMark8 Creative | 5084 | +4.2% |
| 4844 | PCMark8 Home | 5071 | +4.7% |
| 4110 | PCMark8 Work | 3984 | +3.2% |
| 19.45 per day | Chrome Compile | 17.70 per day | -9.0% |
| GTX 1080 | |||
| 72.56 FPS | 1080p Ashes Av | 76.19 FPS | +4.8% |
| 53.95 FPS | 1080p Ashes 99% | 55.45 FPS | +2.7% |
| 62.30 FPS | 4K Ashes Av | 63.46 FPS | +1.8% |
| 41.24 FPS | 4K Ashes 99% | 40.79 FPS | -1.1% |
| 103.66 FPS | 1080p RoTR-1 Av | 106.9 FPS | +3.0% |
| 85.14 FPS | 1080p RoTR-1 99% | 85.88 FPS | +0.9% |
| 61.60 FPS | 4K RoTR-1 Av | 61.33 FPS | -0.4% |
| 50.25 FPS | 4K RoTR-1 99% | 50.43 FPS | +0.3% |
There are a few obvious trends, and a couple of red flags. Most benchmarks split themselves into two groups: benchmarks with a heavy CPU component tend to get a 4-12% gain when overclocked, and those that require a lot of DRAM involvement or AVX tend to be in the 2% region. The red flags are the three big 9-10% loss values for CPU heavy benchmarks, Blender, Handbrake HEVC and Chrome Compilation.
All three benchmarks are sizable workloads with sustained high frequencies throughout, and have heavy AVX components as well. The 4.0 GHz setting for AVX could account for most of that difference, however other AVX benchmarks in our testing (Corona, Cinebench, elements of PCMark, Agisoft) do not have the same effect. The only real difference here is time: the amount of time each benchmark stays at a sustained load.
The three that had the biggest dips are our longest benchmarks: Blender at 8 minutes, Handbrake HEVC at 25 minutes, and the Chrome Compile at over an hour. In this case it seems we are hitting thermal limits for the power delivery, as explained by Igor Wallossek over at Tom's Hardware. He tested an upcoming theory that the early X299 boards are not up to the task for cooling VRMs at heavy load, and through analysis he determined that this was likely to occur in heavily overclocked scenarios. His data showed that the Skylake systems he tested, when overclocked, would hit thermal limits, come back down, and then ramp up again in a cyclical manner. He tested Skylake-X, which draws a lot more power overclocked than our KBL-X setup here, so it likely isn't affecting our setup as much, but still enough for certain benchmarks. I fully suspect we will see second-wave X299 motherboards with substantial heatsinks on the power delivery to overcome this.
More testing is needed, especially in upcoming X299 motherboard reviews. We used an early X299 prototype for our CPU testing here, and a Gaming 9 motherboard on the GPU tests (which showed little variation and no problems). We did take power numbers for this setup but when looking back on the results, they seemed off so we need to go back and re-test those.


176 Comments
View All Comments
mapesdhs - Monday, July 24, 2017 - link
2700K, +1.5GHz every time.shabby - Monday, July 24, 2017 - link
So much for upgrading from a kbl-x to skl-x when the motherboard could fry the cpu, nice going intel.Nashiii - Monday, July 24, 2017 - link
Nice article Ian. What I will say is I am a little confused around this comment:"Intel wins for the IO and chipset, offering 24 PCIe 3.0 lanes for USB 3.1/SATA/Ethernet/storage, while AMD is limited on that front, having 8 PCIe 2.0 from the chipset."
You forgot to mention the AMD total PCI-E IO. It has 24 PCI-E 3.0 lanes with 4xPCI-e 3.0 going to the chipset which can be set to 8x PCI-E 2.0 if 5Gbps is enough per lane, i.e in the case of USB3.0.
I have read that Kabylake-X only has 16 PCI-E 3.0 lanes native. Not sure about PCH support though...
KAlmquist - Monday, July 24, 2017 - link
With Kabylake-X, the only I/O that doesn't go through the chipset is the 16 PCI-E 3.0 lanes you mention. With Ryzen, in addition to what is provided by the chipset, the CPU provides1) Four USB 3.1 connections
2) Two SATA connections
3) 18 PCI-E 3.0 lanes, or 20 lanes if you don't use the SATA connections
So if you just look at the CPU, Ryzen has more connectivity than Kabylake-X, but the X299 chip set used with Kabylake-X is much more capable (and expensive) than anything in the AMD lineup. Also, the X299 doesn't provide any USB 3.1 ports (or more precisely, 10 gb per second speed ports), so those are typically provided by a separate chip, adding to the cost of X299 motherboards.
Allan_Hundeboll - Monday, July 24, 2017 - link
Interesting review with great benchmarks. (I don't understand why so many reviews only report average frames pr. second)The ryzen r5 1600 seems to offer great value for money, but i'm a bit puzzled why the slowest clocked R5 beats the higher clocked R7 in a lot of the 99% benchmarks, Im guessing its because the latency delta when moving data from one core to another penalize the higher core count R7 more?
BenSkywalker - Monday, July 24, 2017 - link
The gaming benchmarks are, uhm..... pretty useless.Third tier graphics cards as a starting point, why bother?
Seems like an awful lot of wasted time. As a note you may want to consider- when testing a new graphics card you get the fastest CPU you can so we can see what the card is capable of, when testing a new CPU you get the fastest GPU you can so we can see what the CPU is capable of. The way the benches are constructed, pretty useless for those of us that want to know gaming performance.
Tetsuo1221 - Monday, July 24, 2017 - link
Benchmarking at 1080p... enough said.. Completely and utterly redundantQasar - Tuesday, July 25, 2017 - link
why is benchmarking @ 1080p Completely and utterly redundant ?????meacupla - Tuesday, July 25, 2017 - link
I don't know that guy's particulars, but, to me, using X299 to game at 1080p seems like a waste.If I was going to throw down that kind of money, I would want to game at 1440p or 4K
silverblue - Tuesday, July 25, 2017 - link
Yes, but 1080p shifts the bottleneck towards the CPU.