The Intel Kaby Lake-X i7 7740X and i5 7640X Review: The New Single-Threaded Champion, OC to 5GHz
by Ian Cutress on July 24, 2017 8:30 AM EST- Posted in
- CPUs
- Intel
- Kaby Lake
- X299
- Basin Falls
- Kaby Lake-X
- i7-7740X
- i5-7640X
Shadow of Mordor
The next title in our testing is a battle of system performance with the open world action-adventure title, Middle Earth: Shadow of Mordor (SoM for short). Produced by Monolith and using the LithTech Jupiter EX engine and numerous detail add-ons, SoM goes for detail and complexity. The main story itself was written by the same writer as Red Dead Redemption, and it received Zero Punctuation’s Game of The Year in 2014.

A 2014 game is fairly old to be testing now, however SoM has a stable code and player base, and can still stress a PC down to the ones and zeroes. At the time, SoM was unique, offering a dynamic screen resolution setting allowing users to render at high resolutions that are then scaled down to the monitor. This form of natural oversampling was designed to let the user experience a truer vision of what the developers wanted, assuming you had the graphics hardware to power it but had a sub-4K monitor.
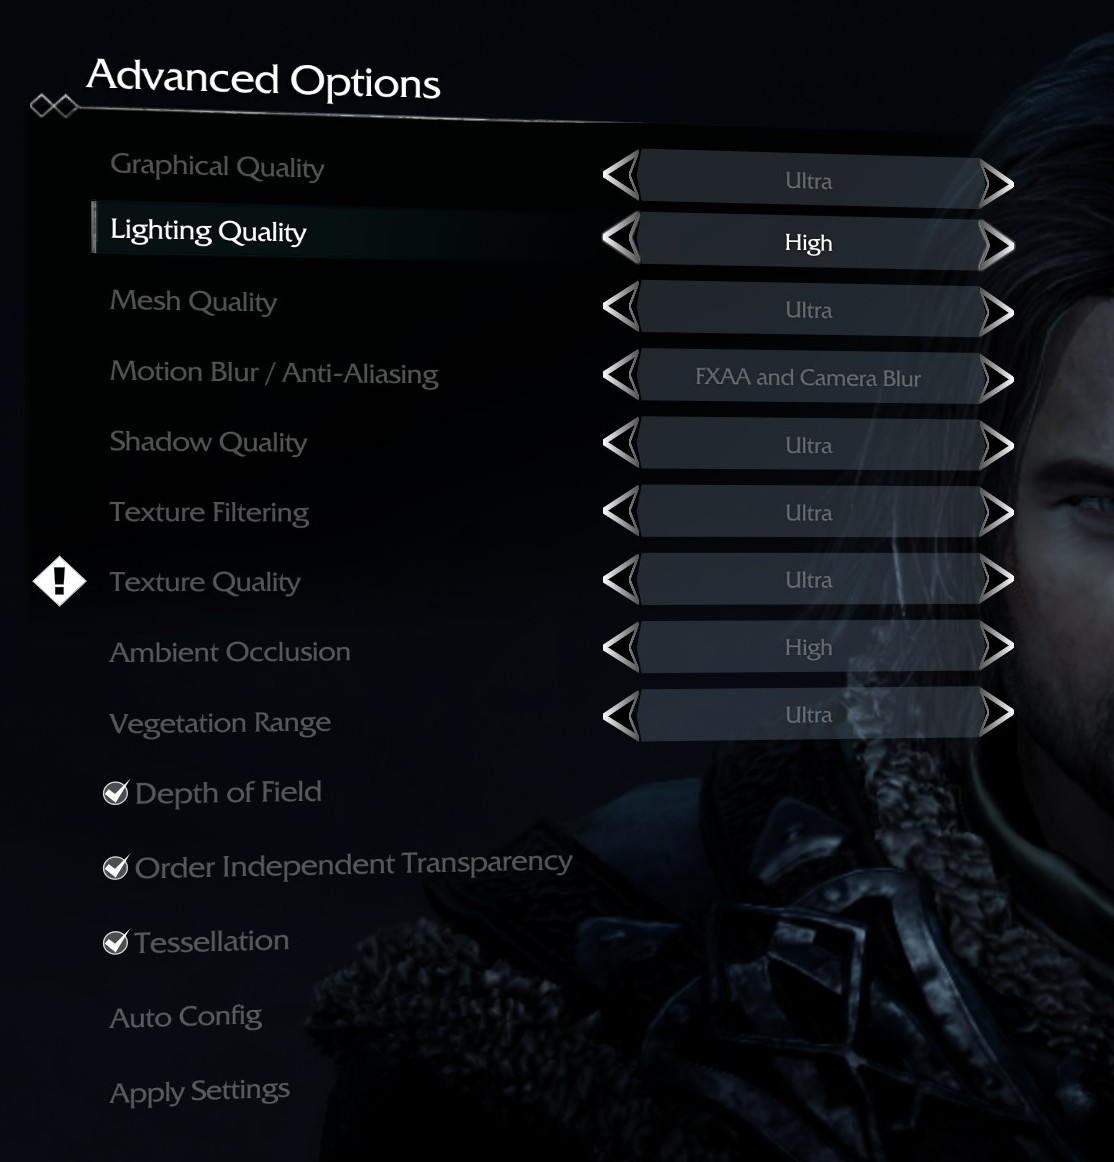
The title has an in-game benchmark, for which we run with an automated script implement the graphics settings, select the benchmark, and parse the frame-time output which is dumped on the drive. The graphics settings include standard options such as Graphical Quality, Lighting, Mesh, Motion Blur, Shadow Quality, Textures, Vegetation Range, Depth of Field, Transparency and Tessellation. There are standard presets as well.
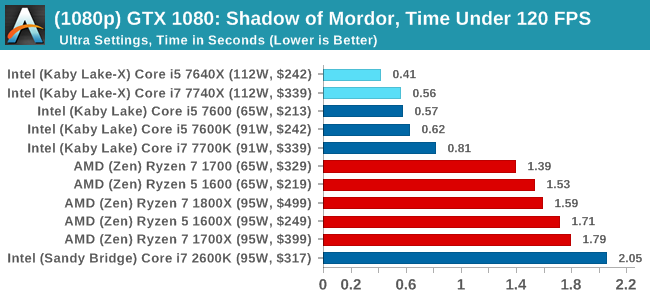
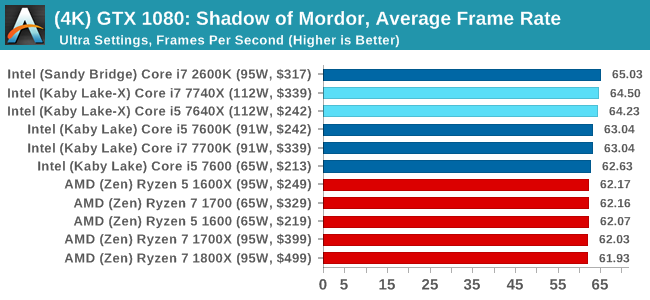
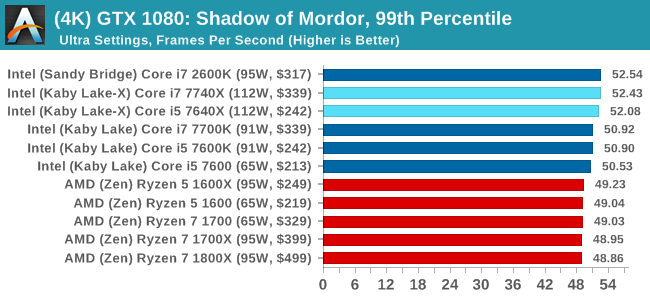
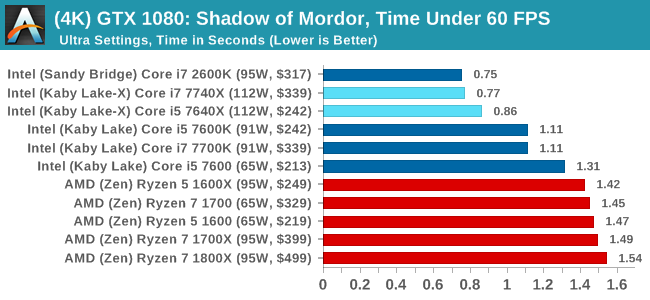
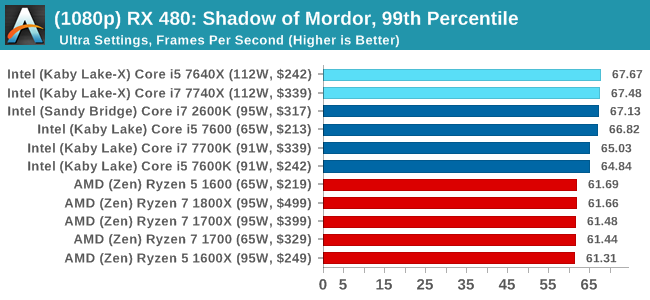
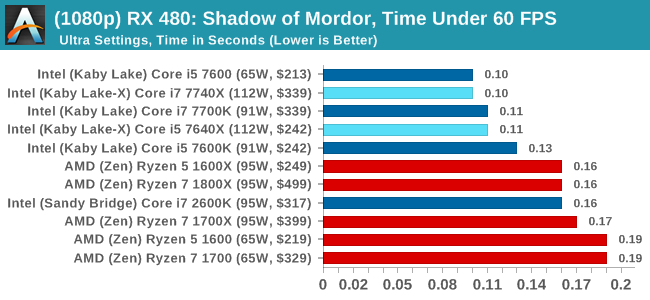
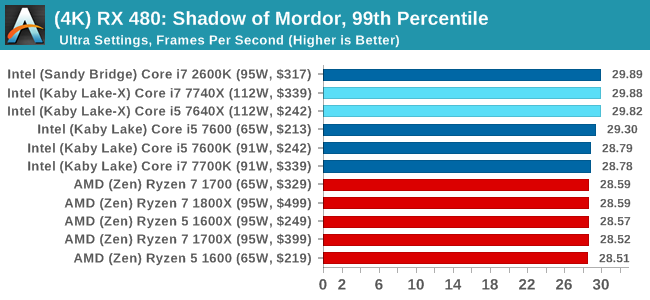
We run the benchmark at 1080p and a native 4K, using our 4K monitors, at the Ultra preset. Results are averaged across four runs and we report the average frame rate, 99th percentile frame rate, and time under analysis.
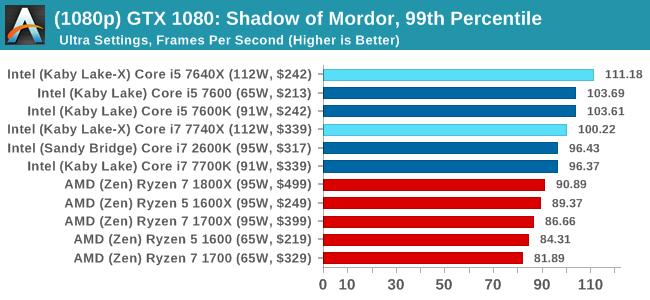
For all our results, we show the average frame rate at 1080p first. Mouse over the other graphs underneath to see 99th percentile frame rates and 'Time Under' graphs, as well as results for other resolutions. All of our benchmark results can also be found in our benchmark engine, Bench.
MSI GTX 1080 Gaming 8G Performance
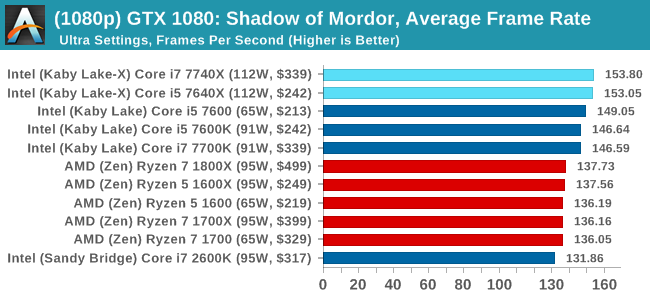
1080p
4K
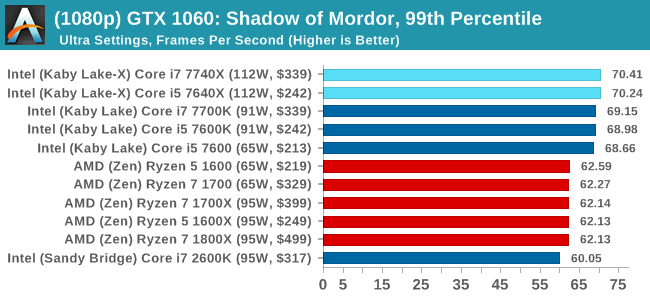
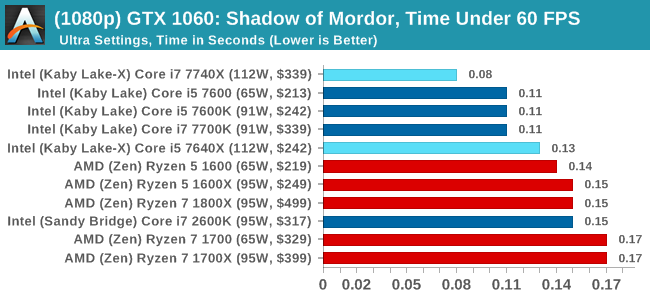
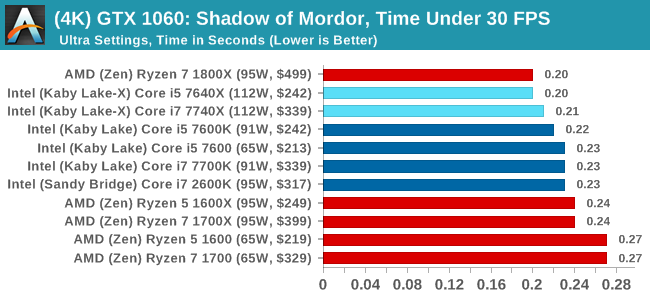
ASUS GTX 1060 Strix 6GB Performance
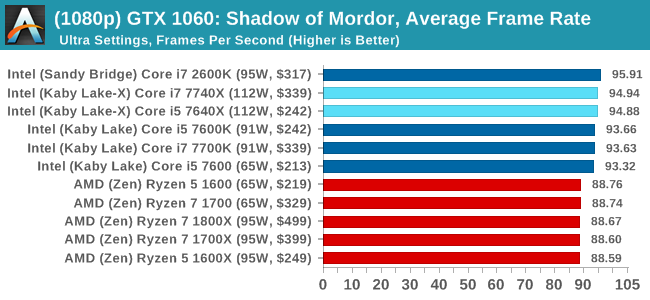
1080p
4K


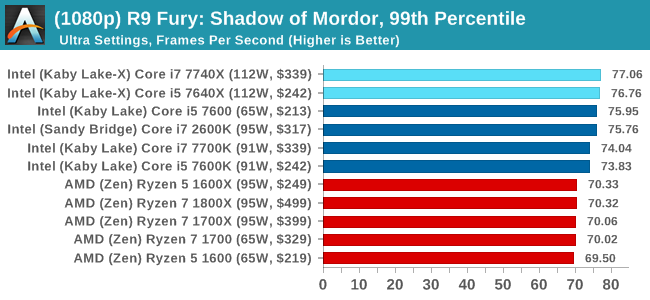
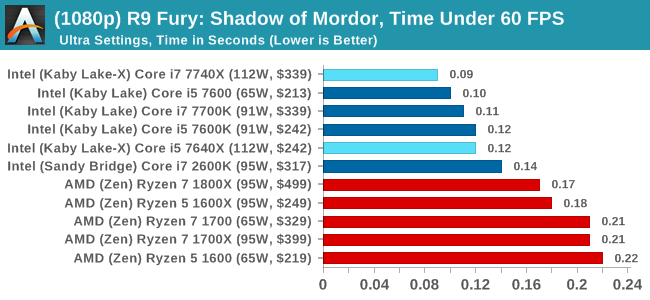
Sapphire R9 Fury 4GB Performance

1080p
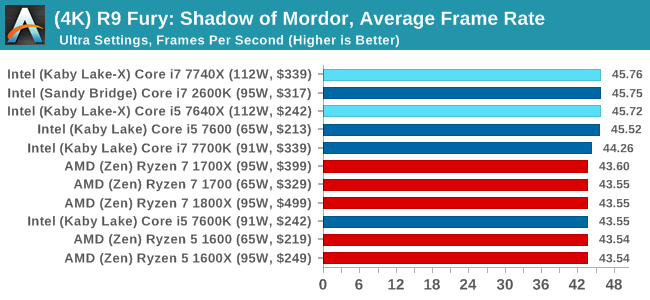
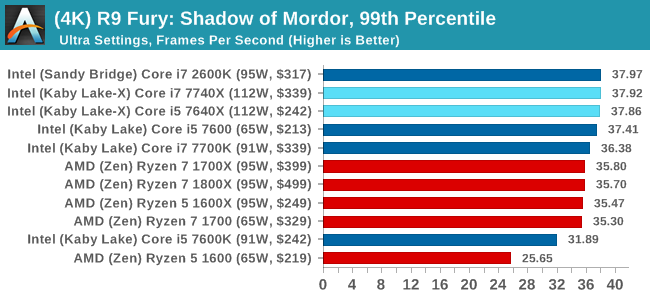
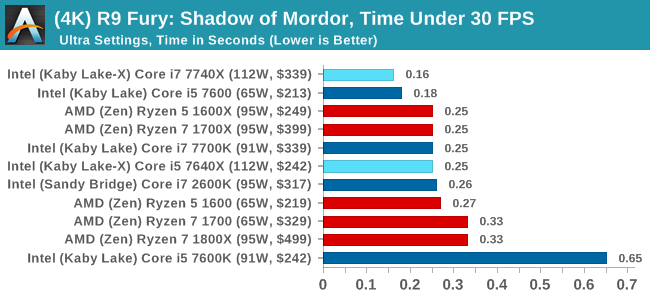
4K
Sapphire RX 480 8GB Performance
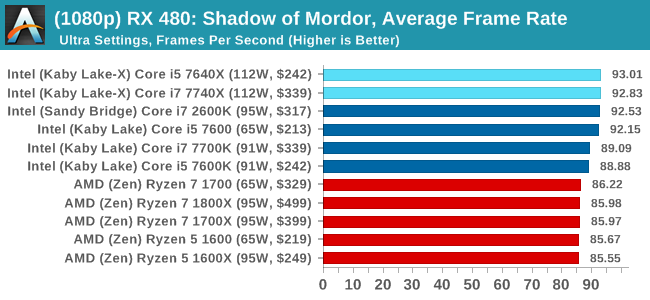
1080p
4K

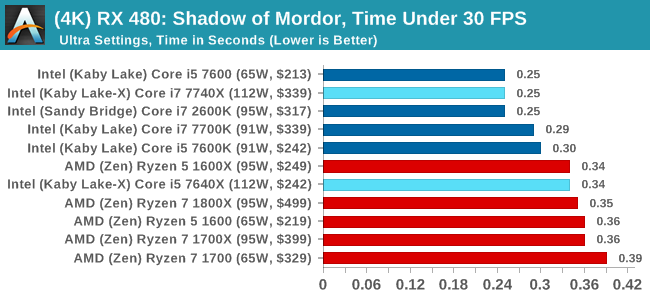
Shadow of Mordor Conclusions
Again, a win across the board for Intel, with the Core i7 taking the top spot in pretty much every scenario. AMD isn't that far behind for the most part.


176 Comments
View All Comments
mapesdhs - Monday, July 24, 2017 - link
2700K, +1.5GHz every time.shabby - Monday, July 24, 2017 - link
So much for upgrading from a kbl-x to skl-x when the motherboard could fry the cpu, nice going intel.Nashiii - Monday, July 24, 2017 - link
Nice article Ian. What I will say is I am a little confused around this comment:"Intel wins for the IO and chipset, offering 24 PCIe 3.0 lanes for USB 3.1/SATA/Ethernet/storage, while AMD is limited on that front, having 8 PCIe 2.0 from the chipset."
You forgot to mention the AMD total PCI-E IO. It has 24 PCI-E 3.0 lanes with 4xPCI-e 3.0 going to the chipset which can be set to 8x PCI-E 2.0 if 5Gbps is enough per lane, i.e in the case of USB3.0.
I have read that Kabylake-X only has 16 PCI-E 3.0 lanes native. Not sure about PCH support though...
KAlmquist - Monday, July 24, 2017 - link
With Kabylake-X, the only I/O that doesn't go through the chipset is the 16 PCI-E 3.0 lanes you mention. With Ryzen, in addition to what is provided by the chipset, the CPU provides1) Four USB 3.1 connections
2) Two SATA connections
3) 18 PCI-E 3.0 lanes, or 20 lanes if you don't use the SATA connections
So if you just look at the CPU, Ryzen has more connectivity than Kabylake-X, but the X299 chip set used with Kabylake-X is much more capable (and expensive) than anything in the AMD lineup. Also, the X299 doesn't provide any USB 3.1 ports (or more precisely, 10 gb per second speed ports), so those are typically provided by a separate chip, adding to the cost of X299 motherboards.
Allan_Hundeboll - Monday, July 24, 2017 - link
Interesting review with great benchmarks. (I don't understand why so many reviews only report average frames pr. second)The ryzen r5 1600 seems to offer great value for money, but i'm a bit puzzled why the slowest clocked R5 beats the higher clocked R7 in a lot of the 99% benchmarks, Im guessing its because the latency delta when moving data from one core to another penalize the higher core count R7 more?
BenSkywalker - Monday, July 24, 2017 - link
The gaming benchmarks are, uhm..... pretty useless.Third tier graphics cards as a starting point, why bother?
Seems like an awful lot of wasted time. As a note you may want to consider- when testing a new graphics card you get the fastest CPU you can so we can see what the card is capable of, when testing a new CPU you get the fastest GPU you can so we can see what the CPU is capable of. The way the benches are constructed, pretty useless for those of us that want to know gaming performance.
Tetsuo1221 - Monday, July 24, 2017 - link
Benchmarking at 1080p... enough said.. Completely and utterly redundantQasar - Tuesday, July 25, 2017 - link
why is benchmarking @ 1080p Completely and utterly redundant ?????meacupla - Tuesday, July 25, 2017 - link
I don't know that guy's particulars, but, to me, using X299 to game at 1080p seems like a waste.If I was going to throw down that kind of money, I would want to game at 1440p or 4K
silverblue - Tuesday, July 25, 2017 - link
Yes, but 1080p shifts the bottleneck towards the CPU.