The Intel Kaby Lake-X i7 7740X and i5 7640X Review: The New Single-Threaded Champion, OC to 5GHz
by Ian Cutress on July 24, 2017 8:30 AM EST- Posted in
- CPUs
- Intel
- Kaby Lake
- X299
- Basin Falls
- Kaby Lake-X
- i7-7740X
- i5-7640X
Benchmarking Performance: CPU Rendering Tests
Rendering tests are a long-time favorite of reviewers and benchmarkers, as the code used by rendering packages is usually highly optimized to squeeze every little bit of performance out. Sometimes rendering programs end up being heavily memory dependent as well - when you have that many threads flying about with a ton of data, having low latency memory can be key to everything. Here we take a few of the usual rendering packages under Windows 10, as well as a few new interesting benchmarks.
All of our benchmark results can also be found in our benchmark engine, Bench.
Corona 1.3: link
Corona is a standalone package designed to assist software like 3ds Max and Maya with photorealism via ray tracing. It's simple - shoot rays, get pixels. OK, it's more complicated than that, but the benchmark renders a fixed scene six times and offers results in terms of time and rays per second. The official benchmark tables list user submitted results in terms of time, however I feel rays per second is a better metric (in general, scores where higher is better seem to be easier to explain anyway). Corona likes to pile on the threads, so the results end up being very staggered based on thread count.
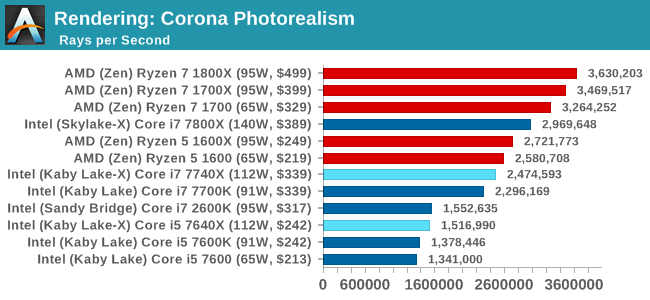
More threads win the day, although the Core i7 does knock at the door of the Ryzen 5 (presumably with $110 in hand as well). It is worth noting that the Core i5-7640X and the older Core i7-2600K are on equal terms.
Blender 2.78: link
For a render that has been around for what seems like ages, Blender is still a highly popular tool. We managed to wrap up a standard workload into the February 5 nightly build of Blender and measure the time it takes to render the first frame of the scene. Being one of the bigger open source tools out there, it means both AMD and Intel work actively to help improve the codebase, for better or for worse on their own/each other's microarchitecture.
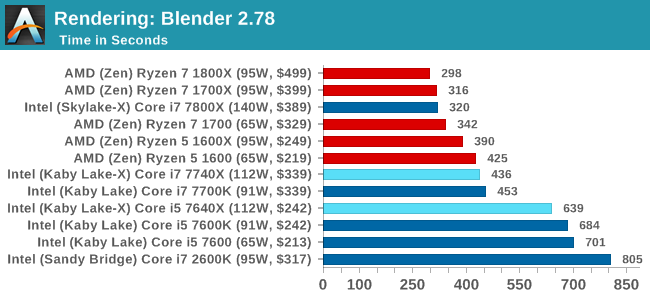
Similar to Corona, more threads means a faster time.
LuxMark v3.1: Link
As a synthetic, LuxMark might come across as somewhat arbitrary as a renderer, given that it's mainly used to test GPUs, but it does offer both an OpenCL and a standard C++ mode. In this instance, aside from seeing the comparison in each coding mode for cores and IPC, we also get to see the difference in performance moving from a C++ based code-stack to an OpenCL one with a CPU as the main host.
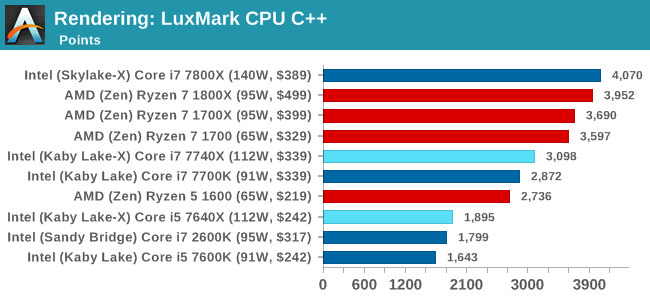
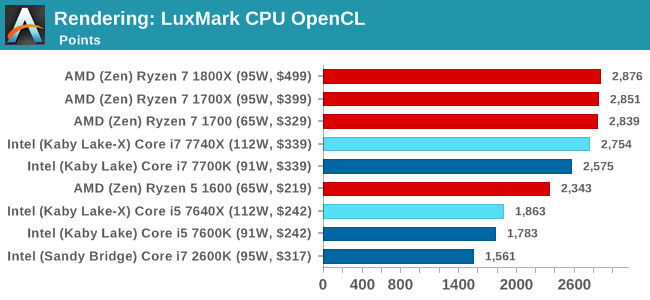
Luxmark is more thread and cache dependent, and so the Core i7 nips at the heels of the AMD parts with double the threads. The Core i5 sits behind the the Ryzen 5 parts though, due to the 1:3 thread difference.
POV-Ray 3.7.1b4: link
Another regular benchmark in most suites, POV-Ray is another ray-tracer but has been around for many years. It just so happens that during the run up to AMD's Ryzen launch, the code base started to get active again with developers making changes to the code and pushing out updates. Our version and benchmarking started just before that was happening, but given time we will see where the POV-Ray code ends up and adjust in due course.
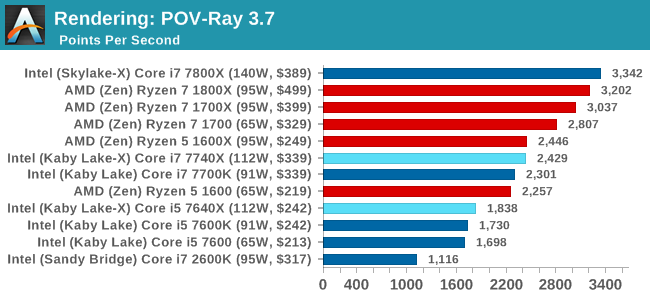
Mirror Mirror on the wall...
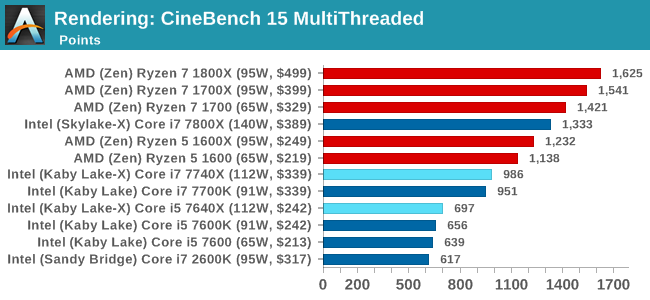
Cinebench R15: link
The latest version of CineBench has also become one of those 'used everywhere' benchmarks, particularly as an indicator of single thread performance. High IPC and high frequency gives performance in ST, whereas having good scaling and many cores is where the MT test wins out.
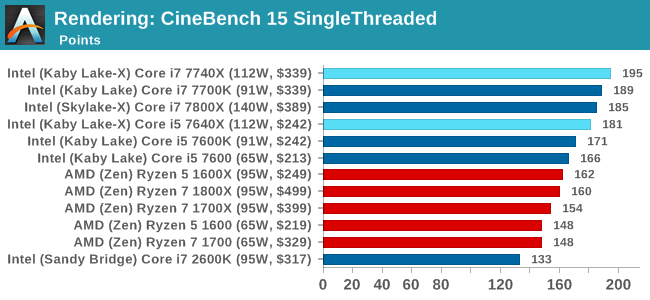
CineBench gives us singlethreaded numbers, and it is clear who rules the roost, almost scoring 200. The Core i7-2600K, due to its lack of instruction support, sits in the corner.


176 Comments
View All Comments
djayjp - Monday, July 24, 2017 - link
Ian, why didn't you check if the OC was being thermally throttled? Easy enough to check this. And easy enough to see if it's the temperature of the cores or not. Surprising you wouldn't include temperature or power consumption data with the OC (though I understand this hasn't typically been a focus of AT). Another site demonstrated throttling at ~95+ C.mapesdhs - Monday, July 24, 2017 - link
Is that the same site which showed that the TIM Intel is using is just not allowing the heat to get from the die to the cap? Die temp shoots up, cap temp doesn't, even with a chiller cooler.melgross - Monday, July 24, 2017 - link
This article gives a good reason why huge numbers of core are a waste of money for most users.http://www.computerworld.com/article/3209724/compu...
Old_Fogie_Late_Bloomer - Monday, July 24, 2017 - link
Yeah, don't bother starting the article unless you're willing to create yet another useless online identity. Shame, since it seemed moderately interesting, but...alpha754293 - Monday, July 24, 2017 - link
re: overclockingThat works well for the occasional heavy workload, but if you are going to be constantly running at peak load (like I did for engineering analysis), overclocking of any kind, from my experience, isn't worth the dead core or entire CPU.
I've already fried a core on the 3930K once before taking it up from 3.2 GHz stock, 3.5 GHz max TurboBoost to 4.5 GHz.
mapesdhs - Monday, July 24, 2017 - link
Alas this stuff does vary according to the invidual CPU, mbd, RAM, etc. What cooling did you use? Could also be the vcore was too high - a lot of SB-E users employed a high vcore, not realising that using a lower PLL would often make such a high vcore unnecessary. It's even more complicated if one fills all 8 RAM slots on a typical X79 mbd.alpha754293 - Tuesday, July 25, 2017 - link
The cooling that I was using was Corsair H80i v2.The temps were fine and were consistently fine.
RAM was 8x 8 GB Cruical Ballistix Sport I think DDR3-1600? Something like that. Nothing special, but nothing super crappy either. I actually had the entire set of RAM (all eight DIMMs RMA'd once) so I know that I got a whole new set back when that happened about oh...maybe a-year-and-a-half ago now? Something like that.
Motherboard was Asus X79 Sabertooth.
Yeah, I had all 8 DIMM slots populated because it was a cheaper option compared to 4x 16 GB. Besides, using all 8 DIMMs also was able to make use of the quad-channel memory whereas going with 4x 16 GB - you can't/won't (since the memory needed to be installed in paired DIMM slots).
That CPU is now "castrated" down to 4 cores (out of 6) because 1 of the cores died (e.g. will consistently throw BSODs, but if I disable it, no problems). Makes for a decent job scheduler (or at least that's the proposed task/life for it).
Dr. Swag - Monday, July 24, 2017 - link
Hey Ian, on the first page you listed the turbo of the 7700k as 4.4, whereas it's actually 4.5Yuriman - Monday, July 24, 2017 - link
Shouldn't the 7700K read "4.2-4.5ghz" rather than 4.2-4.4?Dug - Monday, July 24, 2017 - link
On RoTR-1-Valley 1080p it shows i5 7600k at 141fps and the i7 7700k at 103fps. Have a feeling these might be transposed.