The Intel Kaby Lake-X i7 7740X and i5 7640X Review: The New Single-Threaded Champion, OC to 5GHz
by Ian Cutress on July 24, 2017 8:30 AM EST- Posted in
- CPUs
- Intel
- Kaby Lake
- X299
- Basin Falls
- Kaby Lake-X
- i7-7740X
- i5-7640X
Grand Theft Auto
The highly anticipated iteration of the Grand Theft Auto franchise hit the shelves on April 14th 2015, with both AMD and NVIDIA in tow to help optimize the title. GTA doesn’t provide graphical presets, but opens up the options to users and extends the boundaries by pushing even the hardest systems to the limit using Rockstar’s Advanced Game Engine under DirectX 11. Whether the user is flying high in the mountains with long draw distances or dealing with assorted trash in the city, when cranked up to maximum it creates stunning visuals but hard work for both the CPU and the GPU.
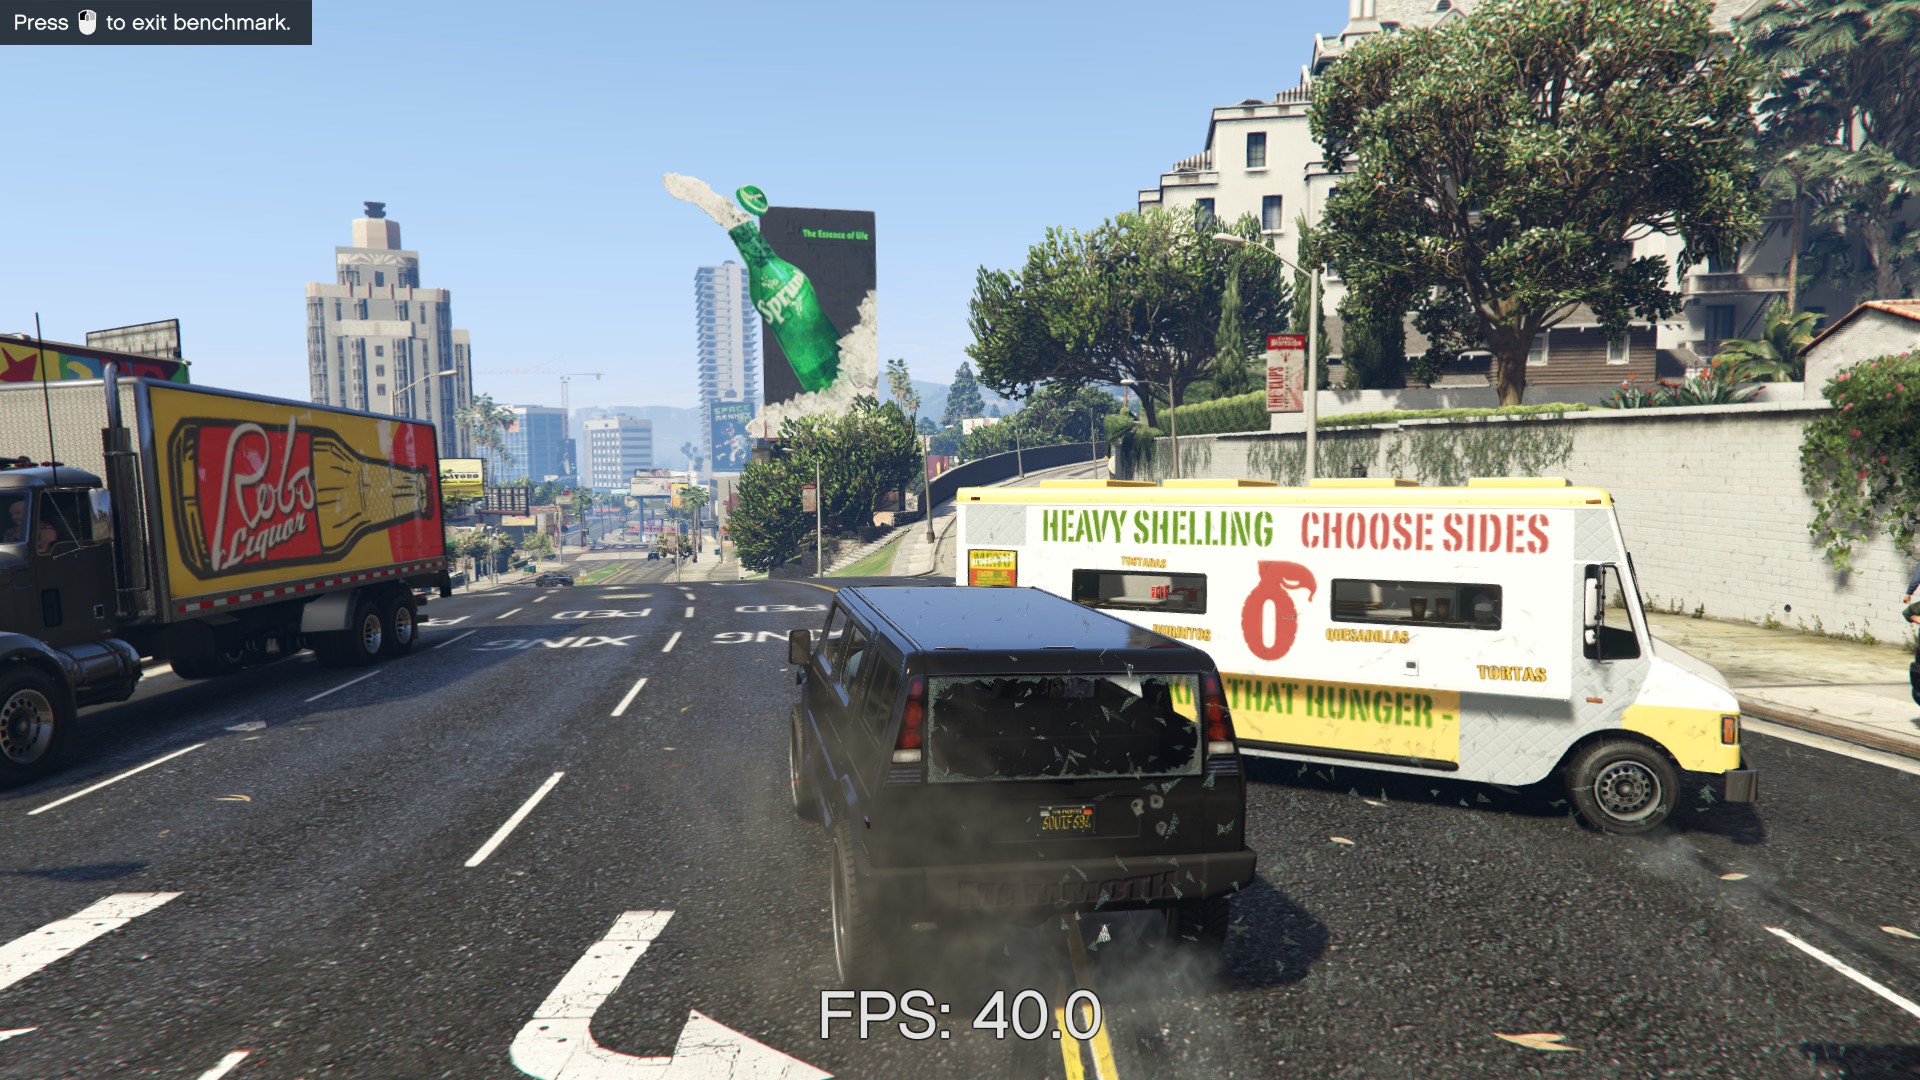
For our test we have scripted a version of the in-game benchmark. The in-game benchmark consists of five scenarios: four short panning shots with varying lighting and weather effects, and a fifth action sequence that lasts around 90 seconds. We use only the final part of the benchmark, which combines a flight scene in a jet followed by an inner city drive-by through several intersections followed by ramming a tanker that explodes, causing other cars to explode as well. This is a mix of distance rendering followed by a detailed near-rendering action sequence, and the title thankfully spits out frame time data.
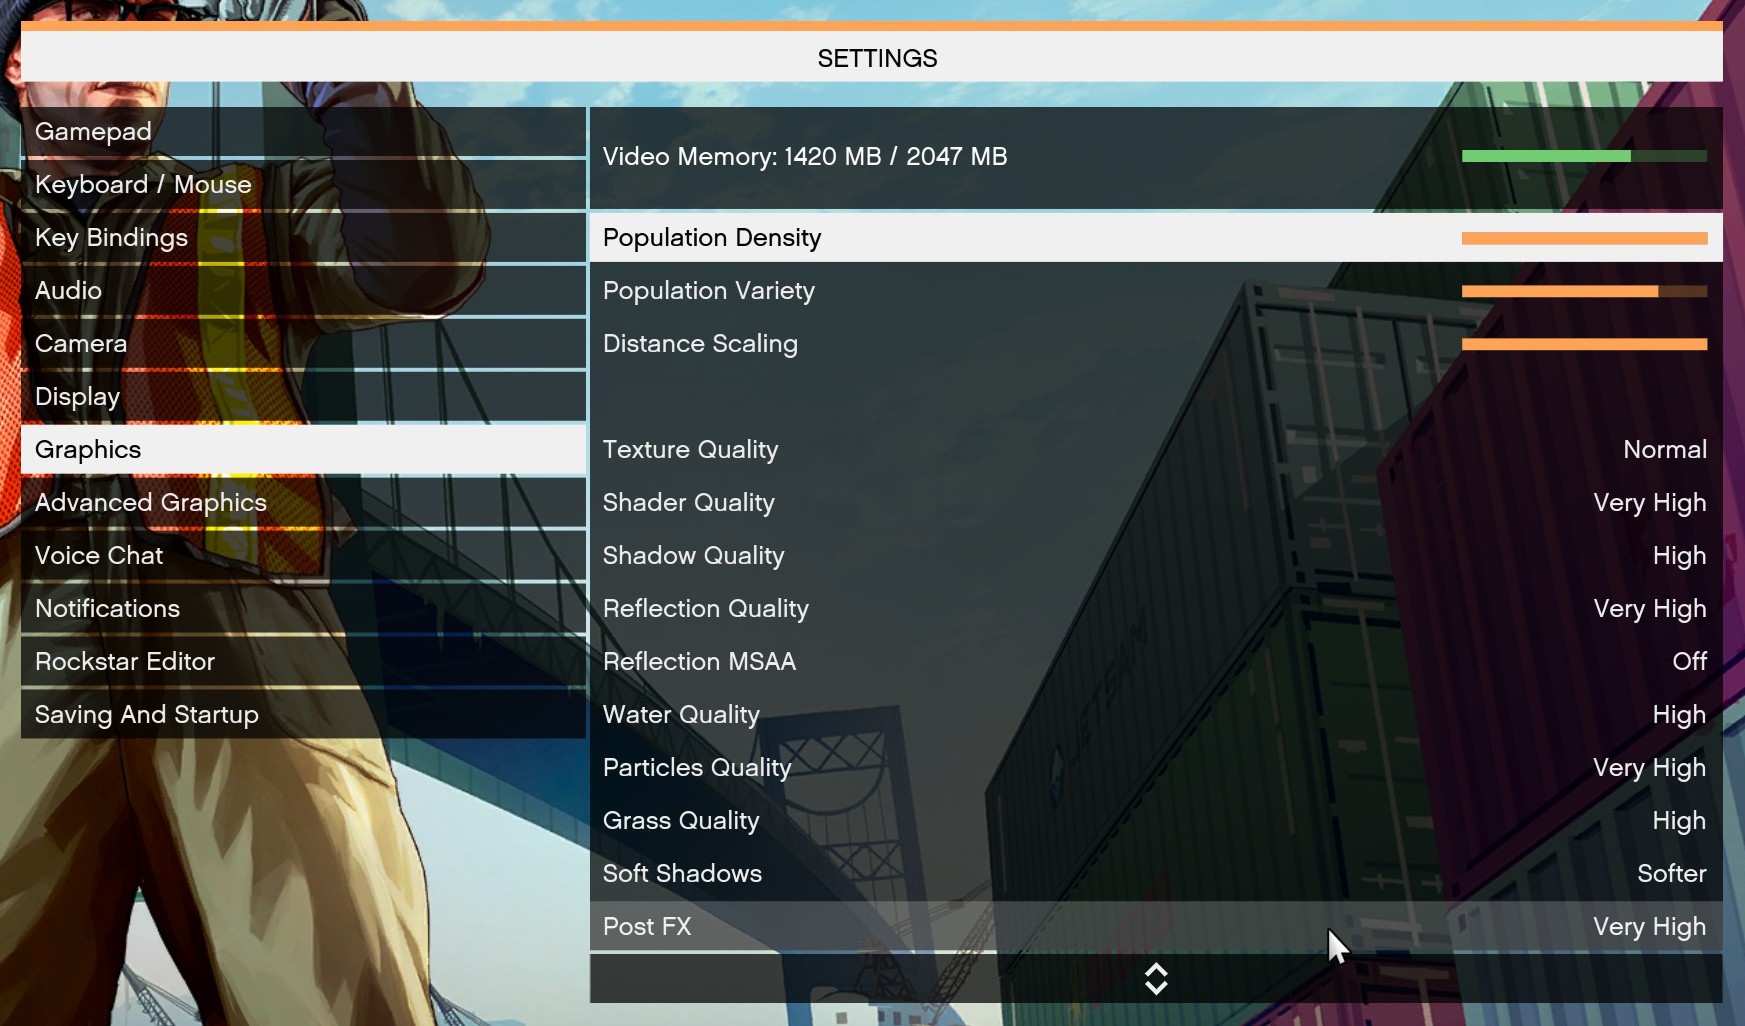
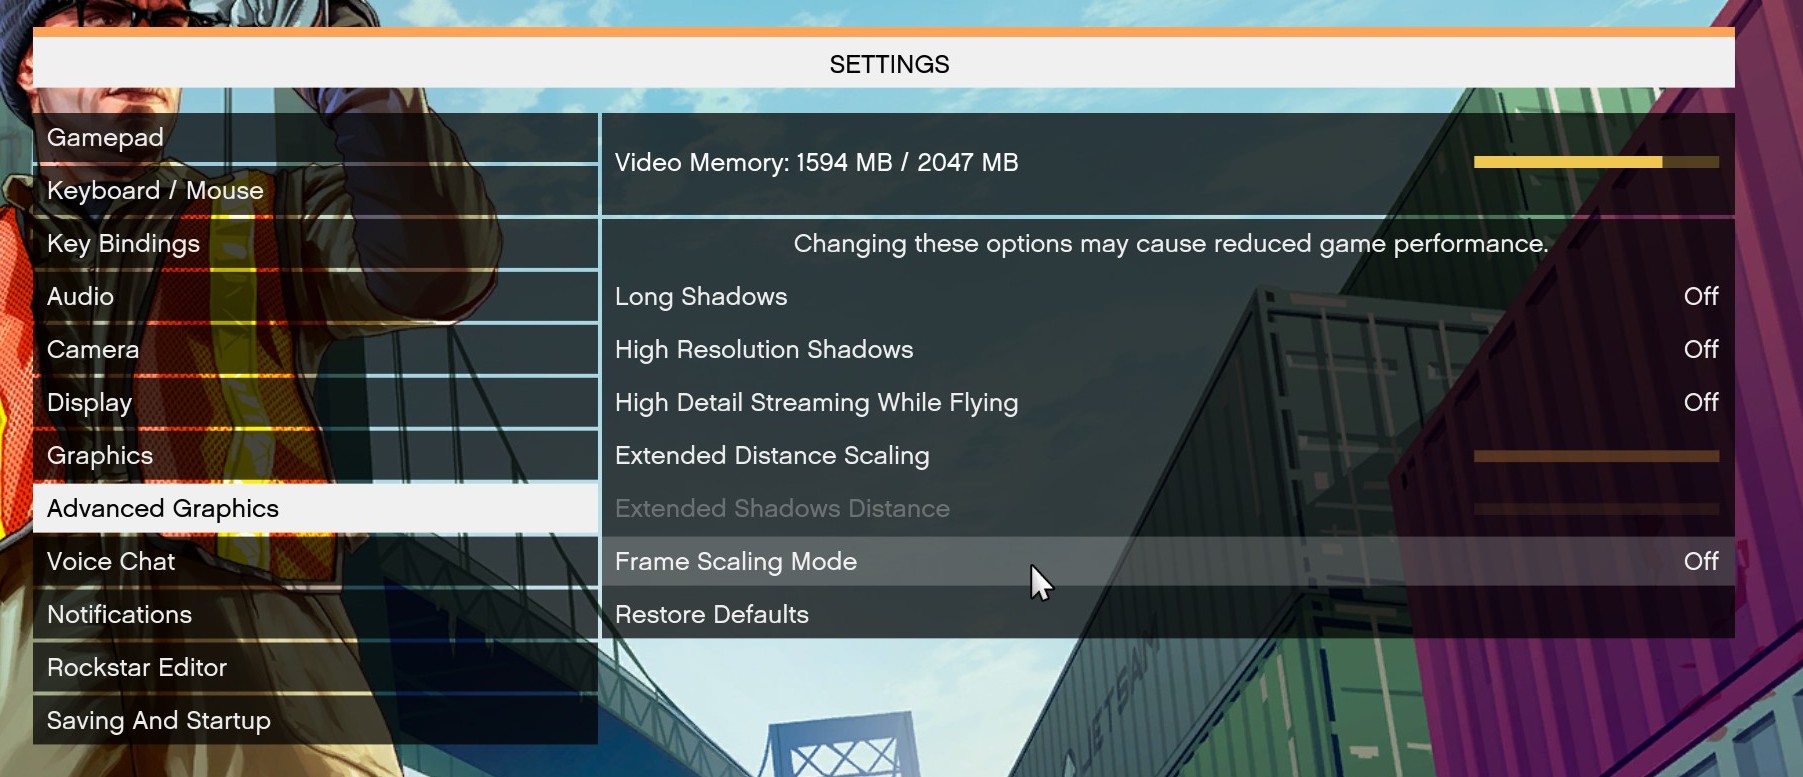
There are no presets for the graphics options on GTA, allowing the user to adjust options such as population density and distance scaling on sliders, but others such as texture/shadow/shader/water quality from Low to Very High. Other options include MSAA, soft shadows, post effects, shadow resolution and extended draw distance options. There is a handy option at the top which shows how much video memory the options are expected to consume, with obvious repercussions if a user requests more video memory than is present on the card (although there’s no obvious indication if you have a low end GPU with lots of GPU memory, like an R7 240 4GB).
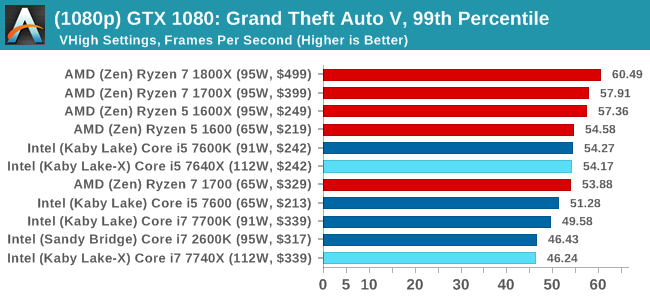
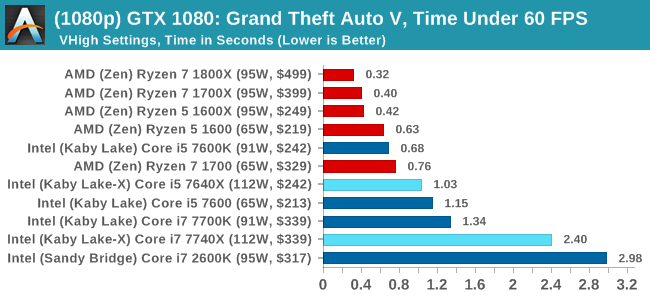
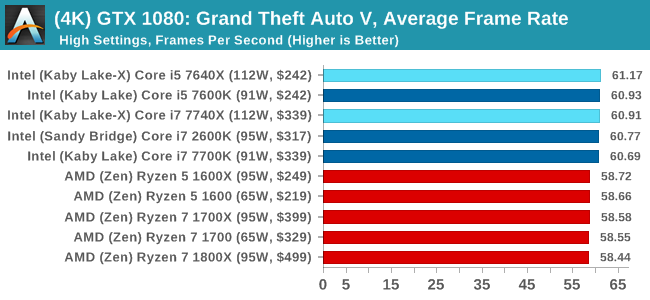
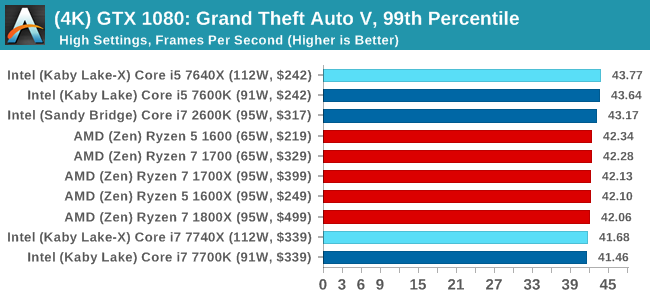
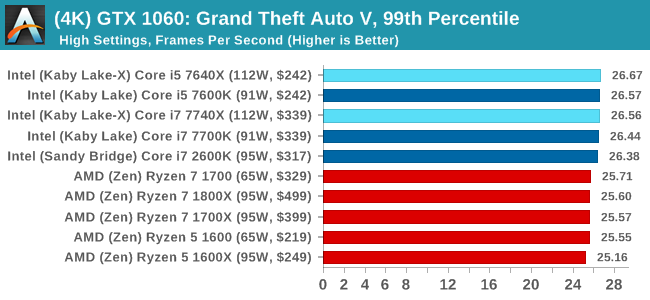
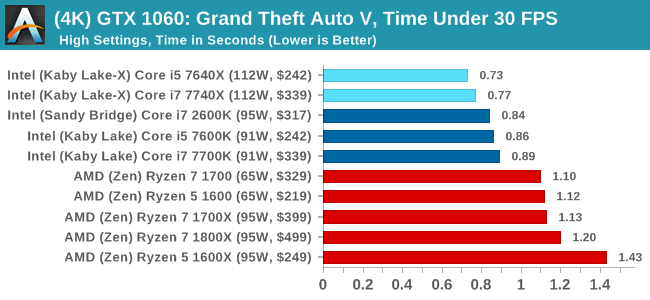
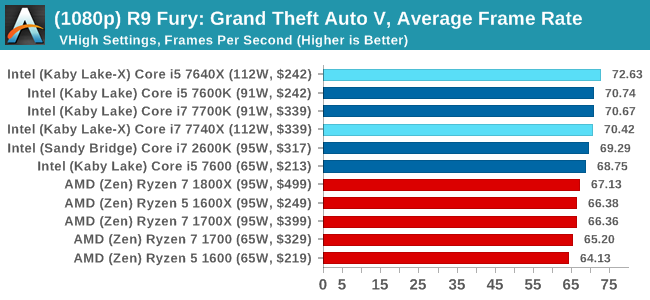
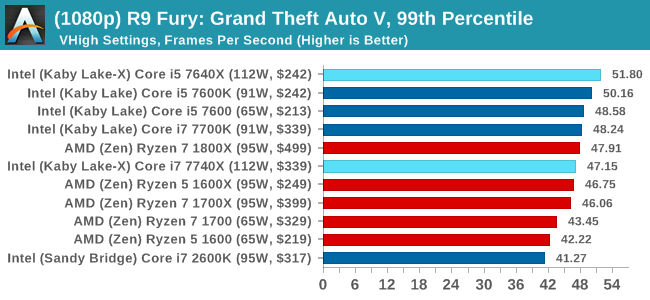
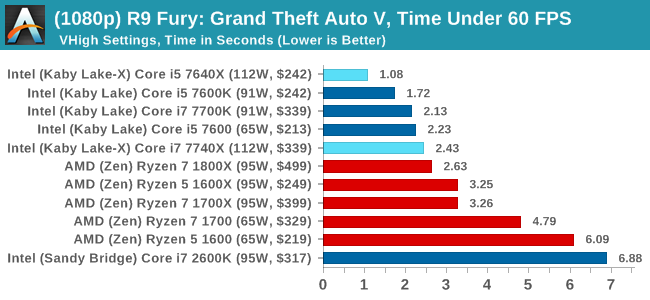
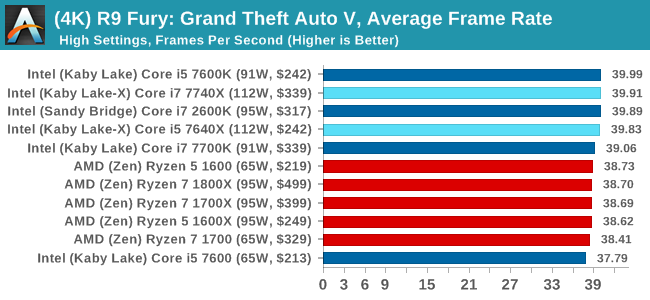
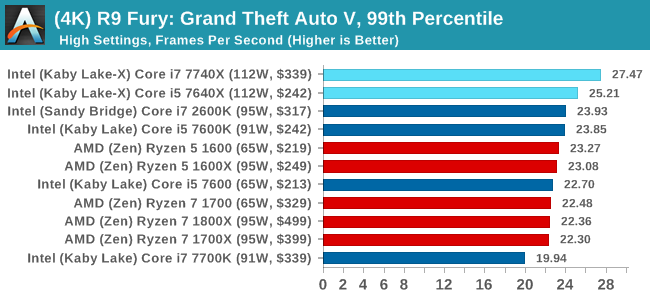
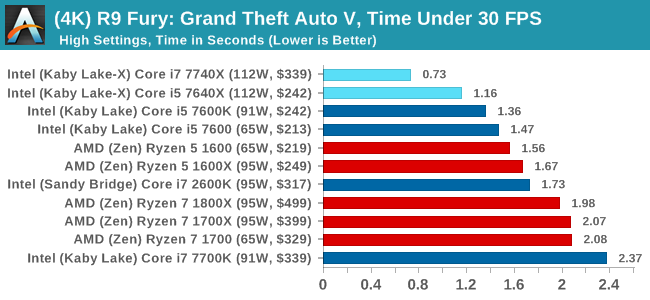
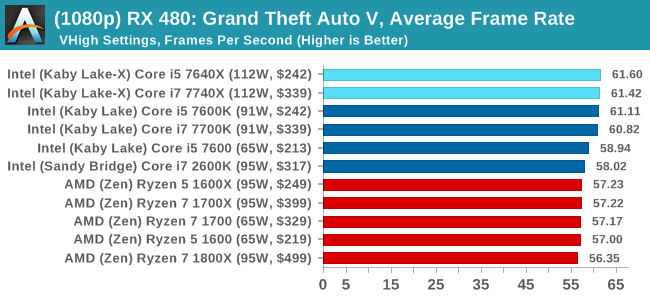
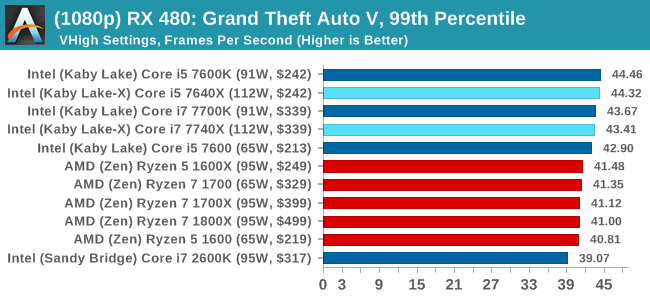
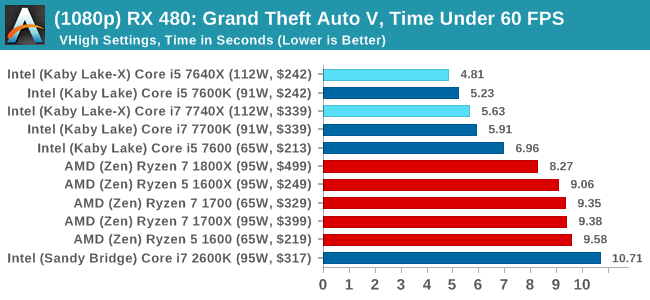
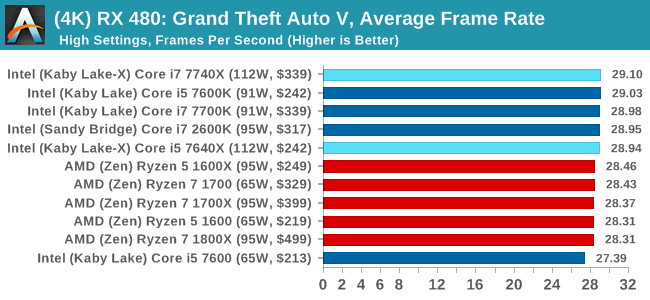
To that end, we run the benchmark at 1920x1080 using an average of Very High on the settings, and also at 4K using High on most of them. We take the average results of four runs, reporting frame rate averages, 99th percentiles, and our time under analysis.
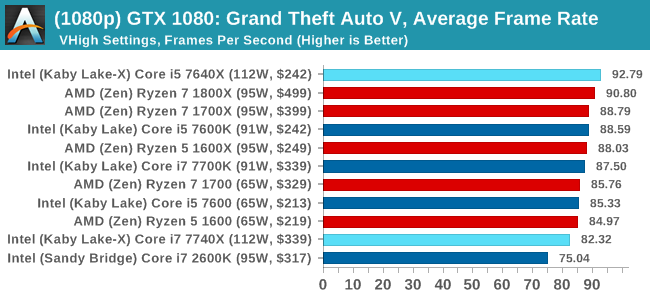
For all our results, we show the average frame rate at 1080p first. Mouse over the other graphs underneath to see 99th percentile frame rates and 'Time Under' graphs, as well as results for other resolutions. All of our benchmark results can also be found in our benchmark engine, Bench.
MSI GTX 1080 Gaming 8G Performance
1080p
4K
ASUS GTX 1060 Strix 6GB Performance

1080p
4K
Sapphire R9 Fury 4GB Performance
1080p
4K
Sapphire RX 480 8GB Performance
1080p
4K
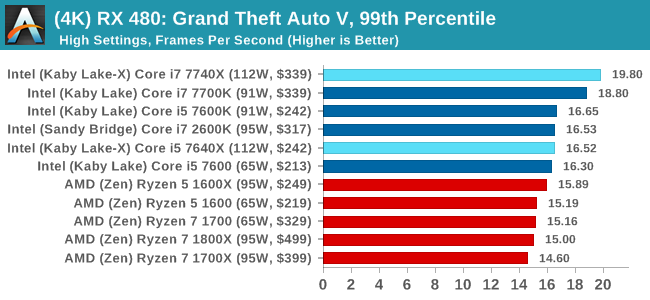
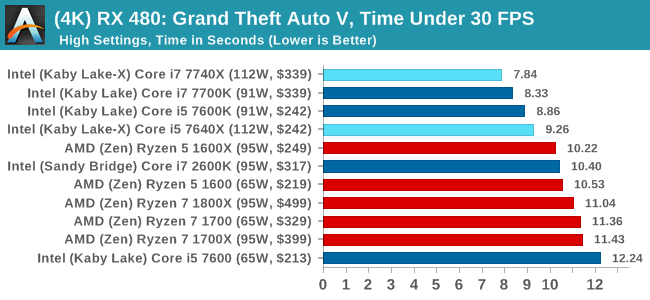
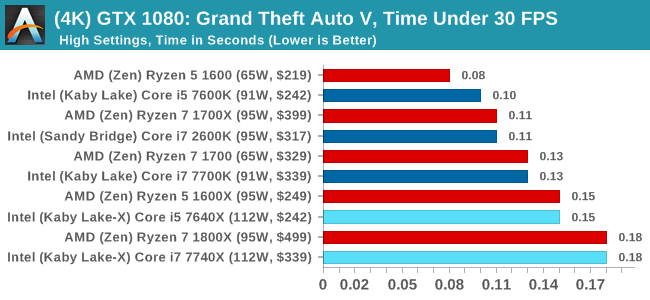
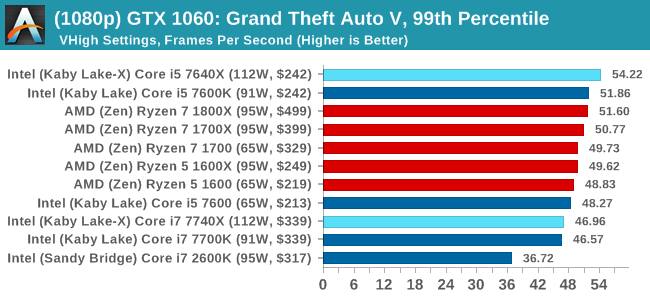
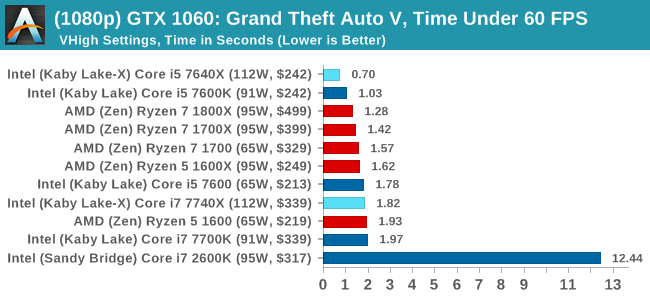
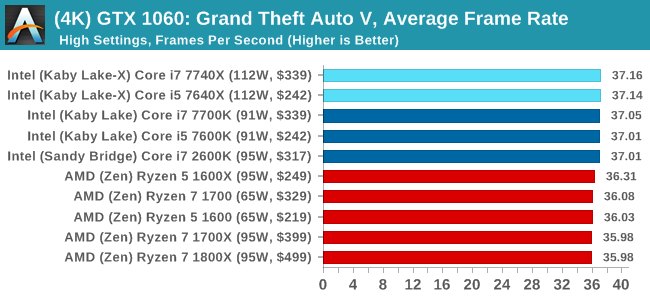
Grand Theft Auto Conclusions
Looking through the data, there seems to be a difference when looking at the results with an AMD GPU and an NVIDIA GPU. With the GTX 1080, there's a mix of AMD and Intel results there, but Intel takes a beating in the Time Under analysis at 1080p. The GTX 1060 is a mix at 1080p, but Intel takes the lead at 4K. When an AMD GPU is paired to the processor, all flags fly Intel.


176 Comments
View All Comments
MrSpadge - Monday, July 24, 2017 - link
> realize that overclocking may not be appropriate for these workloadsThat's going too far. Just don't overclock as far for heavy AVX usage.
MrSpadge - Monday, July 24, 2017 - link
Kind of agreed. Ian, you should log the clock speeds during benchmark runs and check for anomalies. The chip or mainboard could throttle, or your 4.0 GHz AVX clock could just be way too low. What's the default AVX clock? Maybe 4.4 GHz? That would pretty much match the 10% performance degradation.Ian Cutress - Monday, July 24, 2017 - link
I need to do a performance scaling piece, I know. It's on the to-do listKvaern1 - Monday, July 24, 2017 - link
As already mentioned it's heavy AVX workloads which makes it throttle when OC'ed. The same thing happens on OC'ed Skylakes.arh2o - Monday, July 24, 2017 - link
Something seems wrong with the 7700k results vs the 7600k results. How is the 7600k beating the 7700k so handily in all the games? Are you sure the graphs are not swapped? ROTR shows the 7600k beating the 7700k by 20 FPS which seems impossible considering most reviews on this game have the 7700k on top of the 7600k.ydeer - Monday, July 24, 2017 - link
I would have liked to see some idle power consumption numbers because my PC is always on.Ro_Ja - Monday, July 24, 2017 - link
This was an interesting read. Thank you!Marnox - Monday, July 24, 2017 - link
According to Intel (https://ark.intel.com/products/97129/Intel-Core-i7... the Turbo speed for the 7700K is the same as the 7740X.mapesdhs - Monday, July 24, 2017 - link
Is the Max Turbo for one core or two? Always bugged me that Intel doesn't list the individual core/bin levels.versesuvius - Monday, July 24, 2017 - link
It will be interesting to see how many of these CPUs Intel will actually produce (collect ?) and bring to the market.