The Intel Optane Memory (SSD) Preview: 32GB of Kaby Lake Caching
by Billy Tallis on April 24, 2017 12:00 PM EST- Posted in
- SSDs
- Storage
- Intel
- PCIe SSD
- SSD Caching
- M.2
- NVMe
- 3D XPoint
- Optane
- Optane Memory
BAPCo SYSmark 2014 SE
BAPCo's SYSmark 2014 SE is an application-based benchmark that uses real-world applications to replay usage patterns of business users in the areas of office productivity, media creation and data/financial analysis. In addition, it also addresses the responsiveness aspect which deals with user experience as related to application and file launches, multi-tasking etc. Scores are meant to be compared against a reference desktop (the SYSmark 2014 SE calibration system in the graphs below). While the SYSmark 2014 benchmark used a Haswell-based desktop configuration, the SYSmark 2014 SE makes the move to a Lenovo ThinkCenter M800 (Intel Core i3-6100, 4GB RAM and a 256GB SATA SSD). The calibration system scores 1000 in each of the scenarios. A score of, say, 2000, would imply that the system under test is twice as fast as the reference system.
SYSmark scores are based on total application response time as seen by the user, including not only storage latency but time spent by the processor. This means there's a limit to how much a storage improvement could possibly increase scores. It also means our Optane review system starts out with an advantage over the SYSmark calibration system due to the faster processor and more RAM.
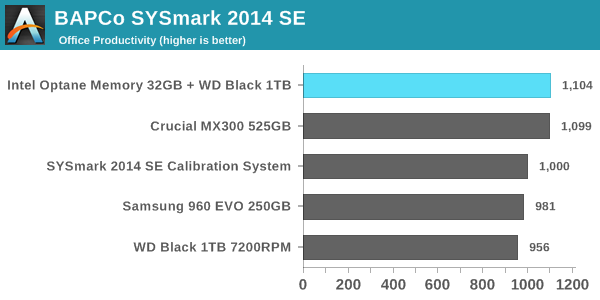
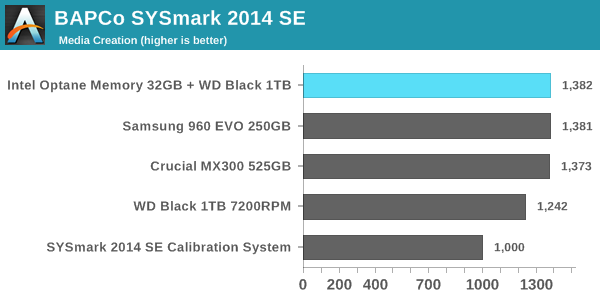
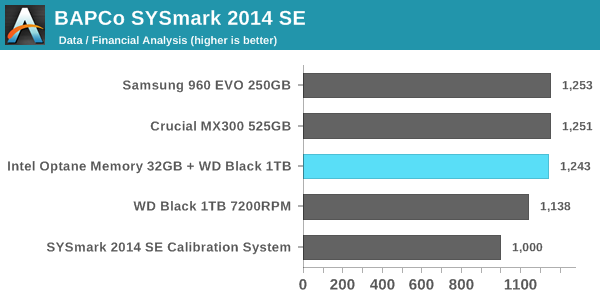
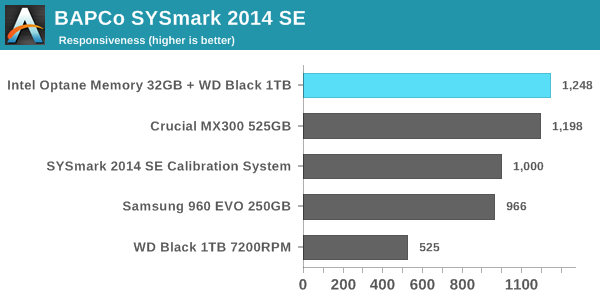
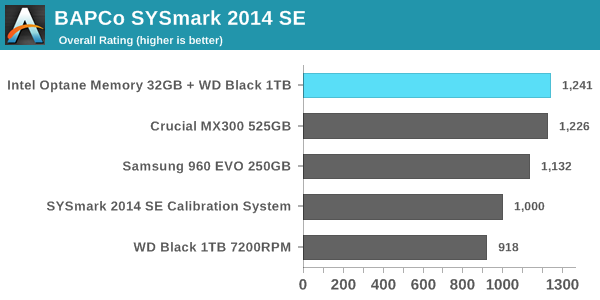
In every performance category the Optane caching setup is either in first place or a close tie for first. The Crucial MX300 is tied with the Optane configuration for every sub-test except the responsiveness test, where it falls slightly behind. The Samsung 960 EVO 250GB struggles, partly because its low capacity and the low degree of parallelism that implies means it often cannot take advantage of the performance offered by its PCIe 3.0 x4 interface. The use of Microsoft's built-in NVMe driver instead of Samsung's may also be holding it back. As expected, the WD Black hard drive scores substantially worse than our solid-state configurations on every test, with the biggest disparity occurring in the responsiveness test: The WD Black hard drive will force users to spend more than twice as much time waiting on their computer than if it has a SSD.
Energy Usage
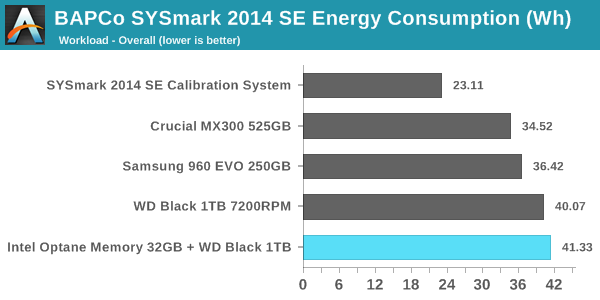
SYSmark 2014 SE also adds energy measurement to the mix. A high score in the SYSmark benchmarks might be nice to have, but, potential customers also need to determine the balance between power consumption and the efficiency of the system. For example, in the average office scenario, it might not be worth purchasing a noisy and power-hungry PC just because it ends up with a 2000 score in the SYSmark 2014 SE benchmarks. In order to provide a balanced perspective, SYSmark 2014 SE also allows vendors and decision makers to track the energy consumption during each workload. In the graphs below, we find the total energy consumed by the PC under test for a single iteration of each SYSmark 2014 SE workload and how it compares against the calibration systems.
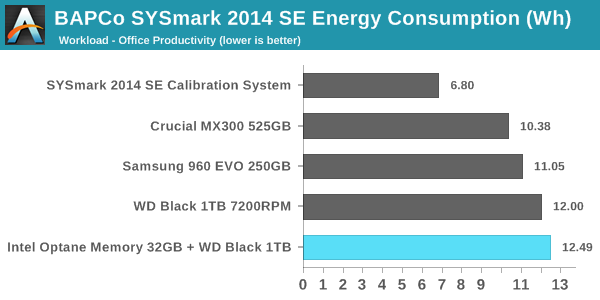
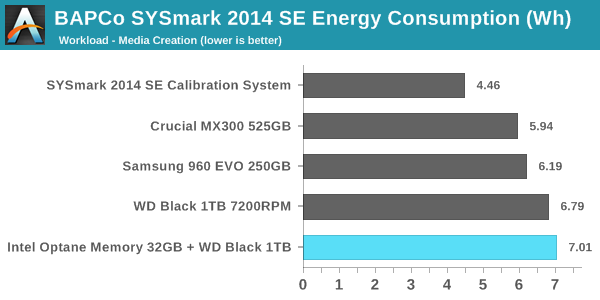
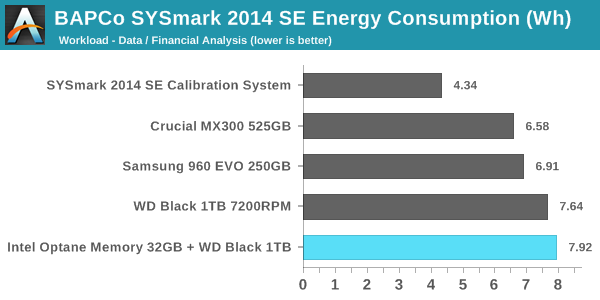
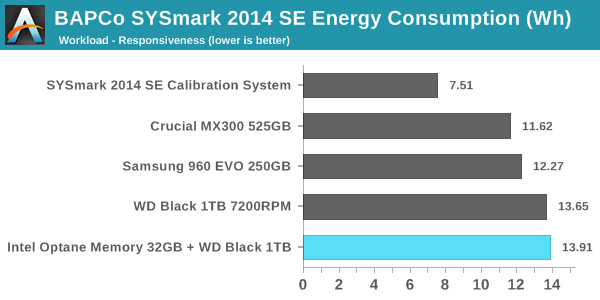
The peak power consumption of a PCIe SSD under load can exceed the power draw of a hard drive, but over the course of a fixed workload hard drives will always be less power efficient. SSDs almost always complete the data transfer sooner, and they can enter and leave their low-power idle states far quicker. On a benchmark like SYSmark, there are no idle times long enough for a hard drive to spin down and save power.
With an idle power of 1W, the Optane cache module substantially increases the already high power consumption of the hard drive-based configurations. It does allow for the tests to complete sooner, but since the Optane module does nothing to accelerate the compute-bound portions of SYSmark, the total time saved is not enough to make up the difference. It also appears that the Optane caching is not being used to enable more aggressive power saving on the hard drive—Intel's probably flushing writes from the cache often enough to keep the hard drive spinning the whole time. What this adds up to is a difference that's quite clear but not big enough for desktop users to be too concerned with unless their electricity prices are high. The Optane Memory caching configuration is the most power-hungry option we tested, while the second-place performing Crucial MX300 configuration was most efficient, using about 16% less energy overall.
For mobile users, the power consumption of the Optane plus hard drive configuration is pretty much a deal-breaker. Our Optane review system is not optimized for power consumption the way a notebook system would be, so for a mobile user the Optane module would account for an even larger portion of the total battery draw, and battery life will take a serious hit.


110 Comments
View All Comments
Ratman6161 - Monday, April 24, 2017 - link
"The test that I would be interested in is if this technology could be an effective cache is speeding up mainstream SSDs."That's exactly what I was wondering i.e. if I paired it with my SATA 250 EVO. Or, they have a Crucial MX300 SATA SSD in the test which is an OK lower priced SSD. Given the optane drives are $44 and $77 respectively, if someone had something like the MX300 they might be tempted to pair it with an Optane cache.
On the other hand you have to have the latest Intel CPU and chipset, and I just jumped ship and went with a Ryzen 5 - so its all academic to me.
Lolimaster - Wednesday, April 26, 2017 - link
LTT already did, it's worthless.For $77 you're close of a crucial MX300 275GB
Billy Tallis - Monday, April 24, 2017 - link
That's the test that was running when it died.Twingo - Monday, April 24, 2017 - link
Billy, are you expecting to get a replacement so you can conduct all these tests?Billy Tallis - Monday, April 24, 2017 - link
Yes, the replacement will be delivered tomorrow. But don't expect the follow-up article to be real soon. I also want to update the software on the testbeds and run a reasonably large number of drives through, and do some deeper experimentation with the caching to probe its behavior.beginner99 - Tuesday, April 25, 2017 - link
Mainstream TLC ssds for sure there will be a speed-up measurable in benchmarks. If we as user would actually notice a difference is a completely other question. Due to KISS instead of spending money on this cache drive, instead just buy a tier higher SSD. If mainstrem choose 960 evo instead or of 960 evo choose 960 pro instead.fallaha56 - Tuesday, April 25, 2017 - link
absolutely not(!)for the reason you said
the 960 pro offers no meaningful real-world advantage to anyone / 99.9% of users
Glock24 - Monday, April 24, 2017 - link
"Only Core 13, 15 and i7 processors are supported; Celeron and Pentium parts are excluded."There's a typo or I've never seen those Core 13 and Core 15 CPUs before.
From the data you showed, I see no real benefit is using Optane as a caching solution vs. using an SSD as boot drive. At least not at that price point.
Kristian Vättö - Monday, April 24, 2017 - link
For the full review, could you also monitor DRAM usage? 16GB is not really an entry-level setup, so with that much DRAM Intel's software might be caching to DRAM as well like Samsung's RAPID mode, which would inflate the scores.Might also be worthwhile to run at least a couple of the application tests with 4GB/8GB of DRAM to see how things work when caching is done fully by Optane.
Sarah Terra - Monday, April 24, 2017 - link
Also optane's incredibly low latency should be tested for real world benefits