The Intel Optane SSD DC P4800X (375GB) Review: Testing 3D XPoint Performance
by Billy Tallis on April 20, 2017 12:00 PM ESTMixed Read/Write Performance
Workloads consisting of a mix of reads and writes can be particularly challenging for flash based SSDs. When a write operation interrupts a string of reads, it will block access to at least one flash chip for a period of time that is substantially longer than a read operation takes. This hurts the latency of any read operations that were waiting on that chip, and with enough write operations throughput can be severely impacted. If the write command triggers an erase operation on one or more flash chips, the traffic jam is many times worse.
The occasional read interrupting a string of write commands doesn't necessarily cause much of a backlog, because writes are usually buffered by the controller anyways. But depending on how much unwritten data the controller is willing to buffer and for how long, a burst of reads could force the drive to begin flushing outstanding writes before they've all been coalesced into optimal sized writes.
The effect of a read still applies to the Optane SSD's 3D XPoint memory, but with greatly reduced severity. Whether a block of reads coming in has an effect depends on how the Optane SSD's controller manages the 3D XPoint memory.
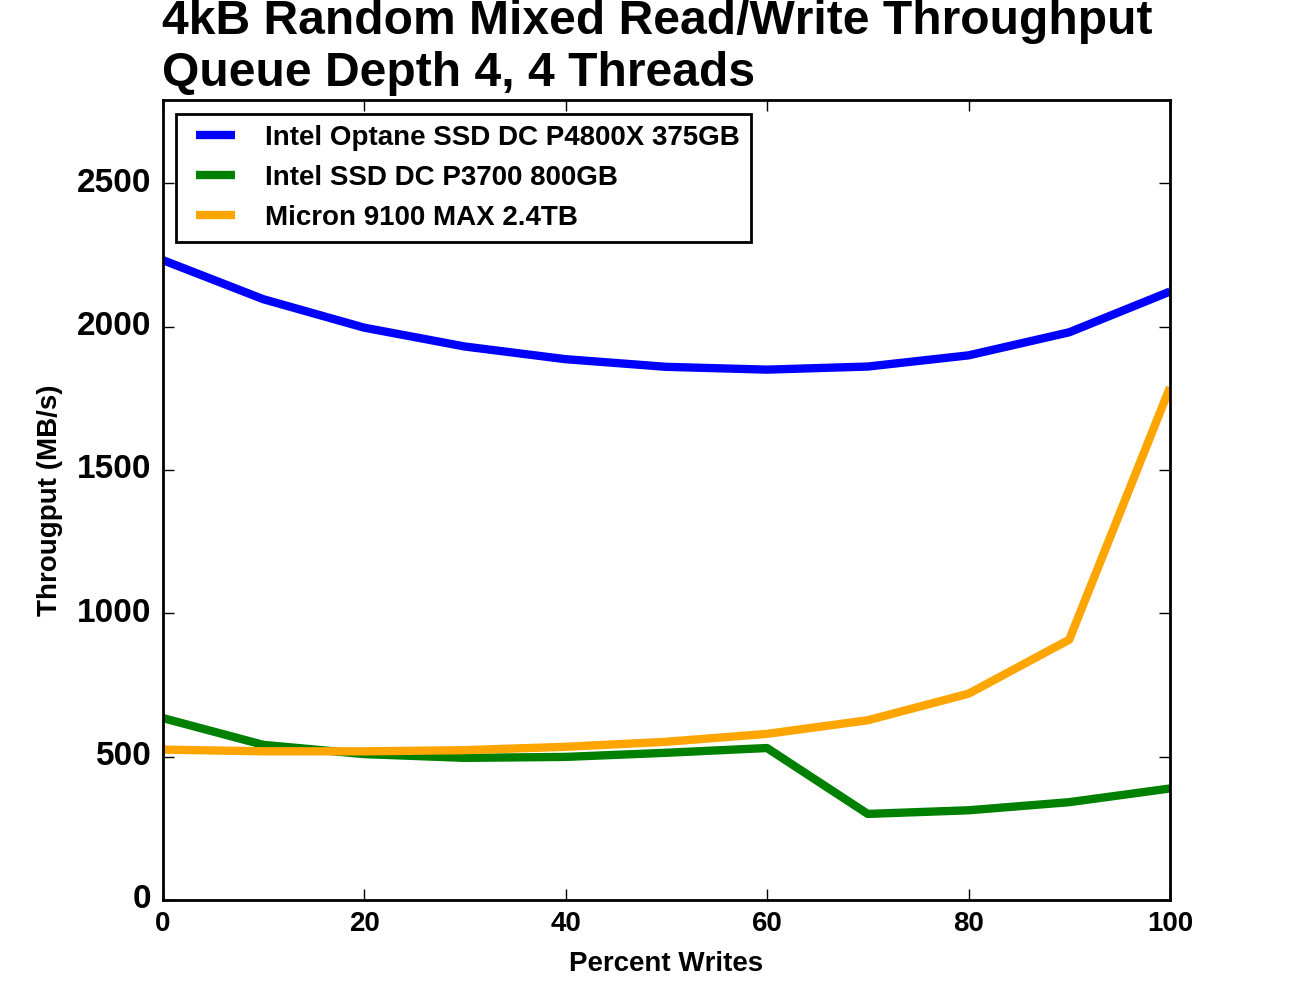
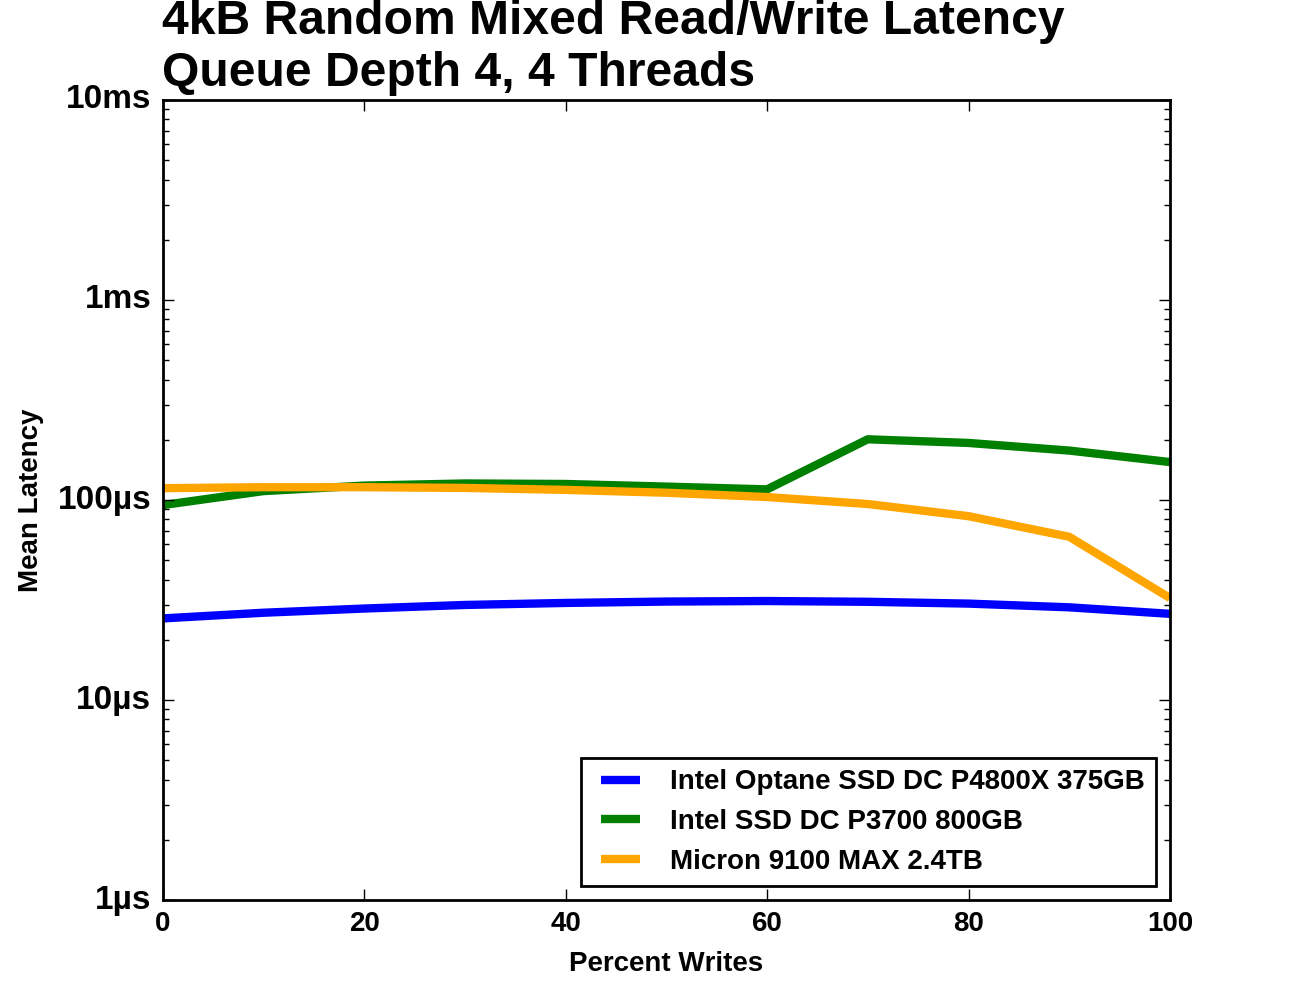
Queue Depth 4
Our first mixed workload test is an extension of what Intel describes in their specifications for throughput of mixed workloads. A total queue depth of 16 is achieved using four worker threads, each performing a mix of random reads and random writes. Instead of just testing a 70% read mixture, the full range from pure reads to pure writes is tested at 10% increments.
 |
|||||||||
| Vertical Axis units: | IOPS | MB/s | |||||||
The Optane SSD's throughput does indeed show the bathtub curve shape that is common for this sort of mixed workload test, but the sides are quite shallow and the minimum (at 40% reads/60% writes) is still 83% of the peak throughput (which occurs with the all-reads workload). While the Optane SSD is operating near 2GB/s the flash SSDs spend most of the test only slightly above 500MB/s. When the portion of writes increases to 70%, the two flash SSDs begin to diverge: the Intel P3700 loses almost half its throughput and only recovers a little of it during the remainder of the test, while the Micron 9100 begins to accelerate and comes much closer to the Optane SSD's level of performance.
 |
|||||||||
| Mean | Median | 99th Percentile | 99.999th Percentile | ||||||
The median latency curves for the two flash SSDs show a substantial drop when the median operation switches from a read to a cacheable write. The P3700's median latency even briefly drops below that of the Optane SSD, but then the Optane SSD is handling several times the throughput. The 99th and 99.999th percentile latencies for the Optane SSD are relatively flat after jumping a bit when writes are first introduced to the mix. The flash SSDs have far higher 99th and 99.999th percentile latencies through the middle of the test, but much fewer outliers during the pure read and pure write phases.
Adding Writes to a Drive that is Reading
The next mixed workload test takes a different approach and is loosely based on the Aerospike Certification Tool. The read workload is constant throughout the test: a single thread performing 4kB random reads at QD1. Threads performing 4kB random writes at QD1 and throttled to 100MB/s are added to the mix until the drive's throughput is saturated. As the write workload gets heavier, the random read throughput will drop and the read latency will increase.
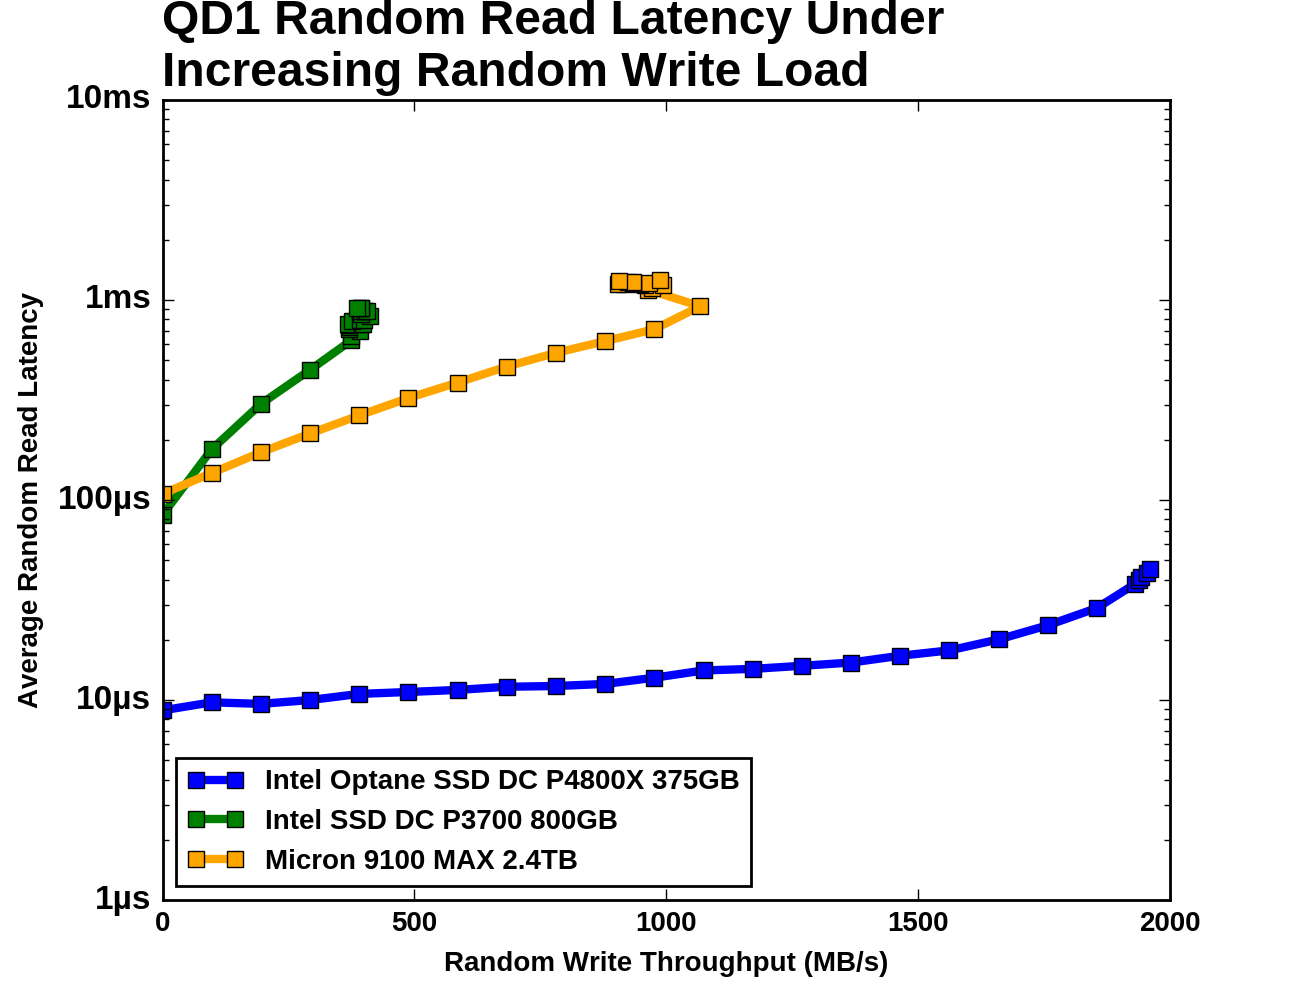
The three SSDs have very different capacity for random write throughput: the Intel P3700 tops out around 400MB/s, the Micron 9100 can sustain 1GB/s, and the Intel Optane SSD DC P4800X can sustain almost 2GB/s. The Optane SSD's average read latency increases by a factor of 5, but that still enough to provide about 25k read IOPS. The flash SSDs both experience read latency growing by an order of magnitude as write throughput approaches saturation. Even though the Intel P3700 has a much lower capacity for random writes, it provides slightly lower random read latency at its saturation point than the Micron 9100. When comparing the two flash SSDs with the same write load, the Micron 9100 provides far more random read throughput.


117 Comments
View All Comments
extide - Thursday, April 20, 2017 - link
Queue depth is how many commands the computer has queued up for the drive. The computer can issue commands to the drive faster than it can service them -- so, for example, SATA can support a queue of up to 32 commands. Typical desktop use just doesn't generate enough traffic on the drives to queue up much data so you usually are in the low 1-2, maybe 4 QD. Some server workloads can be higher, but even on a DB server, if you are seeing QD's of 16 I would say your storage is not fast enough for what you are trying to do, so being able to get good performance at low queue depths is truly a breakthrough.bcronce - Thursday, April 20, 2017 - link
For file servers, it's not just the queue depth that's important, it's the number of queues. FreeBSD and OpenZFS have had a lot of blogs and videos about the issues of scaling up servers, especially in regards to multi-core.SATA only supports 1 queue. NVMe supports up to ~65,000 with a depth of ~65,000 each. They're actually having issues saturating high end SSDs because their IO stack can't handle the throughput.
If you have a lot of SATA drives, then you effectively have many queues, but if you want a single/few super fast device(s), like say L2ARC, you need to take advantage of the new protocol.
tuxRoller - Friday, April 21, 2017 - link
The answer is something like the Linux kernel's block multiqueue (ongoing, still not the default for all devices but it shouldn't be more than a few more cycles). Its been a massive undertaking and involved rewriting many drivers.https://lwn.net/Articles/552904/
Shadowmaster625 - Thursday, April 20, 2017 - link
It is a pity intel doesnt make video cards, because 16GB of this would go very well with 4GB of RAM and a decent memory controller. It would lower the overall cost and not impact performance at all.ddriver - Friday, April 21, 2017 - link
"It would lower the overall cost and not impact performance at all."Yeah, I bet. /s
Mugur - Friday, April 21, 2017 - link
I think I read something like this when i740 was launched... :-)Sorry, couldn't resist. But the analogy stands.
ridic987 - Friday, April 21, 2017 - link
"It would lower the overall cost and not impact performance at all."What? This stuff is around 50x slower than DRAM, which itself is reaching its limits in GPUs, hence features like delta color compression... Right now when your gpu runs out of ram it uses your system ram as extra space, this is a far better system.
anynigma - Thursday, April 20, 2017 - link
"Intel's new 3D XPoint non-volatile memory technology, which has been on the cards publically for the last couple of years"I think you mean "IN the cards". In this context, "ON the cards" makes it sound like we've all been missing out on 3D xPoint PCI cards for a "couple of years" :)
SaolDan - Thursday, April 20, 2017 - link
bI think he means it like Its been in the works publicly for a couple of years.DrunkenDonkey - Thursday, April 20, 2017 - link
A bit of a suggestion - can you divide (or provide in final thoughts) SSD reviews per consumer base? Desktop user absolutely does not care about sequential performance or QD16 or even write for what matters (except for the odd time installing something). Database can't care less about sequential or low QD, etc. Giving the tables is good for the odd few % of the readers that actually know what to look for, the rest just take a look at the end of the graph and take a stunningly wrong idea. Just a few comparisons tailored per use will make it so easy for the masses. It was Anand that fought for that during the early sandforce days, he forced ocz to reconsider their ways to tweak SSDs for real world performance, not graph based and got me as a follower. Let that not die in vain and let those, that lack the specific knowledge be informed. Just look at the comments and see how people interpret the results.I know this is enterprise grade SSD, but it is also a showcase for a new technology that will come in our hands soonish.