The Intel Optane SSD DC P4800X (375GB) Review: Testing 3D XPoint Performance
by Billy Tallis on April 20, 2017 12:00 PM ESTMixed Read/Write Performance
Workloads consisting of a mix of reads and writes can be particularly challenging for flash based SSDs. When a write operation interrupts a string of reads, it will block access to at least one flash chip for a period of time that is substantially longer than a read operation takes. This hurts the latency of any read operations that were waiting on that chip, and with enough write operations throughput can be severely impacted. If the write command triggers an erase operation on one or more flash chips, the traffic jam is many times worse.
The occasional read interrupting a string of write commands doesn't necessarily cause much of a backlog, because writes are usually buffered by the controller anyways. But depending on how much unwritten data the controller is willing to buffer and for how long, a burst of reads could force the drive to begin flushing outstanding writes before they've all been coalesced into optimal sized writes.
The effect of a read still applies to the Optane SSD's 3D XPoint memory, but with greatly reduced severity. Whether a block of reads coming in has an effect depends on how the Optane SSD's controller manages the 3D XPoint memory.
Queue Depth 4
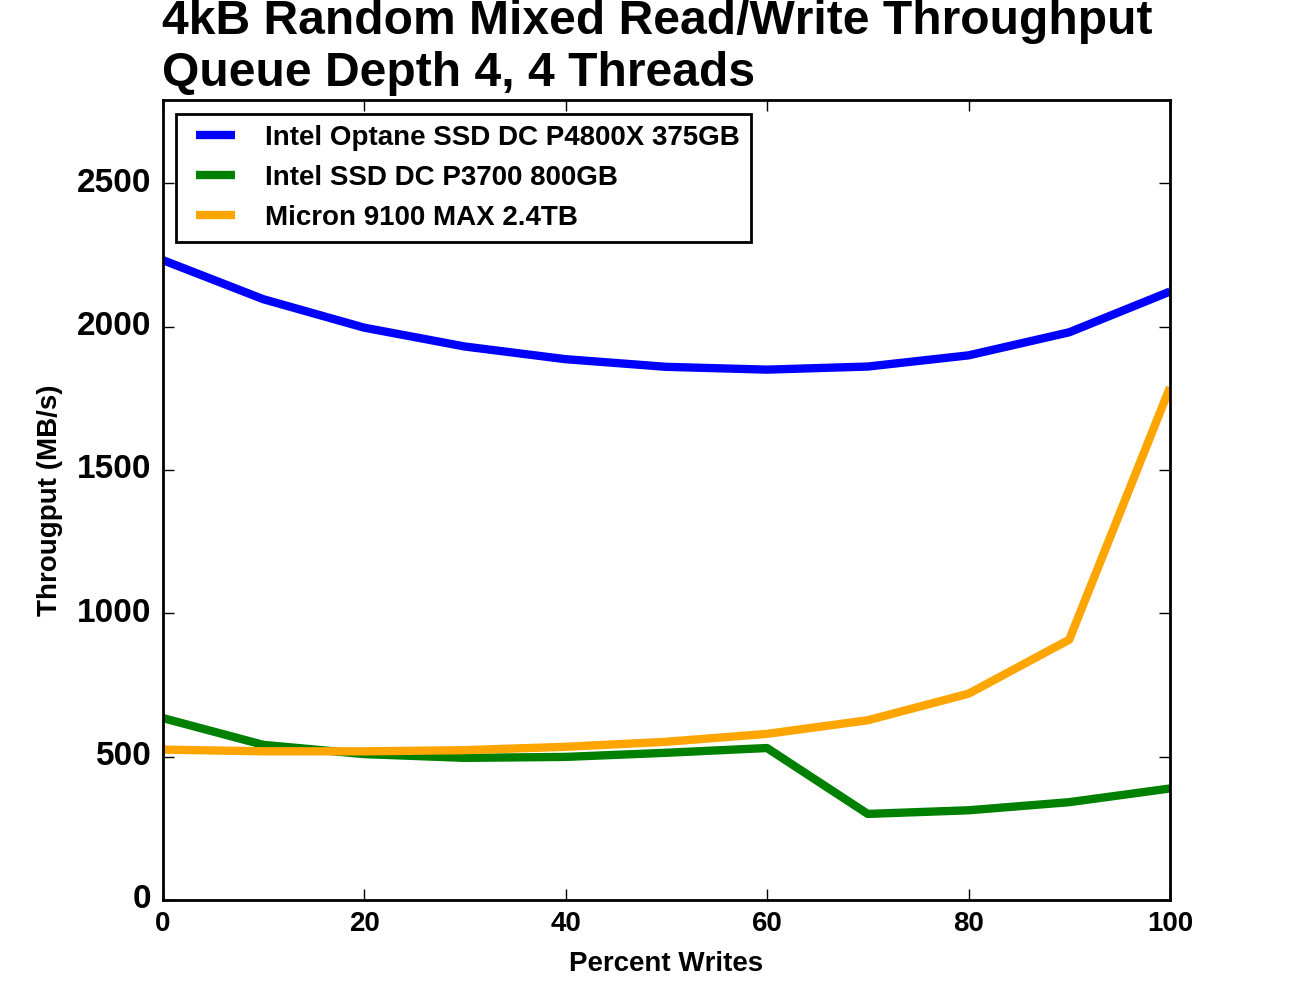
Our first mixed workload test is an extension of what Intel describes in their specifications for throughput of mixed workloads. A total queue depth of 16 is achieved using four worker threads, each performing a mix of random reads and random writes. Instead of just testing a 70% read mixture, the full range from pure reads to pure writes is tested at 10% increments.
 |
|||||||||
| Vertical Axis units: | IOPS | MB/s | |||||||
The Optane SSD's throughput does indeed show the bathtub curve shape that is common for this sort of mixed workload test, but the sides are quite shallow and the minimum (at 40% reads/60% writes) is still 83% of the peak throughput (which occurs with the all-reads workload). While the Optane SSD is operating near 2GB/s the flash SSDs spend most of the test only slightly above 500MB/s. When the portion of writes increases to 70%, the two flash SSDs begin to diverge: the Intel P3700 loses almost half its throughput and only recovers a little of it during the remainder of the test, while the Micron 9100 begins to accelerate and comes much closer to the Optane SSD's level of performance.
 |
|||||||||
| Mean | Median | 99th Percentile | 99.999th Percentile | ||||||
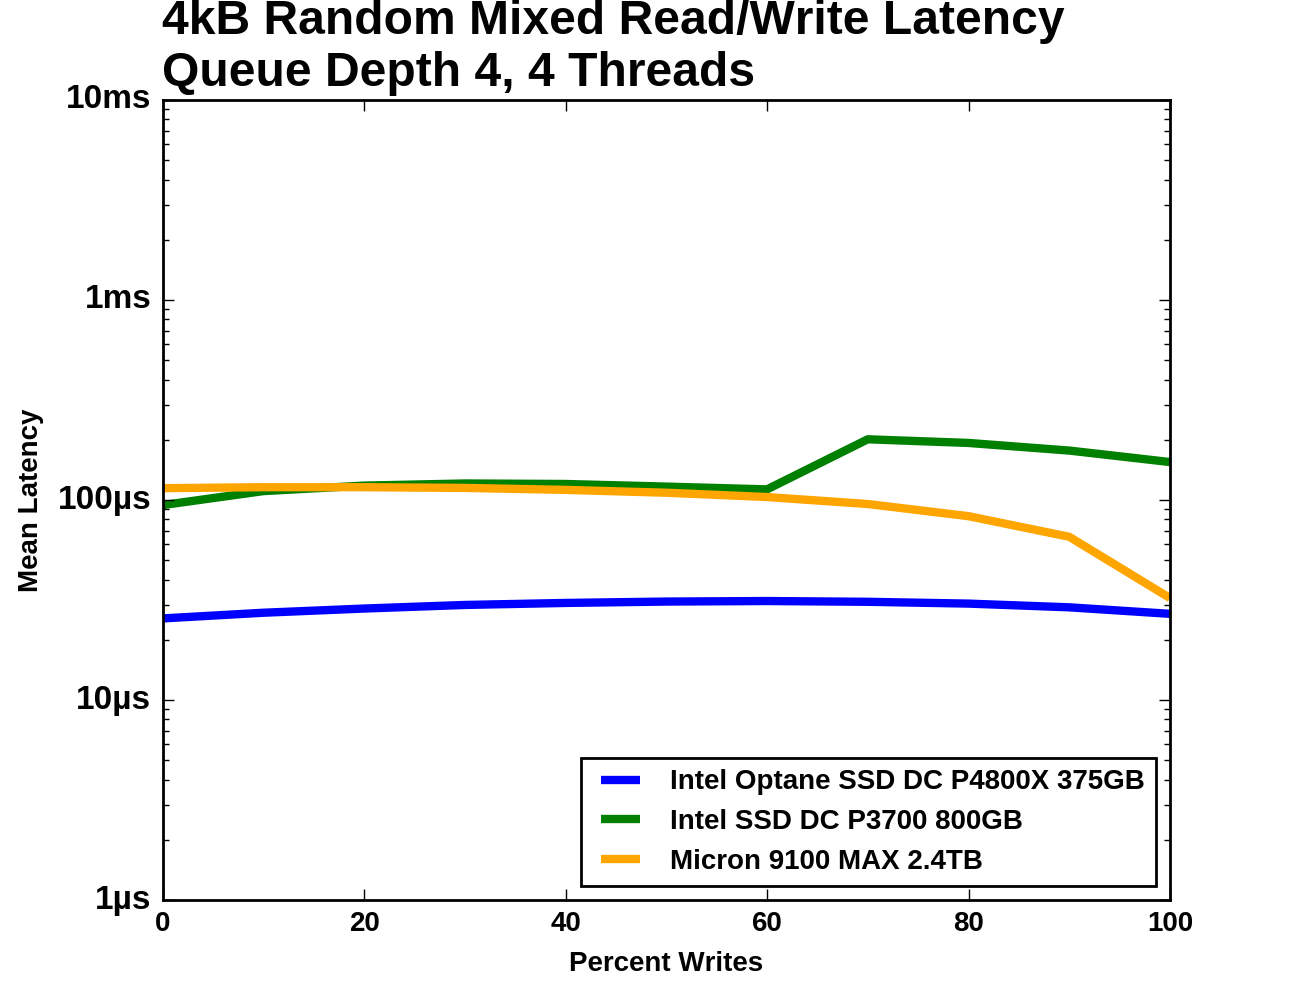
The median latency curves for the two flash SSDs show a substantial drop when the median operation switches from a read to a cacheable write. The P3700's median latency even briefly drops below that of the Optane SSD, but then the Optane SSD is handling several times the throughput. The 99th and 99.999th percentile latencies for the Optane SSD are relatively flat after jumping a bit when writes are first introduced to the mix. The flash SSDs have far higher 99th and 99.999th percentile latencies through the middle of the test, but much fewer outliers during the pure read and pure write phases.
Adding Writes to a Drive that is Reading
The next mixed workload test takes a different approach and is loosely based on the Aerospike Certification Tool. The read workload is constant throughout the test: a single thread performing 4kB random reads at QD1. Threads performing 4kB random writes at QD1 and throttled to 100MB/s are added to the mix until the drive's throughput is saturated. As the write workload gets heavier, the random read throughput will drop and the read latency will increase.
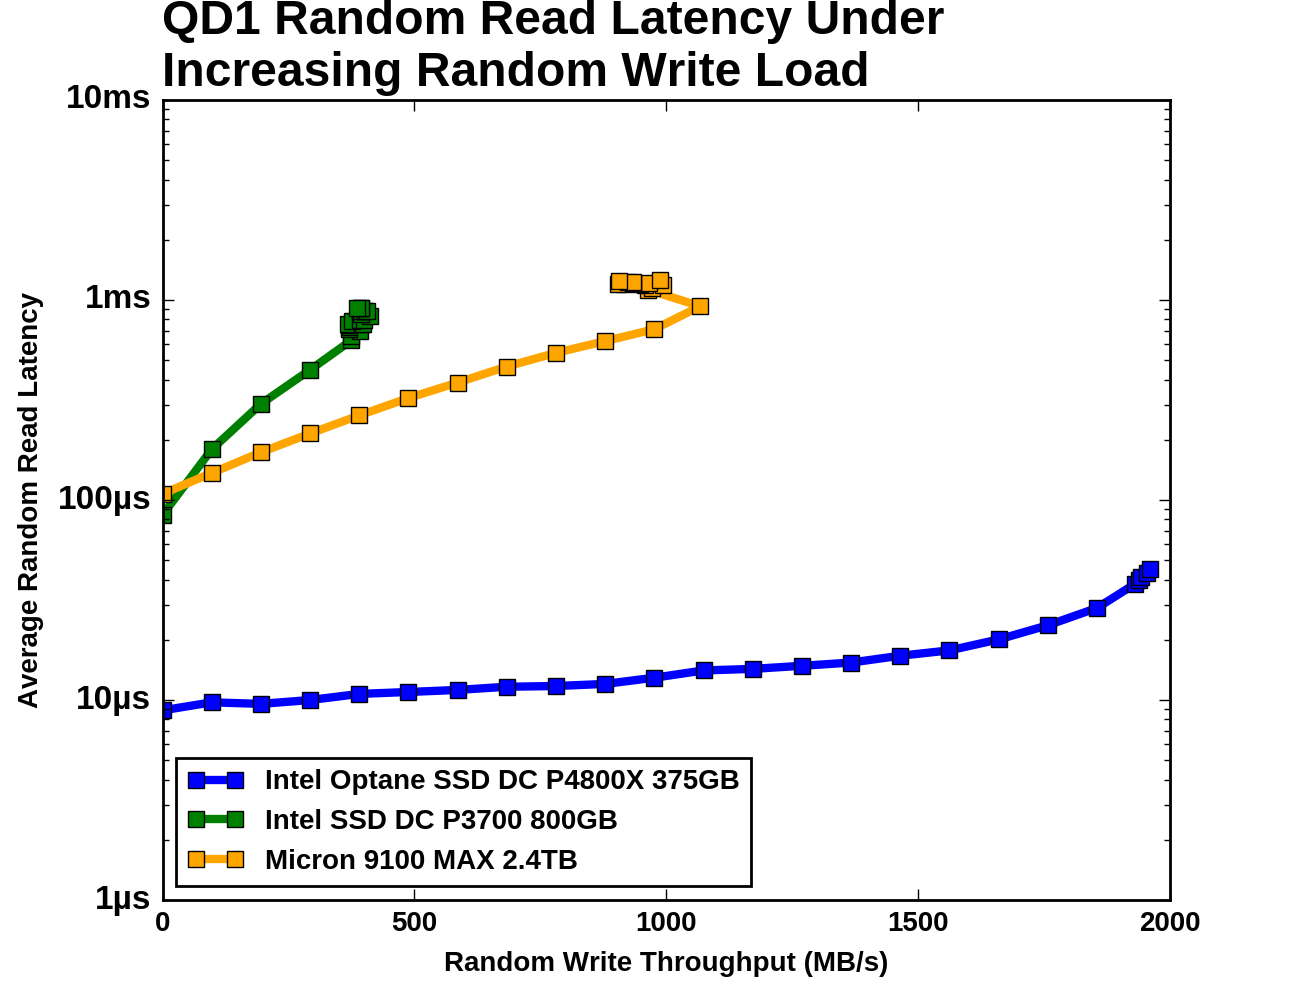
The three SSDs have very different capacity for random write throughput: the Intel P3700 tops out around 400MB/s, the Micron 9100 can sustain 1GB/s, and the Intel Optane SSD DC P4800X can sustain almost 2GB/s. The Optane SSD's average read latency increases by a factor of 5, but that still enough to provide about 25k read IOPS. The flash SSDs both experience read latency growing by an order of magnitude as write throughput approaches saturation. Even though the Intel P3700 has a much lower capacity for random writes, it provides slightly lower random read latency at its saturation point than the Micron 9100. When comparing the two flash SSDs with the same write load, the Micron 9100 provides far more random read throughput.


117 Comments
View All Comments
lilmoe - Thursday, April 20, 2017 - link
With all the Intel hype and PR, I was expecting the charts to be a bit more, um, flat? Looking at the deltas from start to finish of each benchmark, it looks like the drive has lots of characteristics similar to current flash based SSDs for the same price.Not impressed. I'll wait for your hands on review before bashing it more.
DrunkenDonkey - Thursday, April 20, 2017 - link
This is what the reviews don't explain and leave people in total darkness. You think your shiny new samsung 960 pro with 2.5g/s will be faster than your dusty old 840 evo barely scratching 500? Yes? Then you are in for a surprise - graphs look great, but check on loading times and real program/game benches and see it is exactly the same. That is why SSD reviews should always either divide to sections for the different usage or explain in great simplicity and detail what you need to look for in a PART of the graph. This one is about 8-10 times faster than your SSD so it IS impressive a lot, but price is equally impressive.lilmoe - Friday, April 21, 2017 - link
Yes, that's the problem with readers. They're comparing this to the 960 Pro and other M.2 and even SATA drives. Um.... NO. You compare this with similar form factor SSDs with similar price tags and heat sinks.And no, even QD1 benches aren't that big of a difference.
lilmoe - Friday, April 21, 2017 - link
"And no, even QD1 benches aren't that big of a difference"This didn't sound right, I meant to say that even QD1 isn't very different **compared to enterprise full PCIe SSDs*** at similar prices.
sor - Friday, April 21, 2017 - link
You're crazy. This thing is great. The current weak spot of NAND is on full display here, and xpoint is decimating it. We all know SSDs chug when you throw a lot of writes at them, all of Anandtech "performance consistency" benchmarks show that iops take a nose dive if you benchmark for more than a few seconds. Xpoint doesn't break a sweat and is orders of magnitude faster.I'm also pleasantly surprised at the consistency of sequential. A lot of noise was made about their sequential numbers not being as good as the latest SSDs, but one thing not considered is that SSDs don't hit that number until you get to high queue depths. For individual transfers xpoint seems to actually come closer to max performance.
tuxRoller - Friday, April 21, 2017 - link
I think the controllers have a lot to due with the perf.It's perf profile is eerily similar to the p3700 in too many cases.
Meteor2 - Thursday, April 20, 2017 - link
So... what is a queue depth? And what applications result in short or long QDs?DrunkenDonkey - Thursday, April 20, 2017 - link
Queue depth is concurent access to the drive, at the same time.For desktop/gaming you are looking at 4k random read (95-99% of the time), QD=1
For movie processing you are looking at sequential read/write at QD=1
For light file server you are looking at both higher blocks, say 64k random read and also sequential read, at QD=2/4
For heavy file server you go for QD=8/16
For light database you are looking for QD=4, random read/random write (depends on db type)
For heavy database you are looking for QD=16/more, random read/random write (depends on db type)
Meteor2 - Thursday, April 20, 2017 - link
Thank you!bcronce - Thursday, April 20, 2017 - link
A heavy file server only has such a small queue depth if using spinning rust, to keep down latency. When using SSDs, file servers have QDs in 64-256 range.