The Intel Optane SSD DC P4800X (375GB) Review: Testing 3D XPoint Performance
by Billy Tallis on April 20, 2017 12:00 PM ESTChecking Intel's Numbers
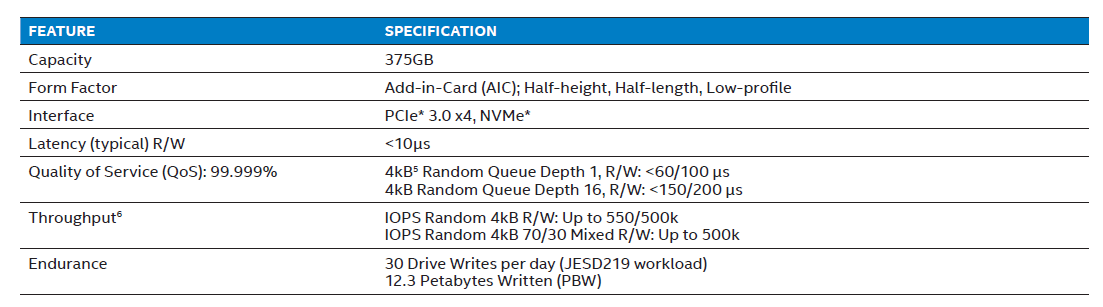
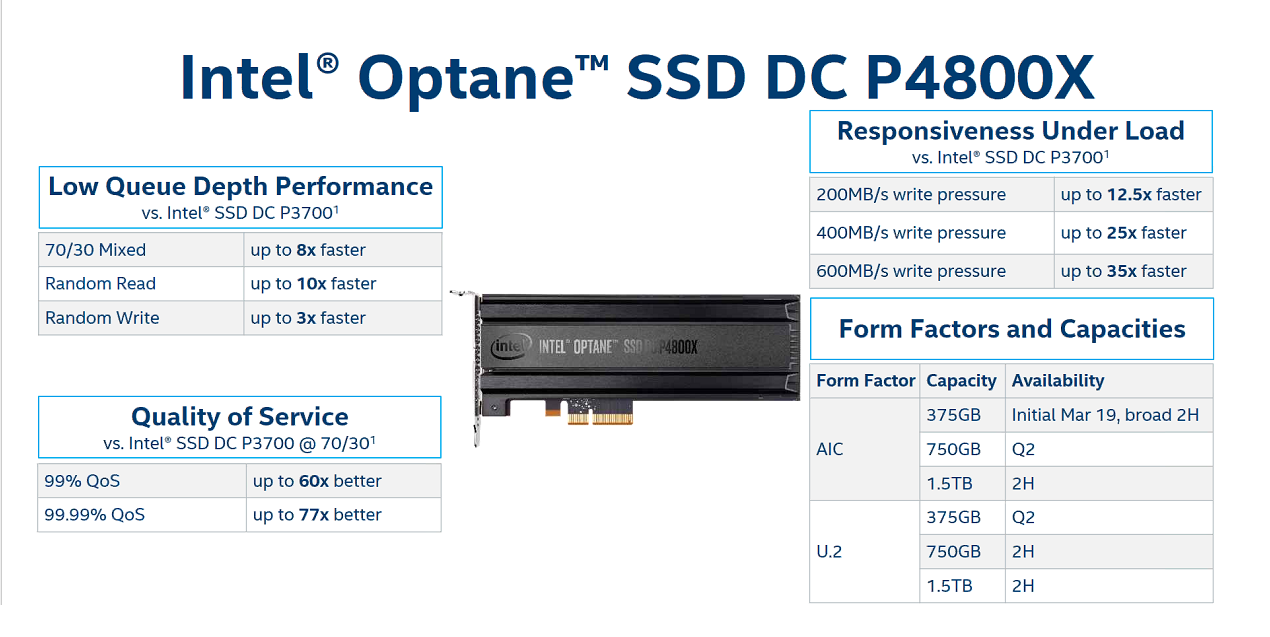
The product brief for the Optane SSD DC P4800X provides a limited set of performance specifications, entirely omitting any standards for sequential throughput. Some latency and throughput targets are provided for 4kB random reads, writes, and a 70/30 mix of reads and writes.
This section has our results for how the Optane SSD measures up to Intel's advertised specifications and how the flash SSDs fare on the same tests. The rest of this review provides deeper analysis of how these drives perform across a range of queue depths, transfer sizes, and read/write mixes.
| 4kB Random Read at a Queue Depth of 1 (QD1) | |||||||
| Drive | Throughput | Latency (µs) | |||||
| MB/s | IOPS | Mean | Median | 99th | 99.999th | ||
| Intel Optane SSD DC P4800X 375GB | 413.0 | 108.3k | 8.9 | 9 | 10 | 37 | |
| Intel SSD DC P3700 800GB | 48.7 | 12.8k | 77.9 | 76 | 96 | 2768 | |
| Micron 9100 MAX 2.4TB | 35.3 | 9.2k | 107.7 | 104 | 117 | 306 | |
Intel's queue depth 1 specifications are expressed in terms of latency, and at a throughput specification at QD1 would be redundant. Intel specifies a "typical" latency of less than 10µs, and most QD1 random reads on the Optane SSD take 8 or 9µs; even the 99th percentile latency is still 10µs.
The 99.999th percentile target is less than 60µs, which the Optane SSD beats by a wide margin. Overall, the Optane SSD passes with ease. The flash SSDs are 8-12x slower on average, and the 99.999th percentile latency of the Intel P3700 is far worse, at around 75x slower.
| 4kB Random Read at a Queue Depth of 16 (QD16) | |||||||
| Drive | Throughput | Latency (µs) | |||||
| MB/s | IOPS | Mean | Median | 99th | 99.999th | ||
| Intel Optane SSD DC P4800X 375GB | 2231.0 | 584.8k | 25.5 | 25 | 41 | 81 | |
| Intel SSD DC P3700 800GB | 637.9 | 167.2k | 93.9 | 91 | 163 | 2320 | |
| Micron 9100 MAX 2.4TB | 517.5 | 135.7k | 116.2 | 114 | 205 | 1560 | |
Intel's QD16 random read result is 584.8k IOPS for throughput, which is above the official specification of 550k IOPS by a few percent. The 99.999th percentile latency scores 81µs, significantly under the target of less than 150µs. The flash SSDs are 3-5x slower on most metrics, but 20-30 times slower at the 99.999th percentile for latency.
| 4kB Random Write at a Queue Depth of 1 (QD1) | |||||||
| Drive | Throughput | Latency (µs) | |||||
| MB/s | IOPS | Mean | Median | 99th | 99.999th | ||
| Intel Optane SSD DC P4800X 375GB | 360.6 | 94.5k | 8.9 | 9 | 10 | 64 | |
| Intel SSD DC P3700 800GB | 350.6 | 91.9k | 9.2 | 9 | 18 | 81 | |
| Micron 9100 MAX 2.4TB | 160.9 | 42.2k | 22.2 | 22 | 24 | 76 | |
In the specifications, the QD1 random write specifications are 10µs on latency, while the 99.999th percentile for latency is relaxed from 60µs to 100µs. In our results, the QD1 random write throughput (360.6 MB/s) of the Optane SSD is a bit lower than the QD1 random read throughput (413.0 MB/s), but the latency is roughly the same (8.9µs mean, 10µs on 99th).
However it is worth noting that the Optane SSD only manages a passing score when the application uses asynchronous I/O APIs. Using simple synchronous write() system calls pushes the average latency up to 11-12µs.
Also, due to the capacitor-backed DRAM caches, the flash SSDs also handle QD1 random writes very well. The Intel P3700 also manages to keep latency mostly below 10µs, and all three drives have 99.999th percentile latency below Intel's 100µs standard for the Optane SSD.
| 4kB Random Write at a Queue Depth of 16 (QD16) | |||||||
| Drive | Throughput | Latency (µs) | |||||
| MB/s | IOPS | Mean | Median | 99th | 99.999th | ||
| Intel Optane SSD DC P4800X 375GB | 2122.5 | 556.4 | 27.0 | 23 | 65 | 147 | |
| Intel SSD DC P3700 800GB | 446.3 | 117.0 | 134.8 | 43 | 1336 | 9536 | |
| Micron 9100 MAX 2.4TB | 1144.4 | 300.0 | 51.6 | 34 | 620 | 3504 | |
The Optane SSD DC P4800X is specified for 500k random write IOPS using four threads to provide a total queue depth of 16. In our tests, the Optane SSD scored 556.4k IOPs, exceeding the specification by more than 11%. This equates to a random write throughput of more than 2GB/s.
The flash SSDs are more dependent on the parallelism benefits of higher capacities, and as a result can be slow at the same capacity. Hence in this case the 2.4TB Micron 9100 fares much better than the 800GB Intel P3700. The Micron 9100 hits its own specification right on the nose with 300k IOPS and the Intel P3700 comfortably exceeds its own 90k IOPS specification, although remaining the slowest of the three by far. The Optane SSD stays well below its 200µs limit for 99.999th percentile latency by scoring 147µs, while the flash SSDs have outliers of several milliseconds. Even at the 99th percentile the flash SSDs are 10-20x slower than Optane.
| 4kB Random Mixed 70/30 Read/Write Queue Depth 16 | |||||||
| Drive | Throughput | Latency (µs) | |||||
| MB/s | IOPS | Mean | Median | 99th | 99.999th | ||
| Intel Optane SSD DC P4800X 375GB | 1929.7 | 505.9 | 29.7 | 28 | 65 | 107 | |
| Intel SSD DC P3700 800GB | 519.9 | 136.3 | 115.5 | 79 | 1672 | 5536 | |
| Micron 9100 MAX 2.4TB | 518.0 | 135.8 | 116.0 | 105 | 1112 | 3152 | |
On a 70/30 read/write mix, the Optane SSD DC P4800X scores 505.9k IOPS, which beats the specification of 500k IOPS by 1%. Both of the flash SSDs deliver roughly the same throughput, a little over a quarter of the speed of the Optane SSD. Intel doesn't provide a latency specification for this workload, but the measurements unsurprisingly fall in between the random read and random write results. While low-end consumer SSDs sometimes perform dramatically worse on mixed workloads than on pure read or write workloads, none of these drives have that problem due to their market positioning and capabilities therein.


117 Comments
View All Comments
ddriver - Friday, April 21, 2017 - link
*450 ns, by which I mean lower by 450 ns. And the current xpoint controller is nowhere near hitting the bottleneck of PCIE. It would take a controller that is at least 20 times faster than the current one to even get to the point where PCIE is a bottleneck. And even faster to see any tangible benefit from connecting xpoint directly to the memory controller.I'd rather have some nice 3D SLC (better than xpoint in literally every aspect) on PCIE for persistent storage RAM in the dimm slots. Hyped as superior, xpoint is actually nothing but a big compromise. Peak bandwidth is too low even compared to NVME NAND, latency is way too high and endurance is way too low for working memory. Low queue depths performance is good, but credit there goes to the controller, such a controller will hit even better performance with SLC nand. Smarter block management could also double the endurance advantage SLC already has over xpoint.
mdriftmeyer - Saturday, April 22, 2017 - link
ddriver is spot on. just to clarify an early comment. He's correct and the IntelUser2000 is out of his league.mdriftmeyer - Saturday, April 22, 2017 - link
Spot on.tuxRoller - Friday, April 21, 2017 - link
We don't know how much slower the media is than dram right now.We know than using dram over nvme has similar (though much better worst case) perf to this.
See my other post regarding polling and latency.
bcronce - Saturday, April 22, 2017 - link
Re-reading, I see it says "typical" latency is under 10us, placing it in spitting distance of DDR3/4. It's the 99.9999th percentile that is 60us for Q1. At Q16, 99.999th percentile is 140us. That means it takes only 140us to service 16 requests. That's pretty much the same as 10us.Read Q1 4KiB bandwidth is only about 500MiB/s, but at Q8, it's about 2GiB which puts it on par with DDR4-2400.
ddriver - Saturday, April 22, 2017 - link
"placing it in spitting distance of DDR3/4"I hope you do realize that dram latency is like 50 NANOseconds, and 1 MICROsecond is 1000 NANOseconds.
So 10 us is actually 200 times as much as 50 ns. Thus making hypetane about 200 times slower in access latency. Not 200%, 200X.
tuxRoller - Saturday, April 22, 2017 - link
Yes, the dram media is that fast but when it's exposed through nvme it has the latency characteristics that bcronce described.wumpus - Sunday, April 23, 2017 - link
That's only on a page hit. For the type of operations that 3dxpoint is looking at (4k or so) you won't find it on an open page and thus take 2-3 times as long till it is ready.That still leaves you with ~100x latency. And we are still wondering if losing the PCIe controller will make any significant difference to this number (one problem is that if Intel/Micron magically fixed this, the endurance is only slightly better than SLC and would quickly die if used as main memory).
ddriver - Sunday, April 23, 2017 - link
Endurance for the initial batch postulated from intel's warranty would be around 30k PE cycles, and 50k for the upcoming generation. That's not "only slightly better than SLC" as SCL has 100k PE cycles endurance. But the 100k figure is somewhat old, and endurance goes down with process node. So at a comparable process, SLC might be going down, approaching 50k.It remains to be seen, the lousy industry is penny pinching and producing artificial NAND shortages to milk people as much as possible, and pretty much all the wafers are going into TLC, some MLC and why oh why, QLC trash.
I guess they are saving the best for last. 3D SLC will address the lower density, samsung currently has 2 TB MLC M2, so 1 TB is perfectly doable via 3D SLC. I am guessing samsung's z-nand will be exactly that - SLC making a long overdue comeback.
tuxRoller - Sunday, April 23, 2017 - link
The endurance issue is, imho, the biggest concern right now.