The Intel Optane SSD DC P4800X (375GB) Review: Testing 3D XPoint Performance
by Billy Tallis on April 20, 2017 12:00 PM ESTMixed Read/Write Performance
Workloads consisting of a mix of reads and writes can be particularly challenging for flash based SSDs. When a write operation interrupts a string of reads, it will block access to at least one flash chip for a period of time that is substantially longer than a read operation takes. This hurts the latency of any read operations that were waiting on that chip, and with enough write operations throughput can be severely impacted. If the write command triggers an erase operation on one or more flash chips, the traffic jam is many times worse.
The occasional read interrupting a string of write commands doesn't necessarily cause much of a backlog, because writes are usually buffered by the controller anyways. But depending on how much unwritten data the controller is willing to buffer and for how long, a burst of reads could force the drive to begin flushing outstanding writes before they've all been coalesced into optimal sized writes.
The effect of a read still applies to the Optane SSD's 3D XPoint memory, but with greatly reduced severity. Whether a block of reads coming in has an effect depends on how the Optane SSD's controller manages the 3D XPoint memory.
Queue Depth 4
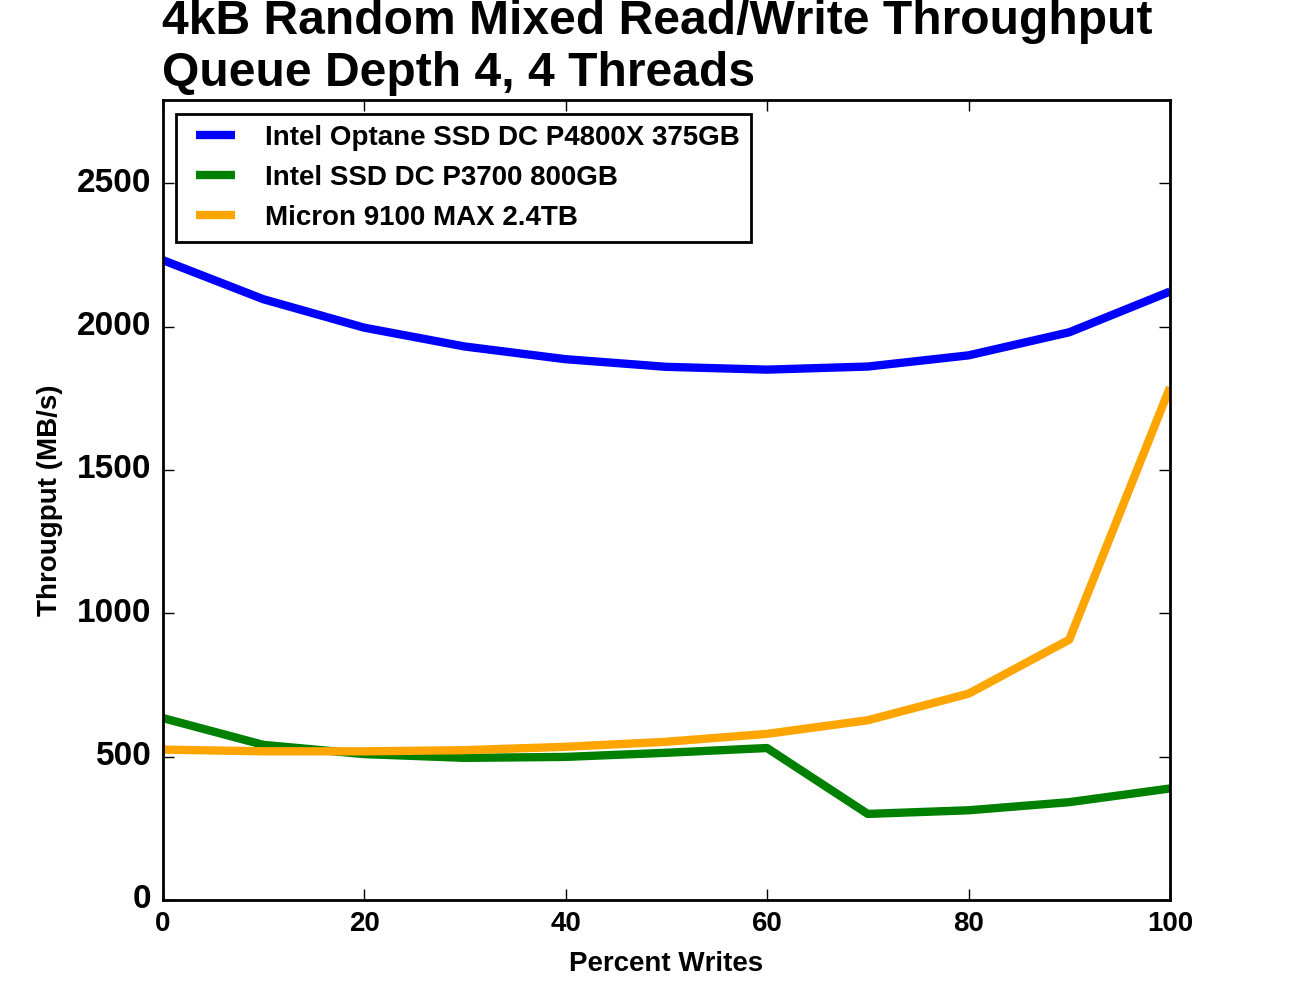
Our first mixed workload test is an extension of what Intel describes in their specifications for throughput of mixed workloads. A total queue depth of 16 is achieved using four worker threads, each performing a mix of random reads and random writes. Instead of just testing a 70% read mixture, the full range from pure reads to pure writes is tested at 10% increments.
 |
|||||||||
| Vertical Axis units: | IOPS | MB/s | |||||||
The Optane SSD's throughput does indeed show the bathtub curve shape that is common for this sort of mixed workload test, but the sides are quite shallow and the minimum (at 40% reads/60% writes) is still 83% of the peak throughput (which occurs with the all-reads workload). While the Optane SSD is operating near 2GB/s the flash SSDs spend most of the test only slightly above 500MB/s. When the portion of writes increases to 70%, the two flash SSDs begin to diverge: the Intel P3700 loses almost half its throughput and only recovers a little of it during the remainder of the test, while the Micron 9100 begins to accelerate and comes much closer to the Optane SSD's level of performance.
 |
|||||||||
| Mean | Median | 99th Percentile | 99.999th Percentile | ||||||
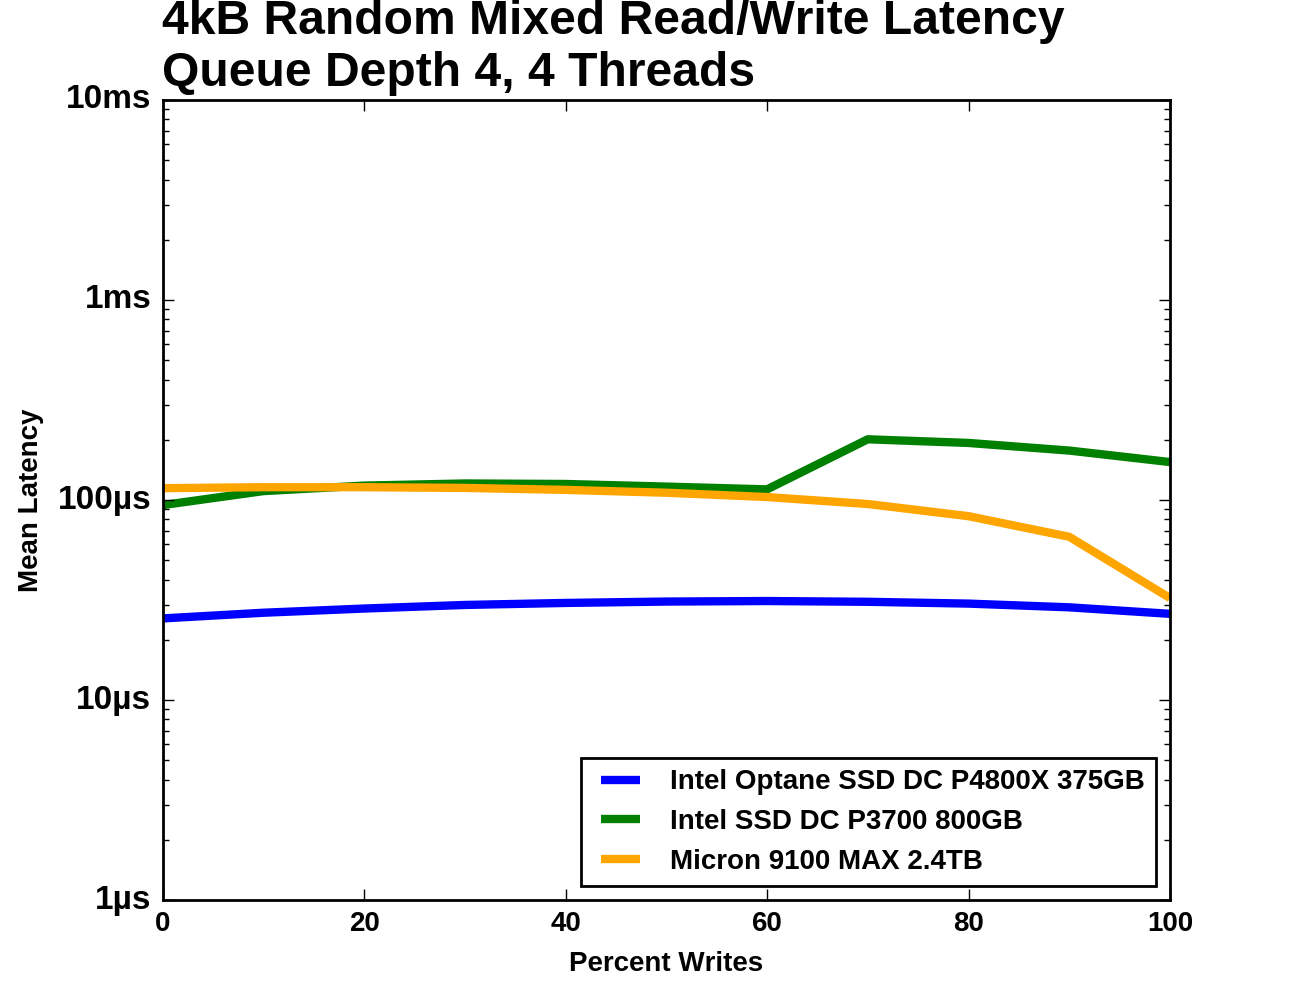
The median latency curves for the two flash SSDs show a substantial drop when the median operation switches from a read to a cacheable write. The P3700's median latency even briefly drops below that of the Optane SSD, but then the Optane SSD is handling several times the throughput. The 99th and 99.999th percentile latencies for the Optane SSD are relatively flat after jumping a bit when writes are first introduced to the mix. The flash SSDs have far higher 99th and 99.999th percentile latencies through the middle of the test, but much fewer outliers during the pure read and pure write phases.
Adding Writes to a Drive that is Reading
The next mixed workload test takes a different approach and is loosely based on the Aerospike Certification Tool. The read workload is constant throughout the test: a single thread performing 4kB random reads at QD1. Threads performing 4kB random writes at QD1 and throttled to 100MB/s are added to the mix until the drive's throughput is saturated. As the write workload gets heavier, the random read throughput will drop and the read latency will increase.
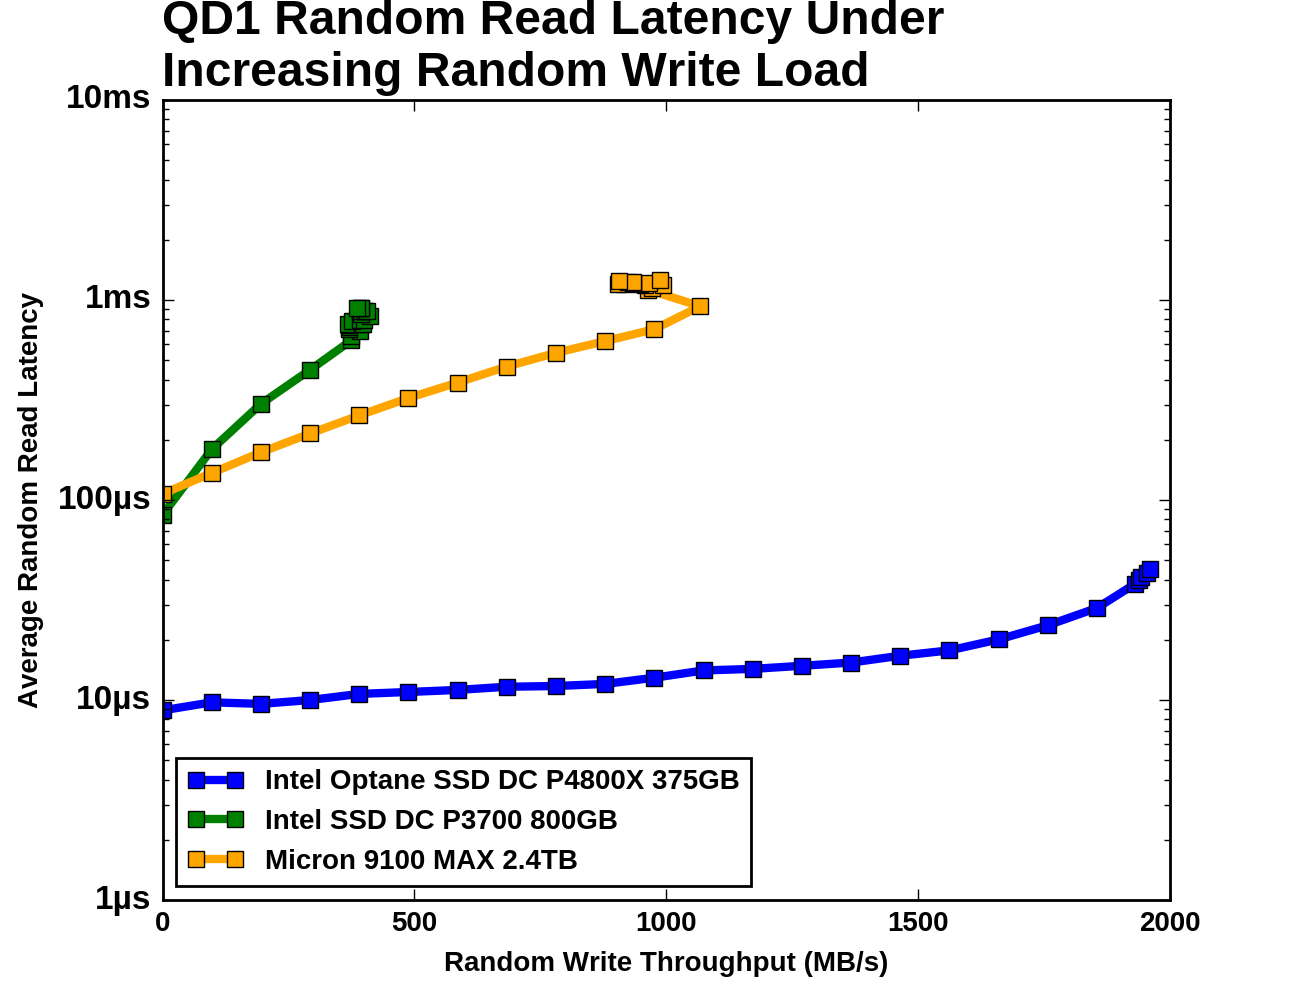
The three SSDs have very different capacity for random write throughput: the Intel P3700 tops out around 400MB/s, the Micron 9100 can sustain 1GB/s, and the Intel Optane SSD DC P4800X can sustain almost 2GB/s. The Optane SSD's average read latency increases by a factor of 5, but that still enough to provide about 25k read IOPS. The flash SSDs both experience read latency growing by an order of magnitude as write throughput approaches saturation. Even though the Intel P3700 has a much lower capacity for random writes, it provides slightly lower random read latency at its saturation point than the Micron 9100. When comparing the two flash SSDs with the same write load, the Micron 9100 provides far more random read throughput.


117 Comments
View All Comments
ddriver - Friday, April 21, 2017 - link
Then those reviews would show minuscule benefit of nvme and hypetane over a regular old ssd.DrunkenDonkey - Friday, April 21, 2017 - link
NVME yes, will show up that when you run that game on 960 pro it will take exactly same amount (-~1 sec) compared to old sata ssd. Octane however will show some 8 times faster and it will stick totally awesome in the graph. If you don't know what to look for, octane is not impressive and some new nvme ssd is actually very good compared to the old, both are untrue.ianmills - Thursday, April 20, 2017 - link
Loving how the "vertical axis units" were added after the graph for clarity. Great attention to detail Billy!serendip - Thursday, April 20, 2017 - link
How about power consumption? Could we start seeing similar hardware in tablets and phones in say, 5 years' time? We will still need DRAM for speed and low power consumption. XPoint would then make for a great system and caching drive, with slower and cheaper NAND being used for media storage, like how SSD + HDD setups are used now.Ian Cutress - Friday, April 21, 2017 - link
Literally the last two sentences in the review (and mentioned at other times):"Since our testing was remote, we have not yet even had the chance to look under the drives's heatsink, or measure the power efficiency of the Optane SSD and compare it against other SSDs. We are awaiting an opportunity to get a drive in hand, and expect some of the secrets under the hood to be exposed in due course as drives filter through the ecosystem."
random2 - Thursday, April 20, 2017 - link
"so it is interesting to see where Intel is going to lay down its line in the sand."Mixed metaphor; "lay down your cards" or "draw a line in the sand"
iwod - Friday, April 21, 2017 - link
What I really want to see, ( Not sure if Intel allows them to )Optane to put through all the test of SSD Bench. ( For Reference Only, and we would know how QD1 affect the benchmarks )
And Power Consumption.
ddriver - Friday, April 21, 2017 - link
( Not sure if Intel allows them to )Most likely the review guidelines intel mandated for this are longer than the actual review ;)
Pork@III - Friday, April 21, 2017 - link
$1520 for only 375GB...we not live in 2012. We live in 2017! If not to lie myself?tuxRoller - Friday, April 21, 2017 - link
"However it is worth noting that the Optane SSD only manages a passing score when the application uses asynchronous I/O APIs. Using simple synchronous write() system calls pushes the average latency up to 11-12µs"You mentioned "polling mode" for nvme was disabled, which is strange since that's been the default since ~4.5. Also, there are different types of polling modes, so, my hope is that the polling mode you are talking about is the new hybrid polling (introduced in 4.10, but possibly backported to your Ubuntu kernel). If not, then we know that xpoint is faster than the data you've gathered. Western Digital gave a talk at the recent Vault conference and discussed when it makes sense to poll vs reap.
Polling ends up being about 1.3x faster (average latency) than waiting for the irq (4.5us vs 6us). If you went with one of the userspace drivers, polling ends up twice as fast, but that would take much more work to benchmark.
So, considering that you're benchmarking the kinds of devices that this feature was designed for, and that we are interested in us latencies, what you've ended up benchmarking here was, to a greater extent than needed, the default kernel configuration.
http://events.linuxfoundation.org/sites/events/fil...