The AMD Zen and Ryzen 7 Review: A Deep Dive on 1800X, 1700X and 1700
by Ian Cutress on March 2, 2017 9:00 AM ESTBenchmarking Performance: CPU System Tests
Our first set of tests is our general system tests. These set of tests are meant to emulate more about what people usually do on a system, like opening large files or processing small stacks of data. This is a bit different to our office testing, which uses more industry standard benchmarks, and a few of the benchmarks here are relatively new and different.
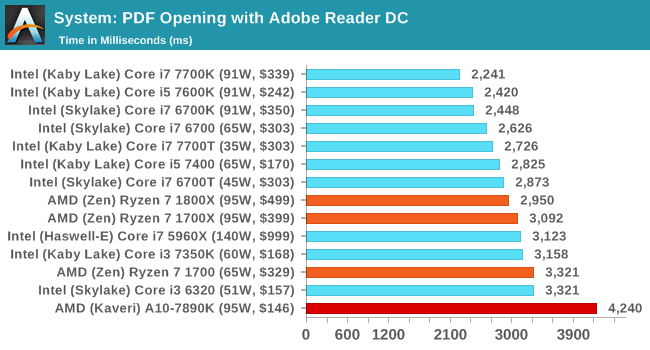
PDF Opening
First up is a self-penned test using a monstrous PDF we once received in advance of attending an event. While the PDF was only a single page, it had so many high-quality layers embedded it was taking north of 15 seconds to open and to gain control on the mid-range notebook I was using at the time. This put it as a great candidate for our 'let's open an obnoxious PDF' test. Here we use Adobe Reader DC, and disable all the update functionality within. The benchmark sets the screen to 1080p, opens the PDF to in fit-to-screen mode, and measures the time from sending the command to open the PDF until it is fully displayed and the user can take control of the software again. The test is repeated ten times, and the average time taken. Results are in milliseconds.
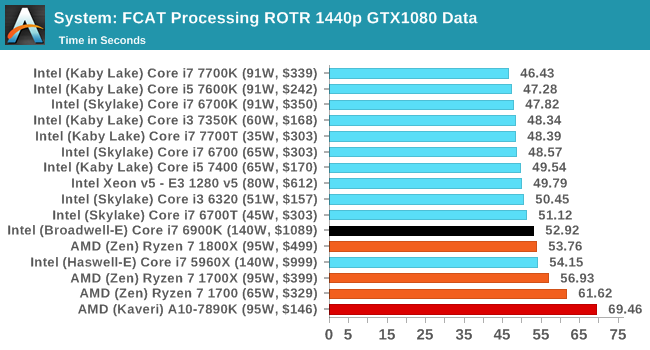
FCAT Processing
One of the more interesting workloads that has crossed our desks in recent quarters is FCAT - the tool we use to measure stuttering in gaming due to dropped or runt frames. The FCAT process requires enabling a color-based overlay onto a game, recording the gameplay, and then parsing the video file through the analysis software. The software is mostly single-threaded, however because the video is basically in a raw format, the file size is large and requires moving a lot of data around. For our test, we take a 90-second clip of the Rise of the Tomb Raider benchmark running on a GTX 980 Ti at 1440p, which comes in around 21 GB, and measure the time it takes to process through the visual analysis tool.
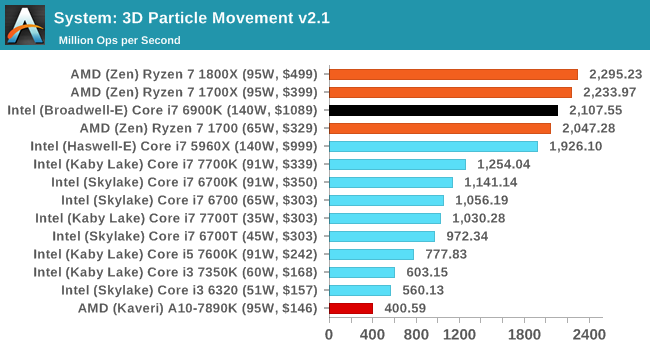
3D Particle Movement v2.1
This is the latest version of the self-penned 3DPM benchmark. The goal of 3DPM is to simulate semi-optimized scientific algorithms taken directly from my doctorate thesis. Version 2.1 improves over 2.0 by passing the main particle structs by reference rather than by value, and decreasing the amount of double->float->double recasts the compiler was adding in. It affords a ~25% speed-up over v2.0, which means new data.
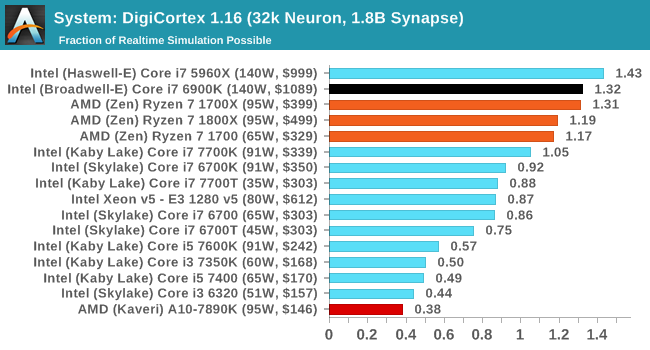
DigiCortex 1.16
Despite being a couple of years old, the DigiCortex software is a pet project for the visualization of neuron and synapse activity in the brain. The software comes with a variety of benchmark modes, and we take the small benchmark which runs a 32k neuron/1.8B synapse simulation. The results on the output are given as a fraction of whether the system can simulate in real-time, so anything above a value of one is suitable for real-time work. The benchmark offers a 'no firing synapse' mode, which in essence detects DRAM and bus speed, however we take the firing mode which adds CPU work with every firing.
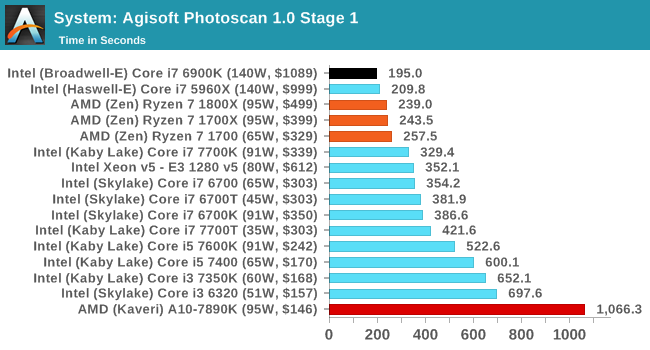
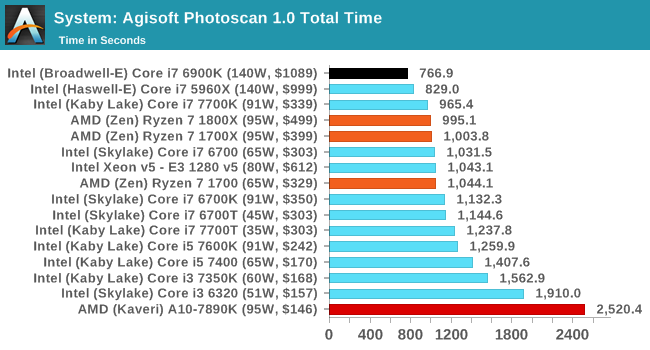
Agisoft Photoscan 1.0
Photoscan stays in our benchmark suite from the previous version, however now we are running on Windows 10 so features such as Speed Shift on the latest processors come into play. The concept of Photoscan is translating many 2D images into a 3D model - so the more detailed the images, and the more you have, the better the model. The algorithm has four stages, some single threaded and some multi-threaded, along with some cache/memory dependency in there as well. For some of the more variable threaded workload, features such as Speed Shift and XFR will be able to take advantage of CPU stalls or downtime, giving sizeable speedups on newer microarchitectures.


574 Comments
View All Comments
EchoWars - Thursday, March 2, 2017 - link
No, apparently the failure was in your education, since it's obvious you did not read the article.Notmyusualid - Friday, March 3, 2017 - link
Ha...sharath.naik - Thursday, March 2, 2017 - link
I think you missed the biggest news in this information dump. The TDP is the biggest advantage amd has. Which means that for 150watt server cpu. they should be able to cram a lot more cores than intel will be able to.Meteor2 - Friday, March 3, 2017 - link
^^^This. I think AMD's strength with Zen is going to be in servers.Sttm - Friday, March 3, 2017 - link
Yeah I can see that.UpSpin - Thursday, March 2, 2017 - link
According to a german site, in games, Ryzen is equal (sometimes higher, sometimes lower) to the Intel i7-6900K in high resolution games (WQHD). Once the resolution is set very low (720p) the Ryzen gets beaten by the Intel processor, but honestly, who cares about low resolution? For games, the probably best bet would be the i7-7700K, mainly because of the higher clock rate, for now. Once the games get better optimized for 8 cores, the 4-core i7-7700K will be beaten for sure, because in multi-threaded applications Ryzen is on par with the twice expensive Intel processor.I doubt it makes sense to buy the Core i7-6850K, it has the same low turbo boost frequency the 6900K has, thus low single threaded performance, but at only 6 cores. So I expect that it's the worst from both worlds. Poor multi-threaded performance compared to Ryzen, poor single threaded performance compared to i7-7700K.
We also have to see how well Ryzen can get overclocked, thus improving single core performance.
fanofanand - Thursday, March 2, 2017 - link
That is a well reasoned comment. Kudos!ShieTar - Thursday, March 2, 2017 - link
Well, the point of low-resolution testing is, that at normal resolutions you will always be GPU-restricted. So not only Ryzen and the i7-6900K are equal in this test, but so are all other modern and half-modern CPUs including any old FX-8...The most interesting question will be how Ryzen performs on those few modern games which manage to be CPU-restricted even in relevant resolutions, e.g. Battlefield 1 Multiplayer. But I think it will be a few more days, if not weeks, until we get that kind of in-depth review.
FriendlyUser - Thursday, March 2, 2017 - link
This is true, but at the same time this artificially magnifies the differences one is going to notice in a real-world scenario. I saw reviews with a Titan X at 1080p, while many will be playing 1440p with a 1060 or RX480.The test case must also approximate real life.
khanikun - Friday, March 3, 2017 - link
They aren't testing to show what it's like in real life though. The point of testing is to show the difference between the CPUs. Hence why they are gearing their benchmarking to stress the CPU, not other portions of the system.