The Intel Core i3-7350K (60W) Review: Almost a Core i7-2600K
by Ian Cutress on February 3, 2017 8:00 AM ESTOffice Performance
The dynamics of CPU Turbo modes, both Intel and AMD, can cause concern during environments with a variable threaded workload. There is also an added issue of the motherboard remaining consistent, depending on how the motherboard manufacturer wants to add in their own boosting technologies over the ones that Intel would prefer they used. In order to remain consistent, we implement an OS-level unique high-performance mode on all the CPUs we test which should override any motherboard manufacturer performance mode.
All of our benchmark results can also be found in our benchmark engine, Bench.
Dolphin Benchmark: link
Many emulators are often bound by single thread CPU performance, and general reports tended to suggest that Haswell provided a significant boost to emulator performance. This benchmark runs a Wii program that ray traces a complex 3D scene inside the Dolphin Wii emulator. Performance on this benchmark is a good proxy of the speed of Dolphin CPU emulation, which is an intensive single core task using most aspects of a CPU. Results are given in minutes, where the Wii itself scores 17.53 minutes.
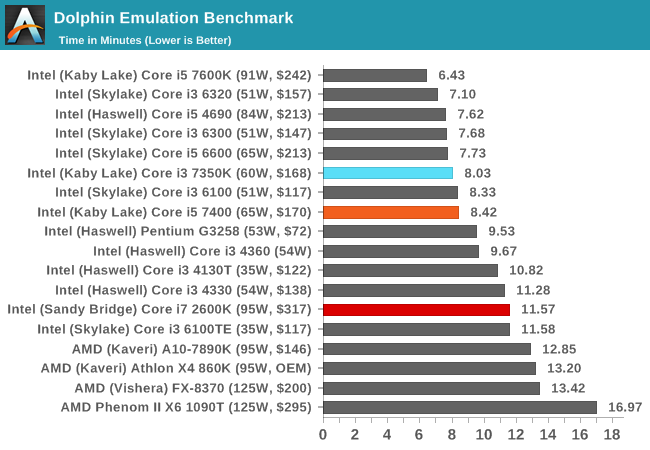
The 7350K, with a high single thread frequency, easily surpasses the i5 and i7-2600K here. That being said, there's a slight difference to the Skylake i3, perhaps down to various generation specific code differences.
WinRAR 5.0.1: link
Our WinRAR test from 2013 is updated to the latest version of WinRAR at the start of 2014. We compress a set of 2867 files across 320 folders totaling 1.52 GB in size – 95% of these files are small typical website files, and the rest (90% of the size) are small 30 second 720p videos.
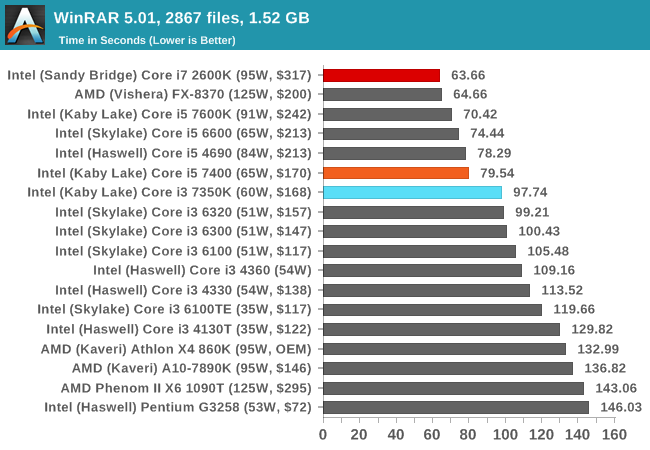
WinRAR is more geared towards a variable threaded environment but also memory speed. The fact that the Core i5 is above the Core i3 shows that having actual cores helps, regardless of frequency - the additional hyperthreads for the Core i7-2600K also gives it the win, despite the memory frequency difference.
3D Particle Movement v2
3DPM is a self-penned benchmark, taking basic 3D movement algorithms used in Brownian Motion simulations and testing them for speed. High floating point performance, MHz and IPC wins the day. This is the second variant of this benchmark, fixing for false sharing in the first version, and lending itself to better multithreaded performance.
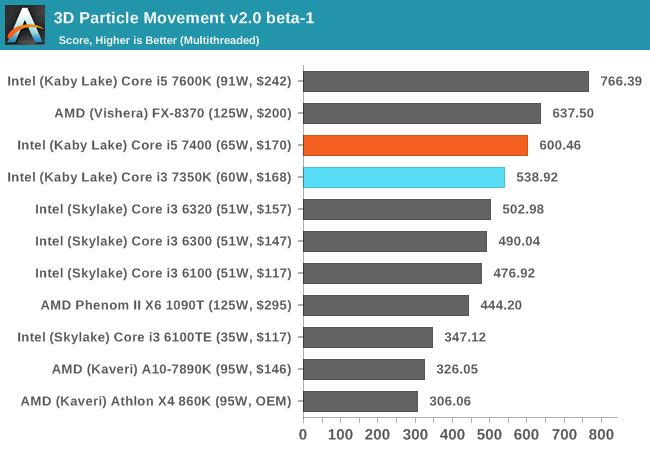
3DPMv2 is still new, so we don’t have too many results for it so far - but again this is another situation where having actual cores helps. This is typically when the threads are 'heavy', i.e. spill out into various caches and require more than 1/2 the cache shared within a core each. In the case of the Kaby Lake, this means that each core has 32KB of L1 - or 32KB per thread for the i5 but only 16KB per thread in the i3.
SYSMark 2014
Engineered by BAPco (to which Intel is a consortium member), this set of tests are designed to be an office/data/media/financial range of tests using common well-known CAD, image editing, web browsing and other tools to put out a score, where a score of 1000 is attributed to an old Core i3 using a mechanical harddrive. Here we report the overall score, however the test breakdowns can be found in Bench.
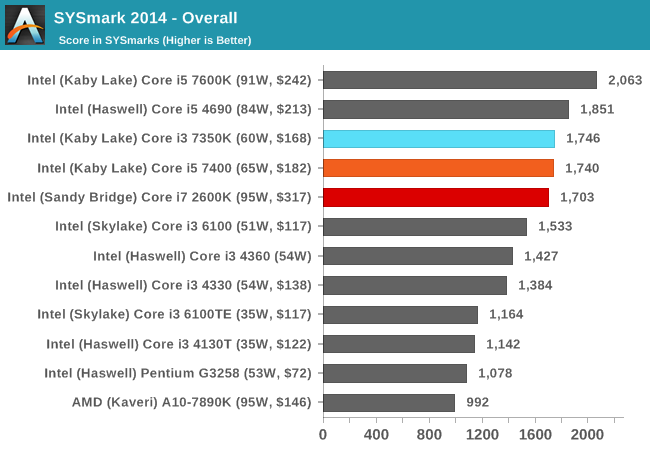
Because SYSMark is a variety of tests that rely on response and throughput, here is where the Core i3 comes into play over the i5 and i7-2600K. With the i5 it's about equal, but the years of IPC increases put the i7-2600K now behind the Kaby i3.
Web Benchmarks
On the lower end processors, general usability is a big factor of experience, especially as we move into the HTML5 era of web browsing. For our web benchmarks, we take well-known tests with Chrome as installed by SYSMark as a consistent browser.
Mozilla Kraken 1.1
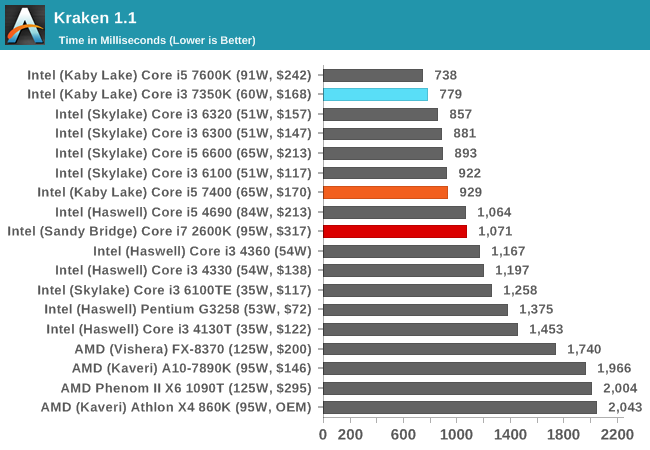
Kraken favors high frequency and IPC, so the i3 takes a large lead over the i7-2600K for this sort of workload.


186 Comments
View All Comments
Ian Cutress - Friday, February 3, 2017 - link
Next test bed update will be on W10. I keep getting mixed reactions recently from W10/W7/Linux users on this front - some want to see W10 poweeeeeer, others want default. But for DX12 it'll have to change over.CaedenV - Friday, February 3, 2017 - link
Bench-marking in win10 is... well... difficult. The OS has too many automatic features, so it is hard to get consistent results. You still get better overall performance... but not consistent performance. Win7 is gloriously dumb and gives very clear numbers to make very easy comparisons.Flunk - Friday, February 3, 2017 - link
It's a bit sad that you can compare any CPU from 2011 to one from 2017 and have them match up like this. In the 90's a CPU that was 6 years newer was many times faster than the older one. Is it lack of competition? Or have we just hit the wall with silicon chip technology?Ro_Ja - Friday, February 3, 2017 - link
Back in the days it was all about higher clock speed = faster. Nowadays it's a bit complex for me :\BrokenCrayons - Friday, February 3, 2017 - link
It's probably a combination of both, but I'd go out on a limb and say it's mostly due to technology and not so much market forces. Intel's primary competition for new processor models really ends up being its own prior generations It the company wants to land sales, it needs to offer a compelling incentive to upgrade.There's also Intel's efforts to reduce TDP over successive generations (something the company would probably not do were there more credible competitive forces in the market). Those reductions are probably a side effect of a mobile-first perspective in modern CPU design, but there's something nice about buying a reasonably power 35W desktop processor and not having to worry about copper-pipe festooned tower coolers with 120mm fans strapped on them just to keep your chip happy. If I were to build a new desktop, I'd entertain a T-series part before exploring any other option.
StrangerGuy - Friday, February 3, 2017 - link
It's funny we got big perf/watt increases over the past few years in CPUs and GPUs, yet somehow everyone are still buying massive overkill 650W+ PSUs where most systems would struggle to even draw 1/3 of the PSU rated wattage at load.I'm pretty confident that an undervolted i5 7400 and GTX 1060 (60W @ 1600MHz according to THG) would be able to draw <100W at the wall in a normal gaming load with an efficient enough PSU...
fanofanand - Friday, February 3, 2017 - link
Because MOAR POWER and marketing. Seriously, they sell the high power PSUs for a LOT more than the lower powered PSUs, it's going to take consumers buying the 300-450W psu's en masse before the manufacturers adjust. Your theoretical operates under false assumptions however. The 1060 boosts up well beyond 1600 and will consume far more than 60 watts, and there are efficiency losses in the PSU and throughout your system. Go ahead and try to run a 1060 and an undervolted i5, see what happens.t.s - Friday, February 3, 2017 - link
He said normal gaming. His number is quite possible --with good mobo, ssd, no optical drive.fanofanand - Friday, February 3, 2017 - link
No, it's not. For typical gaming the 1060 consumes between 90-120 watts. So please do tell me how his system with a 100 watt GPU is going to consume less than 100 watts with a CPU, mobo, RAM, etc.?hybrid2d4x4 - Friday, February 3, 2017 - link
As a point of reference, I have a 1060 in a i5 4670 system running a 400W Platinum PSU. All stock clocks, 1 SSD, 1 HDD. Peak power in games measured at the wall is ~200W (180-200 depending on which AAA game), so I doubt <100W is doable.But agree with the commentary about how overkill most PSUs are.