The Samsung 960 EVO (1TB) Review
by Billy Tallis on November 15, 2016 10:00 AM ESTATTO
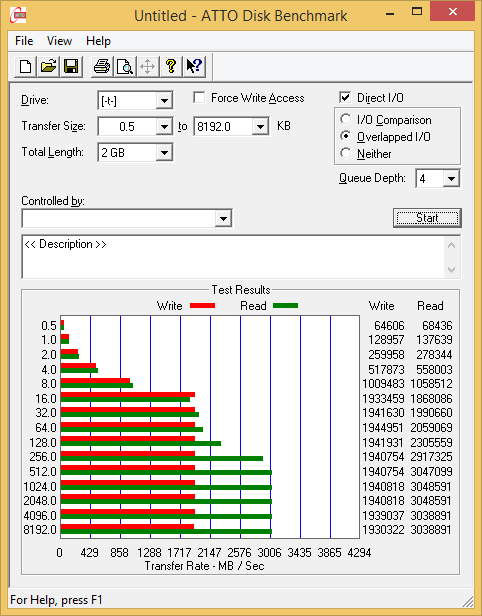
ATTO's Disk Benchmark is a quick and easy freeware tool to measure drive performance across various transfer sizes.
 |
|||||||||
By the end of the test, the 960 EVO and 960 Pro are performing identically. The 960 EVO takes longer to get up to full read speed, and the 960 Pro turns in some slightly better write speeds before thermal throttling levels things out.
AS-SSD
AS-SSD is another quick and free benchmark tool. It uses incompressible data for all of its tests, making it an easy way to keep an eye on which drives are relying on transparent data compression. The short duration of the test makes it a decent indicator of peak drive performance.
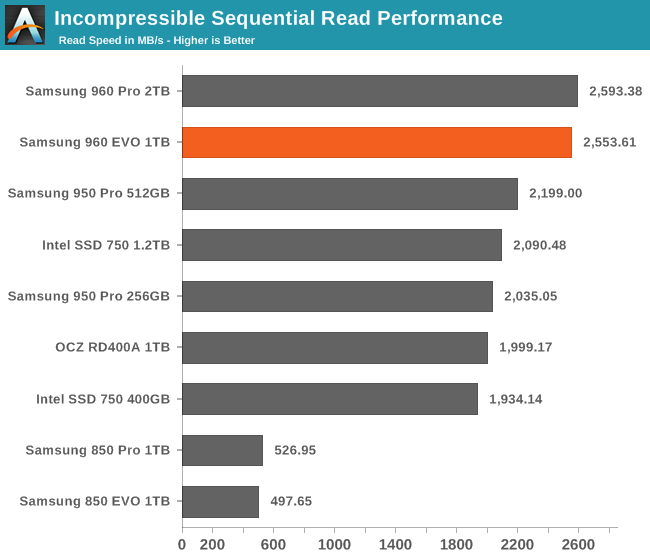
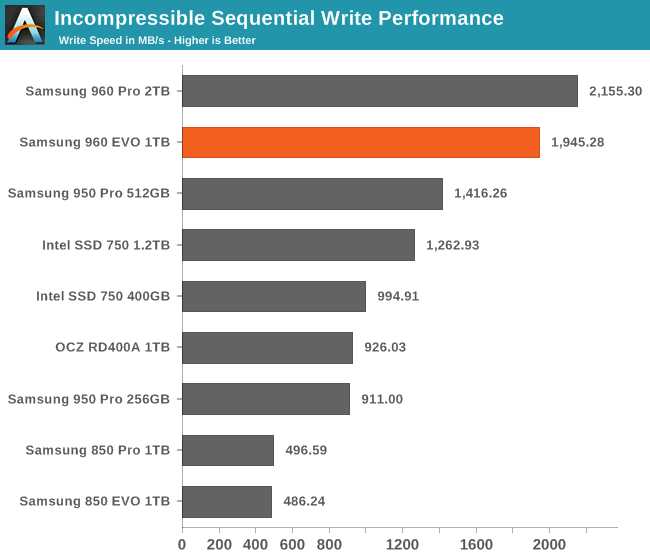
Both AS-SSD sequential tests show that the 960 EVO's peak performance really is second only to the 960 Pro, even if in longer tests some other models are able to outperform the 960 EVO.
Idle Power Consumption
Since the ATSB tests based on real-world usage cut idle times short to 25ms, their power consumption scores paint an inaccurate picture of the relative suitability of drives for mobile use. During real-world client use, a solid state drive will spend far more time idle than actively processing commands. Our testbed doesn't support the deepest DevSlp power saving mode that SATA drives can implement, but we can measure the power usage in the intermediate slumber state where both the host and device ends of the SATA link enter a low-power state and the drive is free to engage its internal power savings measures.
We also report the drive's idle power consumption while the SATA link is active and not in any power saving state. Drives are required to be able to wake from the slumber state in under 10 milliseconds, but that still leaves plenty of room for them to add latency to a burst of I/O. Because of this, many desktops default to either not using SATA Aggressive Link Power Management (ALPM) at all or to only enable it partially without making use of the device-initiated power management (DIPM) capability. Additionally, SATA Hot-Swap is incompatible with the use of DIPM, so our SSD testbed usually has DIPM turned off during performance testing.
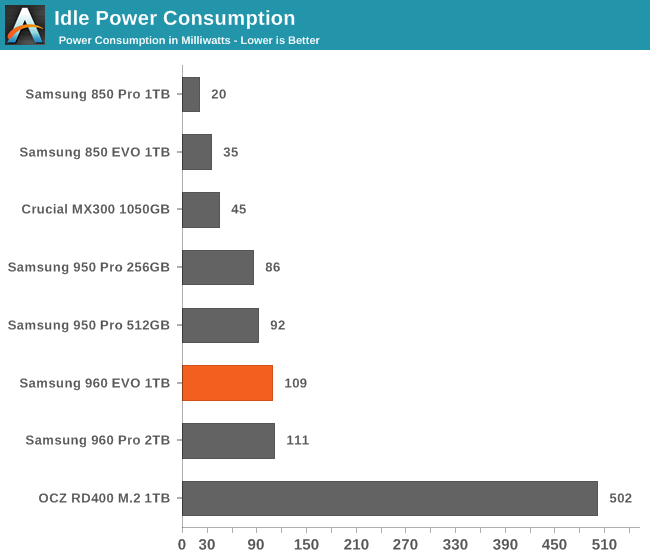
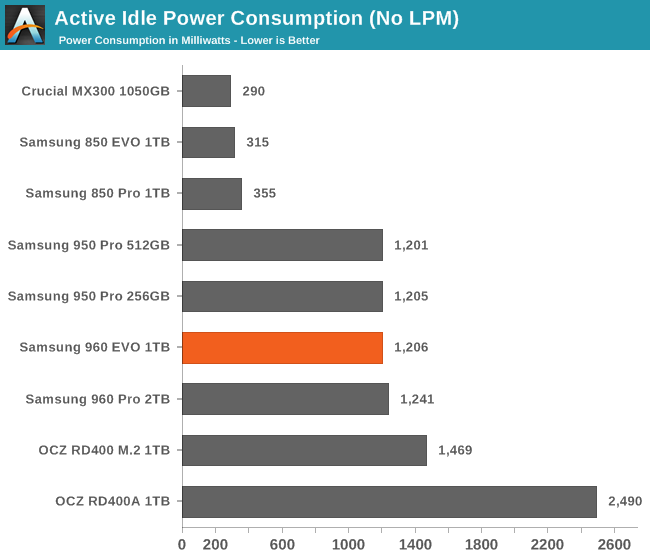
Idle power for the 960 EVO is the same as for the 960 Pro. Our usual testbed configuration does not engage any explicit power saving modes so the 960 EVO idles at 1.2 W where most SATA drives will draw much less than 1W. On systems that make use of NVMe power saving capabilities, idle power will be only a few times higher than the best SATA drives, and this is without making full use of PCIe link power management.


87 Comments
View All Comments
Lolimaster - Wednesday, November 16, 2016 - link
The pci.e speed only matters if you move with huge chunks of data such as a high res video editing. For pretty much anything else it offers nothing over sata ssd's.Flying Aardvark - Wednesday, November 16, 2016 - link
"The pci.e speed only matters if you move with huge chunks of data such as a high res video editing. For pretty much anything else it offers nothing over sata ssd's."In which case, you'd want something that won't throttle under heavy load like the Intel 750. Otherwise, the 600P makes more sense in M.2 form (if it remains cheaper than the 960 EVO).
MajGenRelativity - Tuesday, November 15, 2016 - link
While I agree that both SSD's are fantastic performers (I bought a 500GB 850 Evo), I don't think that your statement on buying other products is right. Some users cannot afford either, and a cheaper SSD would provide a nice uplift.Samus - Wednesday, November 16, 2016 - link
The 860 EVO is selling around 20% more than the 850 EVO did at launch. Just because its NVMe doesn't mean Samsung can milk that much more out of it, the Intel 600p is NVMe and it cost almost half the price. And...Intel. I get that Samsung has improved tremendously in SSD reliability but many of us still have a sour butthole from the 840 TLC drives they never really fixed and honestly, we're comparing Porsches to Ferraris here. Nobody is going to notice the difference between these drives is day-to-day tasks.close - Wednesday, November 16, 2016 - link
"And...Intel"Can't say I really agree with this "default" view since I happened to see the end-of-life behavior for some Intel SSD's. This was some years ago (4-5) so the experience might not be relevant now but for multiple SSDs when they got close to their end of life I just got a warning popup in Windows to back up my data. That's it. I foolishly made the assumption that I can just image the SSD to speed up the process only to realize after the reboot that the SSD controller just killed itself on shutdown.
This isn't the kind of behavior you expect from any data storage medium. The explanation was that Intel was trying to avoid data loss from the drive just failing due to wear. And they chose to mitigate this by triggering data loss by design choice.
While the price and performance may be good I still have to think twice (or more) when considering Intel SSDs.
Phattio - Wednesday, November 16, 2016 - link
@close: thank you for posting this. good to know!Samus - Thursday, November 17, 2016 - link
Wow interesting I've come across dozens of X25-M's and lowest health I've seen was 77% in Intel SSD Toolbox and that was a 300GB SSD320 in an exchange server. The MDB was over 100GBAscaris - Friday, December 16, 2016 - link
Have to agree; that's completely unacceptable behavior. Samsung's 840 Pro (I think it was) went way, way beyond its rated life in the TechReport test (over 1 petabyte) before finally giving up the ghost. If the Intel in question bricked itself based on published ratings, it could have cut its useful life in half. I don't know if that's how it did it... a better way (that it could feasibly have also used) would be to issue the warning when most or all of the overprovisioned spare cells have been deployed to replace those that have worn out (which ought to be a sure sign that all of the cells are close to the edge because of wear leveling)... but if anything, it should go read-only, not brick itself.DrunkenDonkey - Tuesday, November 15, 2016 - link
Billy Tallis, can you make a QD1 comparison graph alongside the mix of 1,2,4? Because average end user pretty much only cares for 4k QD1, RR, the mixed stat is more niche and not indicative. Thanks.Flying Aardvark - Wednesday, November 16, 2016 - link
Seconded. Reads like an ad otherwise.