The ASUS X99-E-10G WS Motherboard Review: 10GBase-T Networking with Intel’s X550-AT2
by Ian Cutress on November 7, 2016 9:00 AM EST- Posted in
- Motherboards
- Intel
- Asus
- 10G Ethernet
- X99
- 10GBase-T
- X99-E-10G WS
- X550
- X550-AT2
System Performance
Not all motherboards are created equal. On the face of it, they should all perform the same and differ only in the functionality they provide - however this is not the case. The obvious pointers are power consumption, but also the ability for the manufacturer to optimize USB speed, audio quality (based on audio codec), POST time and latency. This can come down to manufacturing process and prowess, so these are tested.
Power Consumption
Power consumption was tested on the system while in a single MSI GTX 770 Lightning GPU configuration with a wall meter connected to the OCZ 1250W power supply. This power supply is Gold rated, and as I am in the UK on a 230-240 V supply, leads to ~75% efficiency > 50W, and 90%+ efficiency at 250W, suitable for both idle and multi-GPU loading. This method of power reading allows us to compare the power management of the UEFI and the board to supply components with power under load, and includes typical PSU losses due to efficiency. These are the real world values that consumers may expect from a typical system (minus the monitor) using this motherboard.
While this method for power measurement may not be ideal, and you feel these numbers are not representative due to the high wattage power supply being used (we use the same PSU to remain consistent over a series of reviews, and the fact that some boards on our test bed get tested with three or four high powered GPUs), the important point to take away is the relationship between the numbers. These boards are all under the same conditions, and thus the differences between them should be easy to spot.
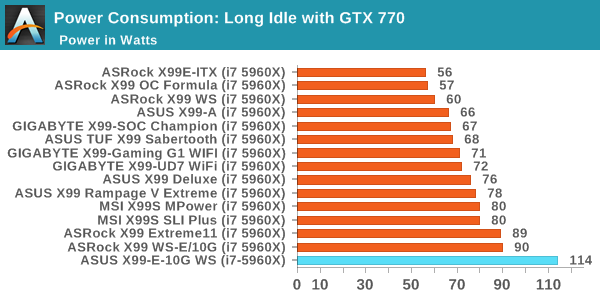
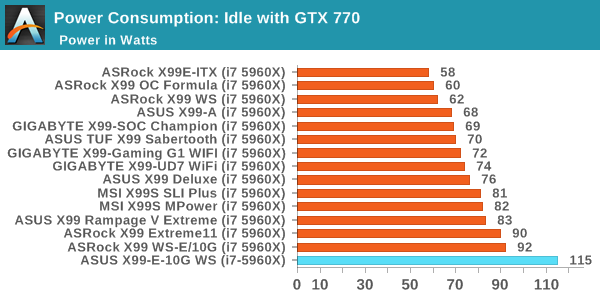
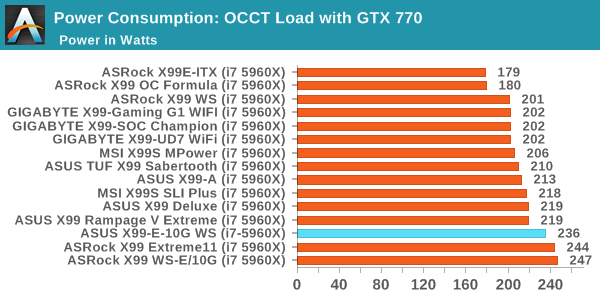
As was perhaps expected, the motherboards with the mode controllers end up drawing the most power. At idle and long idle, the X99-E-10G (at the wall) seems to consume a good portion of power, but during load the other big controller boards seem to draw more, making the CPU efficiency of the ASUS board quite good.
Non-UEFI POST Time
Different motherboards have different POST sequences before an operating system is initialized. A lot of this is dependent on the board itself, and POST boot time is determined by the controllers on board (and the sequence of how those extras are organized). As part of our testing, we look at the POST Boot Time using a stopwatch. This is the time from pressing the ON button on the computer to when Windows 7 starts loading. (We discount Windows loading as it is highly variable given Windows specific features.)
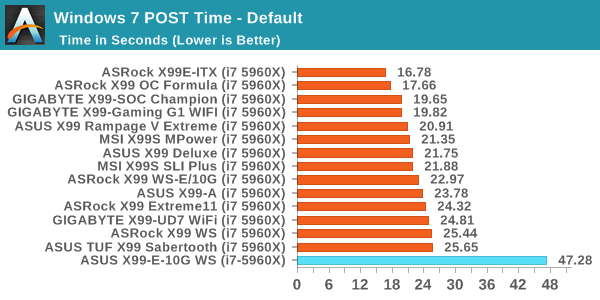
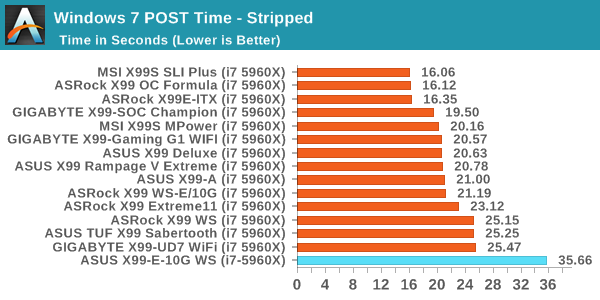
With extra controllers comes extra POST time, so moving nearer 50 seconds for a stock POST is not unexpected.
Rightmark Audio Analyzer 6.2.5
Rightmark:AA indicates how well the sound system is built and isolated from electrical interference (either internally or externally). For this test we connect the Line Out to the Line In using a short six inch 3.5mm to 3.5mm high-quality jack, turn the OS speaker volume to 100%, and run the Rightmark default test suite at 192 kHz, 24-bit. The OS is tuned to 192 kHz/24-bit input and output, and the Line-In volume is adjusted until we have the best RMAA value in the mini-pretest. We look specifically at the Dynamic Range of the audio codec used on board, as well as the Total Harmonic Distortion + Noise.
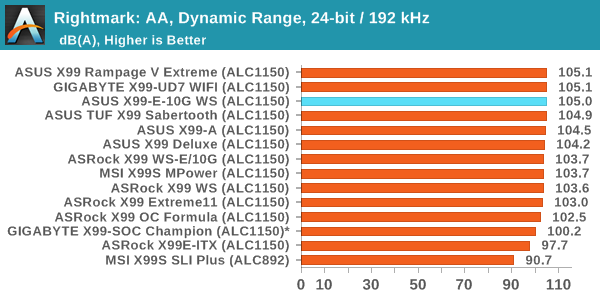
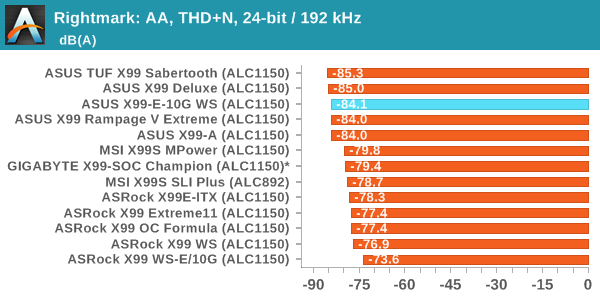
Despite audio not being a primary feature of the X99-E-10G WS, the performance (as with most ASUS boards) is in the top half of our testing and right ner the top. The fact that ASUS holds the top five spots in our X99 THD+N testing is rather impressive.
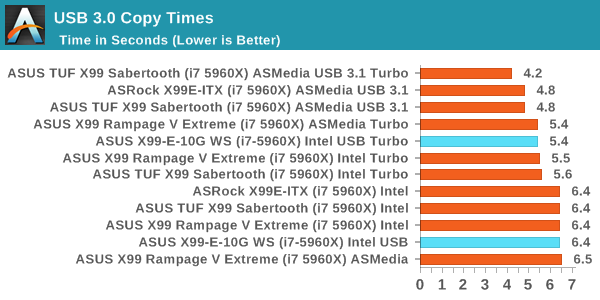
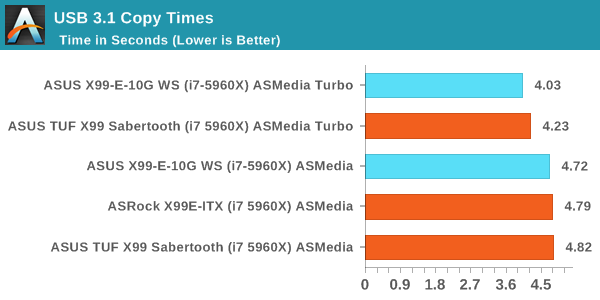
USB Backup
For this benchmark, we transfer a set size of files from the SSD to the USB drive using DiskBench, which monitors the time taken to transfer. The files transferred are a 1.52 GB set of 2867 files across 320 folders – 95% of these files are small typical website files, and the rest (90% of the size) are small 30 second HD videos. In an update to pre-Z87 testing, we also run MaxCPU to load up one of the threads during the test which improves general performance up to 15% by causing all the internal pathways to run at full speed.
Due to the introduction of USB 3.1, as of June 2015 we are adjusting our test to use a dual mSATA USB 3.1 Type-C device which should be capable of saturating both USB 3.0 and USB 3.1 connections. We still use the same data set as before, but now use the new device. Results are shown as seconds taken to complete the data transfer.
DPC Latency
Deferred Procedure Call latency is a way in which Windows handles interrupt servicing. In order to wait for a processor to acknowledge the request, the system will queue all interrupt requests by priority. Critical interrupts will be handled as soon as possible, whereas lesser priority requests such as audio will be further down the line. If the audio device requires data, it will have to wait until the request is processed before the buffer is filled.
If the device drivers of higher priority components in a system are poorly implemented, this can cause delays in request scheduling and process time. This can lead to an empty audio buffer and characteristic audible pauses, pops and clicks. The DPC latency checker measures how much time is taken processing DPCs from driver invocation. The lower the value will result in better audio transfer at smaller buffer sizes. Results are measured in microseconds.
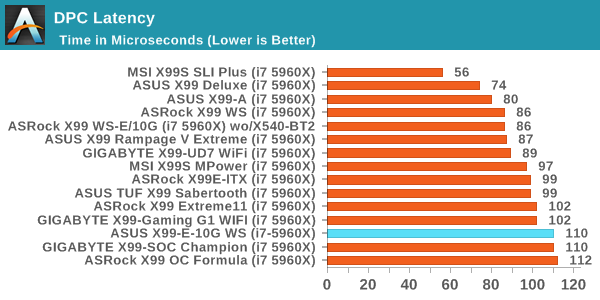
While a result of 110 is not the best X99 result, given the recent set of 250 microsecond results we've been seeing on the 100-series board, anything below that is pretty good.


63 Comments
View All Comments
SnowleopardPC - Sunday, November 27, 2016 - link
The whole 10G Copper is interesting. I have already started wiring my home with Cat 8 1200mhz ethernet cables. I skipped Cat 7 because Cat 7 is running into licensing issues like blu-ray. There are 2 companies fighting over the Cat 7 standard.Cat 8 supports 10G up to 100 meters/300 feet and potentially 25G/40 or 50G at shorter distances.
It is important for me because I am shooting with a Phase One XF and a 100mp digital back for still photography and then Red Dragons at 4 and 6k video resolutions. One of the rooms in the house has been converted to a server room with racks, switches and enterprise grade NAS appliances.
The NAS Supports 40G through 4 10G copper ports,
Hixbot - Monday, November 28, 2016 - link
Would think that fiber with SFP+ equipped gear would be more affordable and easier to work with. I have never worked with CAT8 but my thought is it must be heavy and rigid and terminating those RJ45s to Cat 8 standard must be a chore. I admit my experience in this is limited and perhaps your experience has shown that copper remains the best product for your needs.My experience working in enterprise networking has shown that fiber is the most affordable medium for multi 10G backbones between switch/server rooms, but if you want 10G to the desks/cubicle the options are limited and the market is still pushing copper to the desktop.
Me777 - Monday, May 29, 2017 - link
Compute task? What's a compute task?