The Skylake Core i3 (51W) CPU Review: i3-6320, i3-6300 and i3-6100 Tested
by Ian Cutress on August 8, 2016 9:00 AM ESTTotal War: Attila
The Total War franchise moves on to Attila, another The Creative Assembly development, and is a stand-alone strategy title set in 395AD where the main story line lets the gamer take control of the leader of the Huns in order to conquer parts of the world. Graphically the game can render hundreds/thousands of units on screen at once, all with their individual actions and can put some of the big cards to task. In our benchmark, the in-game scripted benchmark is used with the option for ‘unlimited video memory’ enabled.
For this test we used the following settings with our graphics cards:
| Total War: Attila Settings | |||
| Resolution | Quality | ||
| Low GPU | Integrated Graphics | 1280x720 | Performance |
| ASUS R7 240 1GB DDR3 | |||
| Medium GPU | MSI GTX 770 Lightning 2GB | 1920x1080 | Quality |
| MSI R9 285 Gaming 2G | |||
| High GPU | ASUS GTX 980 Strix 4GB | 1920x1080 | Quality |
| MSI R9 290X Gaming 4G | |||
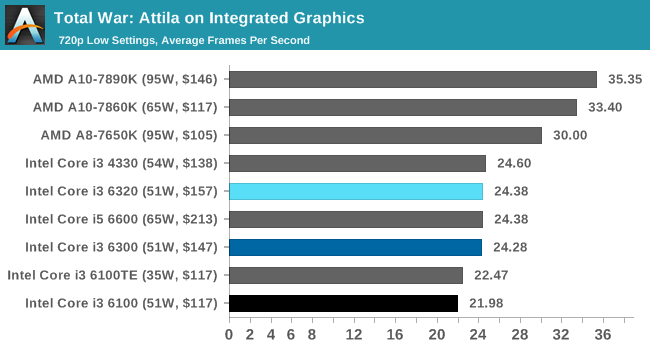
For the integrated graphics, despite the difference between the APUs and Core parts, we can see the effect of 10% GPU frequency and a smaller L3 cache has on the i3-6100 (which has 3MB). The i3-6100TE is an oddball of the group, by actually having 4MB of L3 cache, which nudges it ahead of the regular i3-6100 by a small amout. Either way, the Intel GPUs aren't great for Attila gaming at 720p Low.
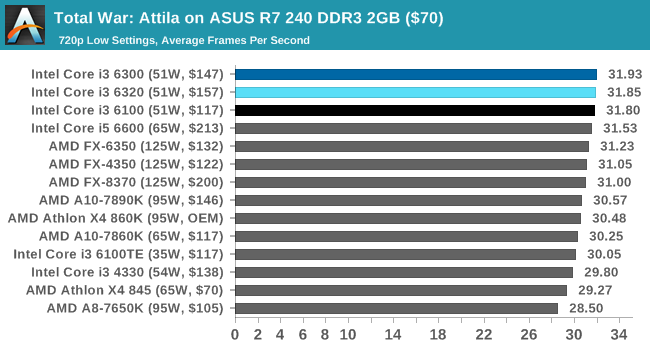
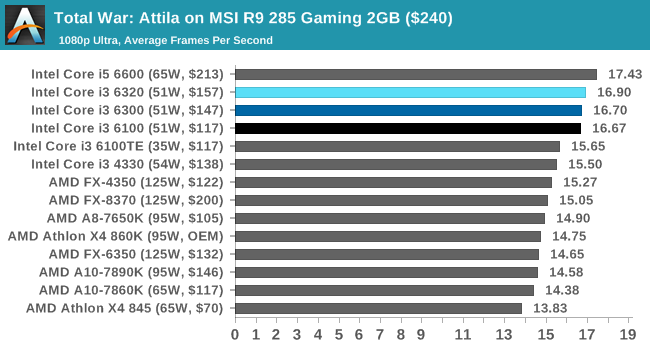
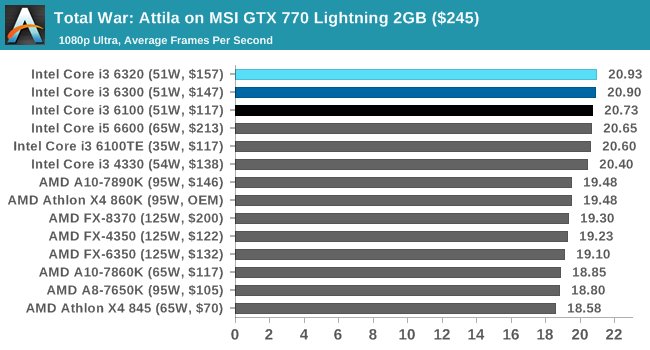
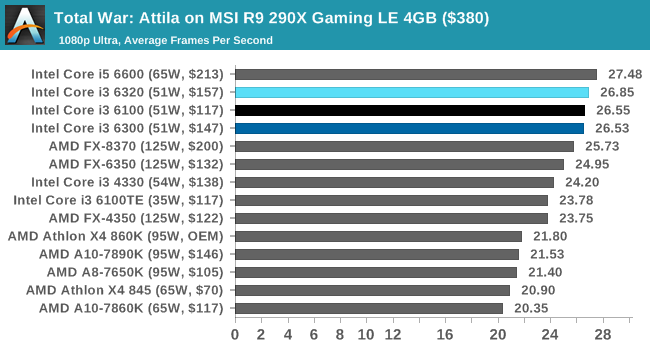
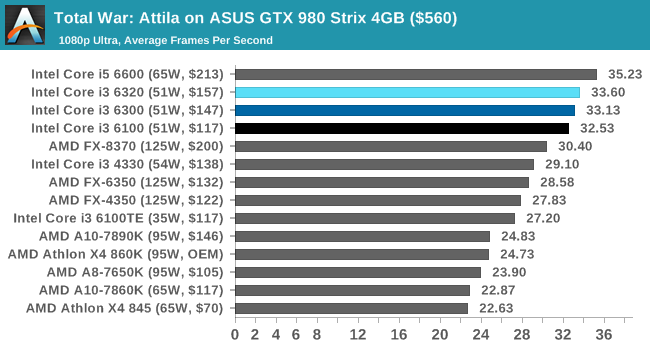
With the discrete graphics cards, the Core i3s again sit at the top or near the top in a regular staircase. Attila still seems to be a bit of a hog for frame rates at 1080p Ultra, barely scraping 30 FPS average on the GTX 980 with the Core i3 parts.


94 Comments
View All Comments
Andr3w - Friday, September 16, 2016 - link
Hello guys ! I currently own a 860k OC at 4.2 Ghz paired with a Sapphire R7 370 2gb . After consulting this review I understand that the i3-6100 paired with the same R7 370 will perform better in gaming ? Correct me if I am wrong !Note : Currently I think, the 860k bottlenecks my R7 370 in Tom Clancy The Division. I am sayng this becasue the readings from MSI Afterburner show the following stats at medium settings, 1920x1080 resolution, V-Sync off :
GPU Usage 65 - 70 % with 1800 VRAM usage
CPU Usage on all 4 cores : 98 - 100 %
On the other hand in Star Wars Battlefront, on high settings, 1920x1080 resolution, V-Sync off, I've read the following stats :
GPU Usage : 100 % with about 1700 VRAM usage
CPU Usage : 65-70 % on all 4 cores.
So will it worth changing to i3-6100 ?
KosOR - Tuesday, October 30, 2018 - link
Recently, I had an opportunity to purchase cheaper new Haswell or Skylake motherboard together with cheaper second hand i3 processor. And I searched and found this article comparing i3-6100 and i3-4330 processors. I also compared both CPUs at PassMark and UserBenchmark results (cpubenchmark.net, userbenchmark.com). The cumulative performance difference there was not greater than 15%. The 15% number seems also compatible with CPU architecture improvement and slightly higher clock speeds. That's why I was very surprised to see much higher performance difference in this article for almost all real world tests (Dolphin Benchmark, 3D Particle Movement v2, Mozilla Kraken and Google Octane v2). Personally, I could not find any logical reasons explaining those elevated performance numbers of Skylake i3 CPUs. Can anybody explain me why we see such big (greater than 30%) real world performance differences in all of those tests?KosOR - Tuesday, October 30, 2018 - link
Those higher than 15% performance numbers are also observable in 2 other test results - HandBrake v0.9.9 2x4K and Hybrid x265. Can anybody find the explanation in any of the architecture improvements from Haswell to Skylake generation of CPUs?KosOR - Tuesday, October 30, 2018 - link
Yet another absurd result is of Pentium G3420, which wins over i3 4330 on Dolphin benchmark by more than 15%. It looks absurd that 2 thread, 3.2GHz, 3 MB cache Haswell processor achieves 15% better result over 4 thread, 3.5GHz, 4 MB cache Haswell processor. Such results make me feel suspicious of all other test results on the charts, sorry.