Investigating Cavium's ThunderX: The First ARM Server SoC With Ambition
by Johan De Gelas on June 15, 2016 8:00 AM EST- Posted in
- SoCs
- IT Computing
- Enterprise
- Enterprise CPUs
- Microserver
- Cavium
Benchmarks Versus Reality
Ever run into the problem that your manager wants a clear and short answer, while the real story has lots of nuances? (ed: and hence AnandTech) The short but inaccurate answer almost always wins. It is human nature to ignore complex stories and to prefer easy to grasp answers. The graph below is a perfect illustration of that. Although this one has been produced by Intel, almost everybody in the industry, including the ARM SoC companies, love the simplicity it affords in describing the competitive situation.
The graph compares the ICC compiled & published results for SPECint_rate_base2006 with some of the claimed (gcc compiled?) results of the ARM server SoC vendors.
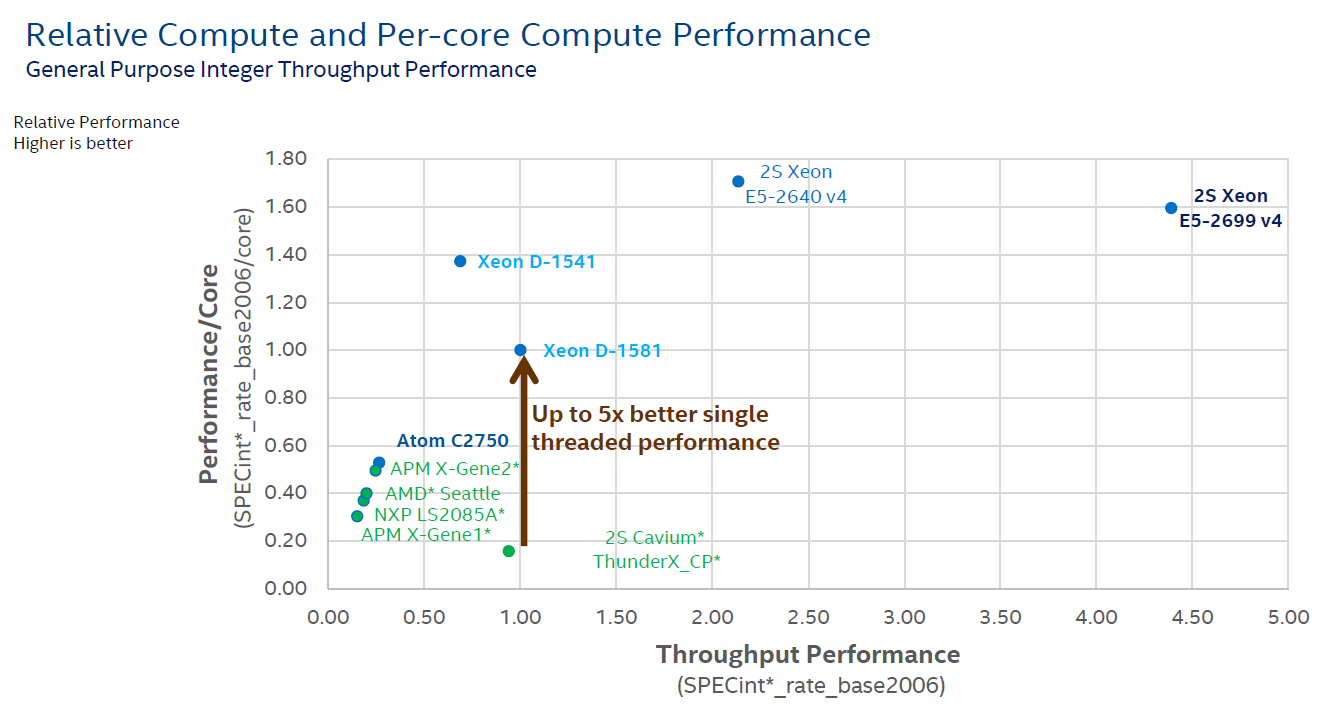
The graph shows two important performance vectors: throughput and single core performance. The former (X-axis) is self-explanatory, the latter (Y-axis) should give an indication of response times (latency). The two combined (x, y coordinate) should give you an idea on how the SoC/CPU performs in most applications that are not perfectly parallel. It is a very elegant way to give a short and crystal clear answer to anyone with a technical or scientific background.
But there are many drawbacks. The main problem is "single core performance". Since this is just diving the score by the number of cores, this favors the CPUs with some form of hardware multi-threading. But in many cases, the extra threads only help with throughput and not with latency. For example, if there are a few heavy SQL requests that keep you waiting, adding threads to a core does not help at all, on the contrary. So the graph above gives a 20% advantage to the SMT capable cores of Intel on y-axis, while hyperthreading is most of the time a feature that boosts throughput.
Secondly, dividing throughput by the number of cores means also that you favor the architectures that are able to run many instances of SPECint. In other words, it is all about memory bandwidth and cache size. So if a CPU does not scale well, the graph will show a lower per core performance. So basically this kind of graph creates the illusion of showing two performance parameters (throughput and latency), but it is in fact showing throughput and something that is more related to throughput (throughput normalized per core?) than latency. And of course, SPECint_rate is only a very inaccurate proxy for server compute performance: IPC is higher than in most server applications and there is too much emphasis on cache size and memory bandwidth. Running 32 parallel instances of an application is totally different from running one application with 32 threads.
This is definitely not written to defend or attack any vendor: many vendors publish and abuse these kind of graphs to make their point. Our point is that it is very likely that this kind of graph gives you a very inaccurate and incomplete view of the competition.
But as the saying goes, the proof is in the pudding, so let's put together a framework for comparing these high level overviews with real world testing. First step, let's pretend the graph above is accurate. So the Cavium ThunderX has absolutely terrible single threaded performance: one-fifth that of the best Xeon D, not even close to any of the other ARM SoCs. A ThunderX core cannot even deliver half the performance of an ARM Cortex-A57 core (+/- 10 points per core), which is worse than the humble Cortex-A53. It does not get any better: the throughput of a single ThunderX SoC is less than half of the Xeon D-1581. The single threaded performance of the Xeon D-1581 is only 57% of the Xeon E5-2640's and it cannot compete with the throughput of even a single Xeon E5-2640 (2S = 2.2 times the Xeon-D 1581).
Second step, do some testing instead of believing vendor claims or published results from SPEC CPU2006. Third step, compare the graph above with our test results...


82 Comments
View All Comments
JohanAnandtech - Wednesday, June 15, 2016 - link
Good suggestion. I have been using an ipmi client to manage several other servers, like the IBM servers. However, such a GUI client is still a bit more userfriendly, ipmi commands can get complicated if you don't use them regularly. The thing is that HP and Intel's BMC GUI are a lot easier to use and more reliable.fanofanand - Wednesday, June 15, 2016 - link
I think you may have an inaccurate figure of 141 at idle (in the graph) for the Thunder. "makes us suspect that the chip is consuming between 40 and 50W at idle, as measured at the wall"JohanAnandtech - Wednesday, June 15, 2016 - link
If you look at the Column "peak vs idle", you see 82W. At peak, we assume that a 120W TDP chip will probably need about 130W. 130W - 82W (both measured at the wall) = 50W for the SoC alone at idle measured at the wall, so anywhere between 40-50W in reality. My Calculation is a "guestimate", but it is clear that the Cavium chip needs much more in idle than the Intel chips.(10-15W) .djayjp - Wednesday, June 15, 2016 - link
Many spelling/grammar issues here. It impacts readability. Please read before posting.djayjp - Wednesday, June 15, 2016 - link
That is to say in the article.mariush - Wednesday, June 15, 2016 - link
These guys are already working on ThunderX2 (54 cores, 3 Ghz , 14nm , ARMv8) and they already have functional chips : https://www.youtube.com/watch?v=ei9uVskwPNEMeteor2 - Thursday, June 16, 2016 - link
It's always jam tomorrow, isn't it? Intel is working on new chips too, you know.beginner99 - Wednesday, June 15, 2016 - link
It loses very clearly in performance/watt to Xeon-D. In this segment the lower price doesn't matter in that case and the fact that it has a process disadvantage doesn't matter either. What counts is the end result. And I doubt it would cost $800 if made on 14/16nm. I mean why would anyone buying this take the risk? Safer bet to go with Intel also due to more flexible use (single and multi threaded). The latency issue is mentioned but downplayed.blaktron - Wednesday, June 15, 2016 - link
So downplayed. Anandtech desperately wants ARM servers, but its a solution looking for a problem. Big web front ends running on bare metal are such a small percentage of the server market that developing for it seems stupid. Xeon-D was already in development for SANs, they just repurposed it for docker and nginx.Senti - Wednesday, June 15, 2016 - link
Very nice article. I especially liked the emphasis on relations of test numbers and real world workloads and what was problematic during the testing.It would be great to see the same style desktop CPU review (Zen?) form you instead of mix of reprinted marketing hype with silly benchmark numbers dump that plagues this site for quite some time now.
Some annoying typos here and there, like "It is clear that the ThunderX is a match for high frequency trading", but nothing really bad.