The SanDisk X400 1TB SSD Review
by Billy Tallis on May 6, 2016 9:00 AM ESTMixed Random Read/Write Performance
The mixed random I/O benchmark starts with a pure read test and gradually increases the proportion of writes, finishing with pure writes. The queue depth is 3 for the entire test and each subtest lasts for 3 minutes, for a total test duration of 18 minutes. As with the pure random write test, this test is restricted to a 16GB span of the drive, which is empty save for the 16GB test file.
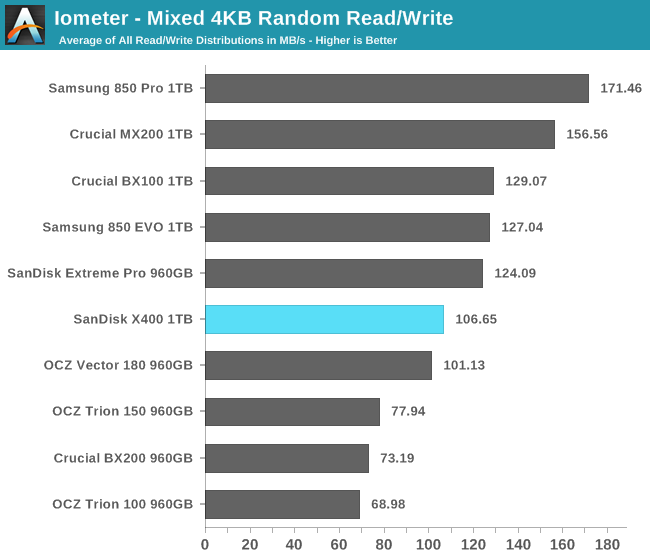
The mixed random I/O performance of the X400 is in the middle of the pack, slightly ahead of the MLC-based OCZ Vector 180 and significantly faster than the other three planar TLC drives.
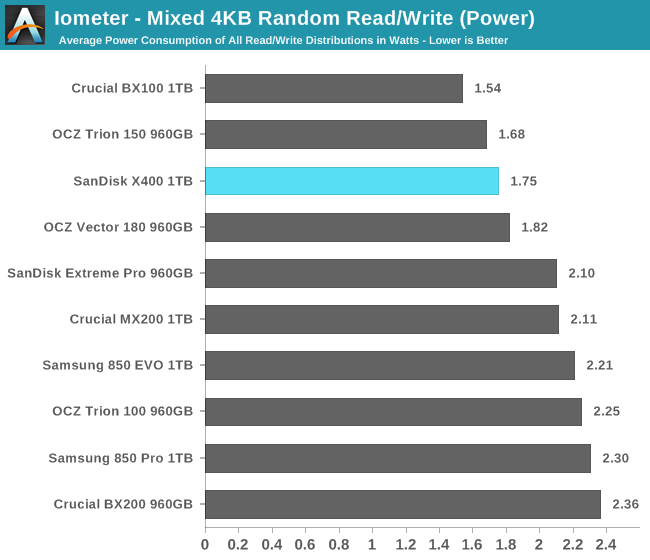
The X400 is once again the most power efficient planar TLC drive by a wide margin, and also ahead of a few of the MLC drives.
 |
|||||||||
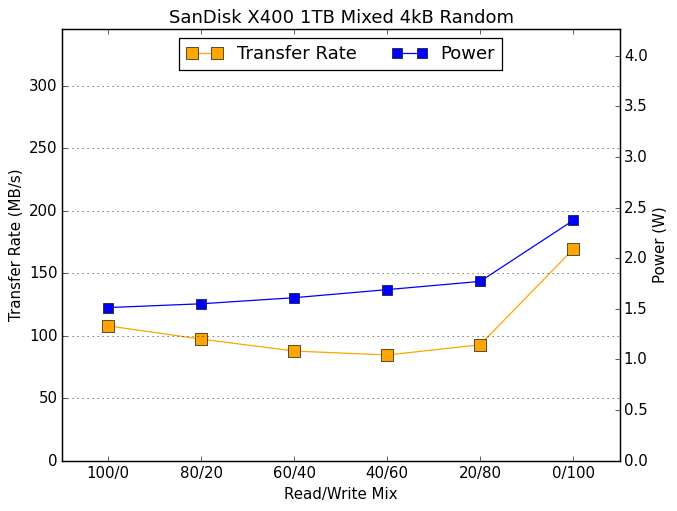
As the proportion of writes increases, the X400's power consumption grows quite slowly. Performance does suffer in the middle of the test and the spike at the end when the test shifts to pure writes is smaller than for the MLC drives and the 850 EVO.
Mixed Sequential Read/Write Performance
The mixed sequential access test covers the entire span of the drive and uses a queue depth of one. It starts with a pure read test and gradually increases the proportion of writes, finishing with pure writes. Each subtest lasts for 3 minutes, for a total test duration of 18 minutes. The drive is filled before the test starts.
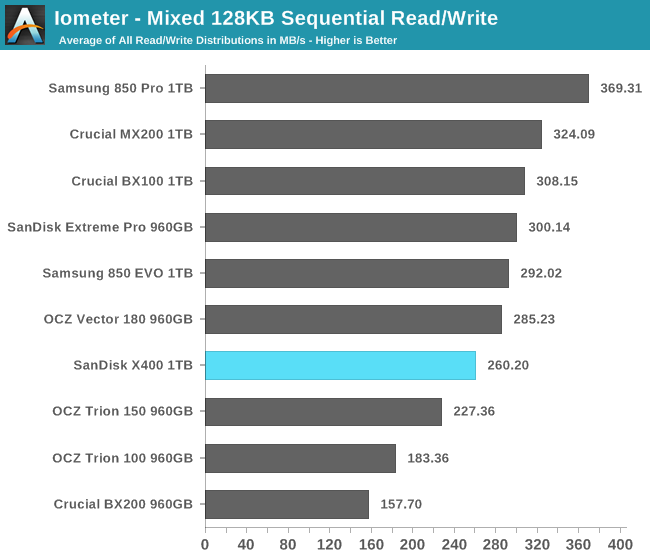
The mixed sequential I/O performance of the SanDisk X400 is not able to match any of the MLC drives, but is still comfortably ahead of the other planar TLC drives.
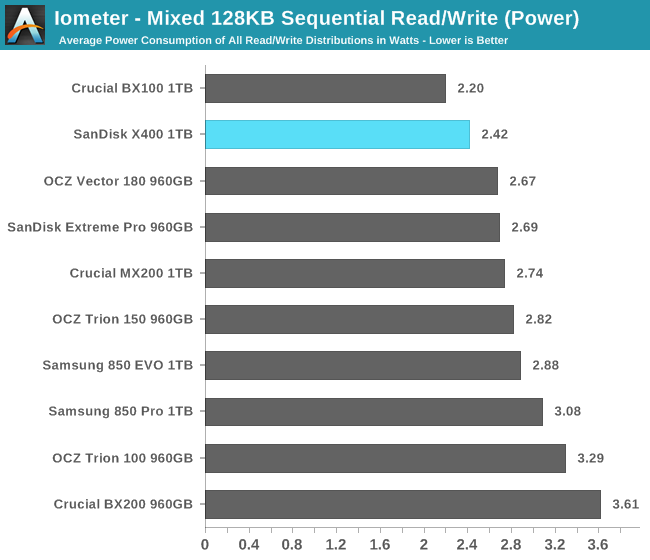
Average power consumption on the mixed sequential test is lower than everything other than the Crucial BX100, and the SanDisk X400 manages to tie the Vector 180 for efficiency, but otherwise it stands above only the other planar TLC drives.
 |
|||||||||
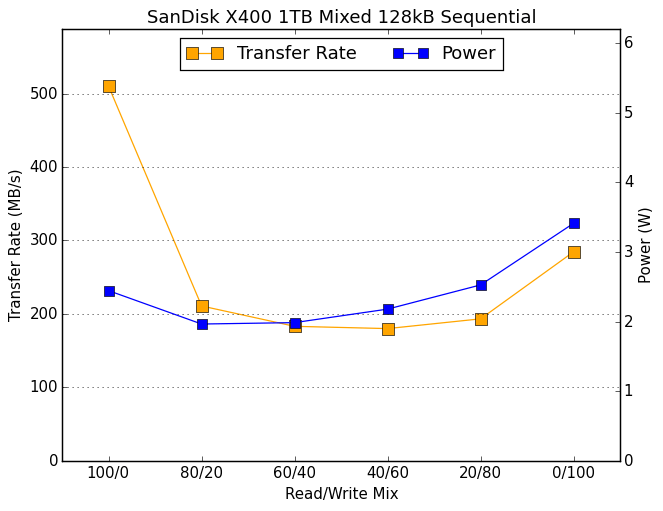
The performance and power curves for the SanDisk X400 are very similar to the SanDisk Extreme Pro except in the pure-write phase at the end of the test, where the X400's performance cannot come close to any of the MLC drives. The X400 beats the OCZ Trion 150 overall because its high read speed outweighs the write speed advantage of the Trion 150.


41 Comments
View All Comments
Michael Bay - Saturday, May 7, 2016 - link
There`s 3.1 down there somewhere too.I`d like to have the source on your percentages though.
Madpacket - Wednesday, May 11, 2016 - link
Looks like the 1TB Mushkin Reactor (MKNSSDRE1TB) is still the best value drive to beat. Nice to see TLC drives other than Evo's getting better though.hojnikb - Thursday, June 23, 2016 - link
there is also reactor LT, if you want 512GB.justkar4u - Wednesday, May 11, 2016 - link
@anandtech : Seriously ? You are trying to compare apples to oranges to grapes. You are comparing 3D NAND products with 2D NAND, MLC with TLC type products. Sandisk X400 should be compared with OCZ Trion and Crucial BX series. As you can see X400 is better than Crucial MX in some cases ! Samsung, OCZ vector, crucial MX should not even be there in comparison. With that said, clearly X400 is the winner in TLC segment.nobozos - Thursday, May 12, 2016 - link
It would sure be nice if you could include a graph in some (all?) of your charts that normalizes for cost. Raw performance is nice, but performance/$ is also very useful.Andre74 - Friday, May 27, 2016 - link
What's the deal with referring to "Power" both as W·h, and as W (but commenting on efficiency)?Efficiency would be energy consumed per byte read, for example. Effectiveness could be bytes read per second. Measuring power usage during operation tells you nothing of either efficiency or effectiveness, unless it's calculated as total energy.
BimmerInd - Wednesday, June 1, 2016 - link
"The Reactor is about $25 cheaper but only has a 3-year warranty and less than half the write endurance rating." Is this because of n-cache technique? MLC, TLC factors - Does it not make Mushkin a little better one?Endurance Rating
Mushkin Enhanced Reactor 1TB - 144TB
SanDisk X400 1TB - 320TB
Moreover SanDisk X400 is recommended for OEM unlike Mushkin which is targeted at consumer? Does it make a difference?
hojnikb - Thursday, June 23, 2016 - link
Thats just manufacturer rating. I'm sure unless Mushkin uses the crappiest MLC out there, that it will outlive sandisk x400 in terms of real world endurance.BimmerInd - Friday, June 24, 2016 - link
It says it uses Micron's NAND same as in Crucial's BX100. So which one should I choose?runasroot - Thursday, January 12, 2017 - link
I have a question: I know it states that it is 1024gb but is it a true 1024 or is it like something 960gb? I'm cloning a desktop with clonezilla and I need a 1tb ssd that is larger that 960GB to clone from disk to disk. <a href="https://wander.io">Wander</a>