Voyo V3 Review - A Fanless Intel Atom x7-Z8700 (Cherry Trail) mini-PC
by Ganesh T S on March 1, 2016 8:00 AM EST- Posted in
- Systems
- Intel
- Atom
- Passive Cooling
- Mini-PC
- Cherry Trail
HTPC Credentials
Given the Voyo V3's fanless nature and the presence of Intel HD Graphics, we expect many purchasers to use it as a media playback machine / HTPC. In fact, GearBest markets the Voyo V3 as a media player / mini-PC. It is obvious that we are not looking at a madVR capable machine, but one targeted at the entry-level / average HTPC user or someone looking for a HTPC to put in a second or third room (non-primary HTPC). There are two HTPC aspects that we will explore in this section, one related to network streaming (OTT services), and the other related to local file playback. Prior to that, we have a small sub-section dealing with refresh rate accuracy.
Refresh Rate Accurancy
Starting with Haswell, Intel, AMD and NVIDIA have been on par with respect to display refresh rate accuracy. The most important refresh rate for videophiles is obviously 23.976 Hz (the 23 Hz setting). Bay Trail didn't have problems with this refresh rate, and, as expected, the Cherry Trail-based Voyo V3 has no trouble with refreshing the display appropriately in this setting.

The gallery below presents some of the other refresh rates that we tested out. The first statistic in madVR's OSD indicates the display refresh rate.


Network Streaming Efficiency
Evaluation of OTT playback efficiency was done by playing back our standard YouTube test stream and five minutes from our standard Netflix test title. Using HTML5, the YouTube stream plays back a 1080p H.264 encoding. Since YouTube now defaults to HTML5 for video playback, we have stopped evaluating Adobe Flash acceleration. Note that only NVIDIA exposes GPU and VPU loads separately. Both Intel and AMD bundle the decoder load along with the GPU load. The following two graphs show the power consumption at the wall for playback of the HTML5 stream in Mozilla Firefox (v 44.0.1).
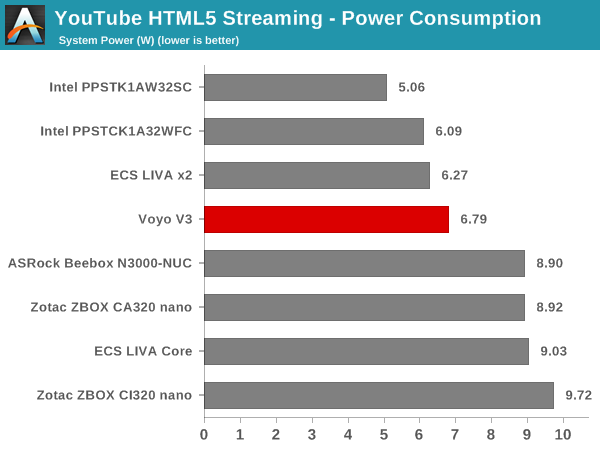
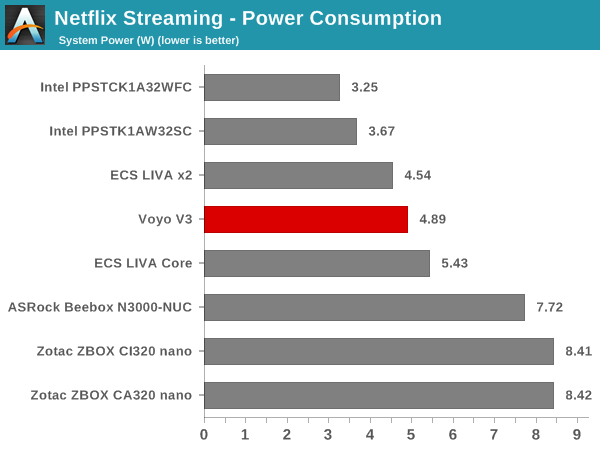
GPU load was around 45.32% for the YouTube HTML5 stream and 5.87% for the steady state 6 Mbps Netflix streaming case.
Netflix streaming evaluation was done using the Windows 10 Netflix app. Manual stream selection is available (Ctrl-Alt-Shift-S) and debug information / statistics can also be viewed (Ctrl-Alt-Shift-D). Statistics collected for the YouTube streaming experiment were also collected here.
Decoding and Rendering Benchmarks
In order to evaluate local file playback, we concentrate on EVR-CP with MPC-HC and Kodi 16.0. We already know that EVR works quite well even with the Intel IGP for our test streams. In our earlier reviews, we focused on presenting the GPU loading and power consumption at the wall in a table (with problematic streams in bold). Starting with the Broadwell NUC review, we decided to represent the GPU load and power consumption in a graph with dual Y-axes. Nine different test streams of 90 seconds each were played back with a gap of 30 seconds between each of them. The characteristics of each stream are annotated at the bottom of the graph. Note that the GPU usage is graphed in red and needs to be considered against the left axis, while the at-wall power consumption is graphed in green and needs to be considered against the right axis.
Frame drops are evident whenever the GPU load consistently stays above the 85 - 90% mark. The Broadwell-class GPU has no problems at all with any of our test streams (up to 4Kp30 H.264)
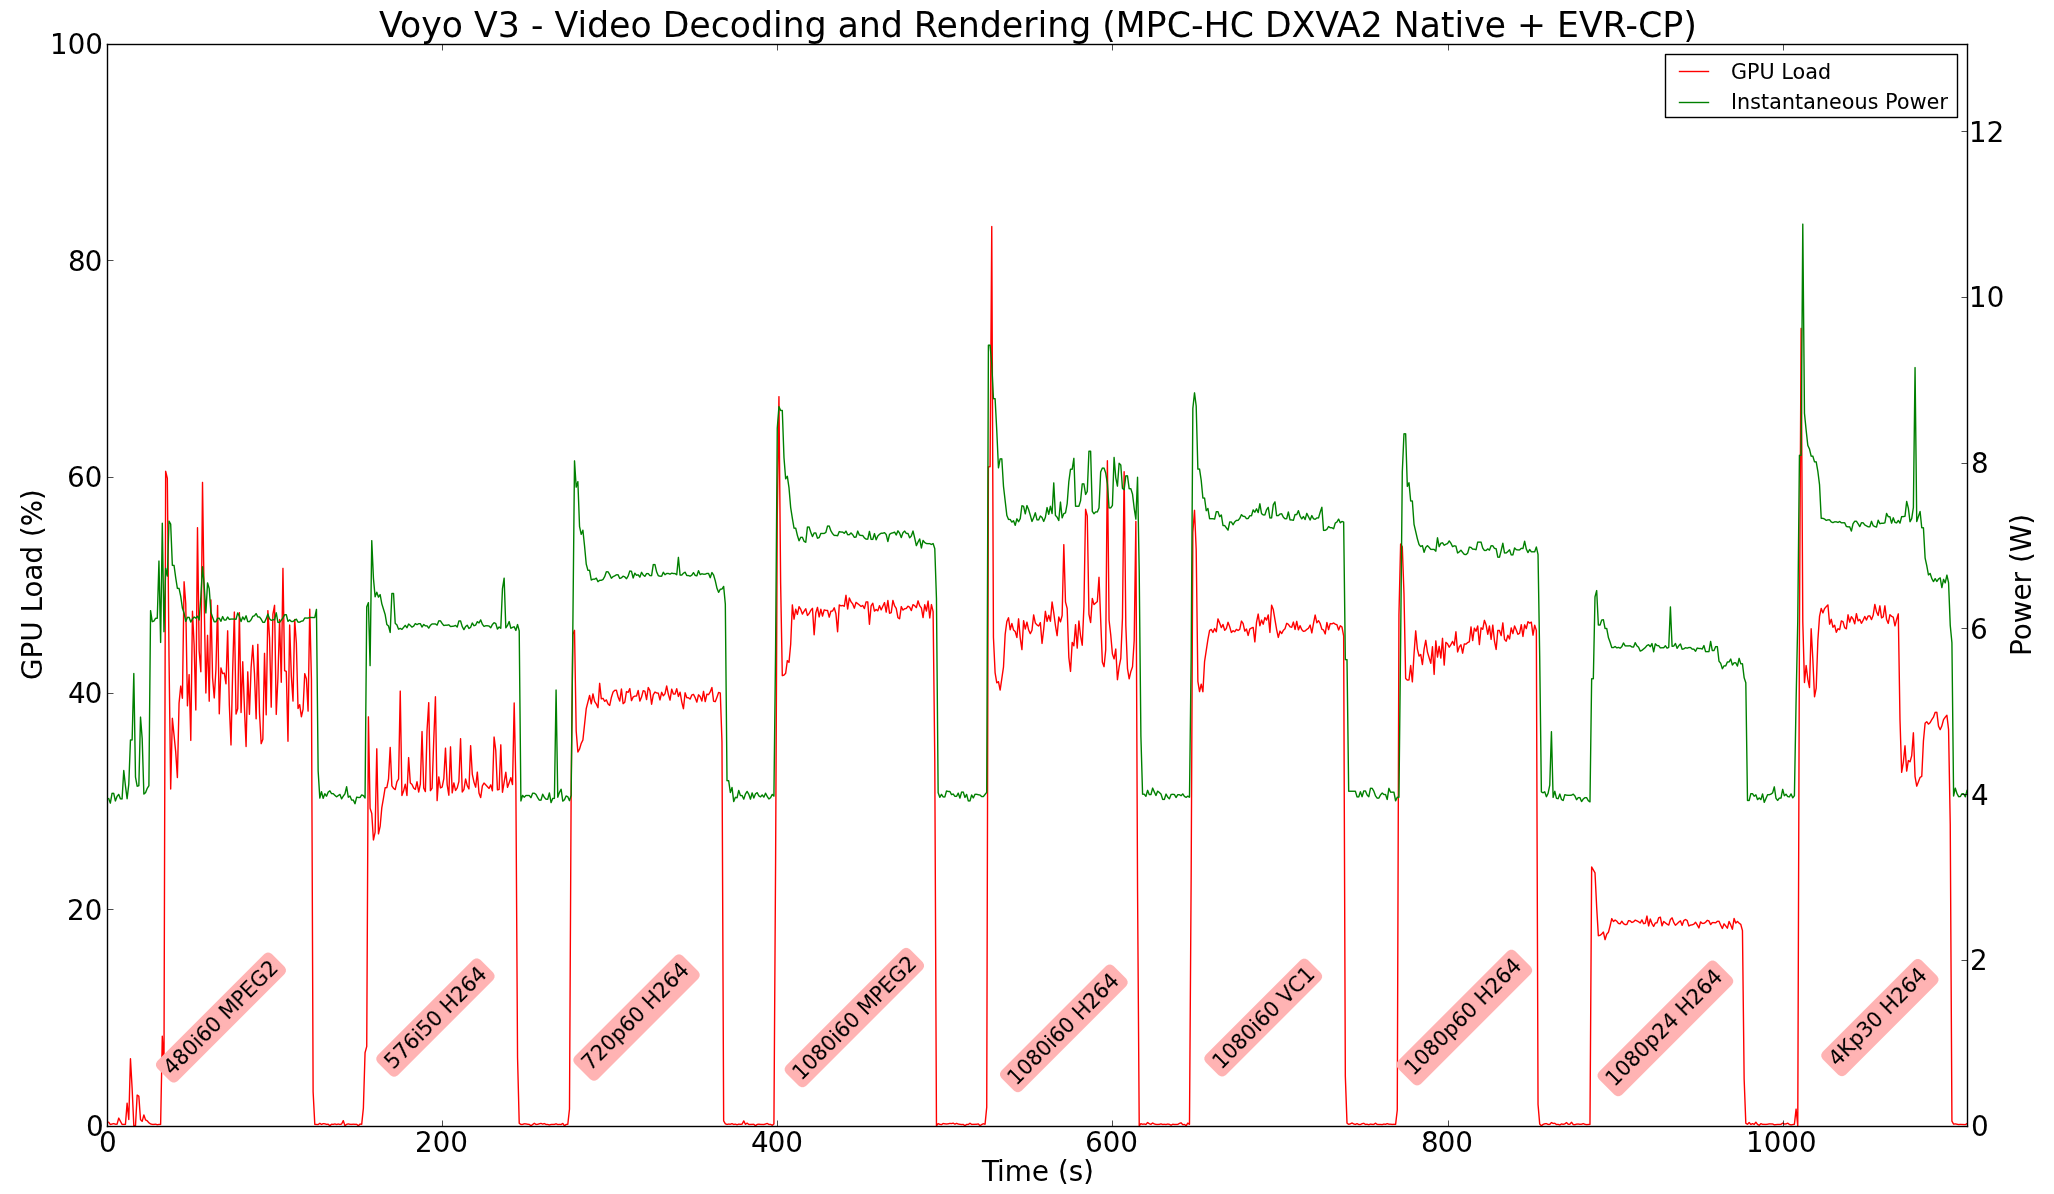
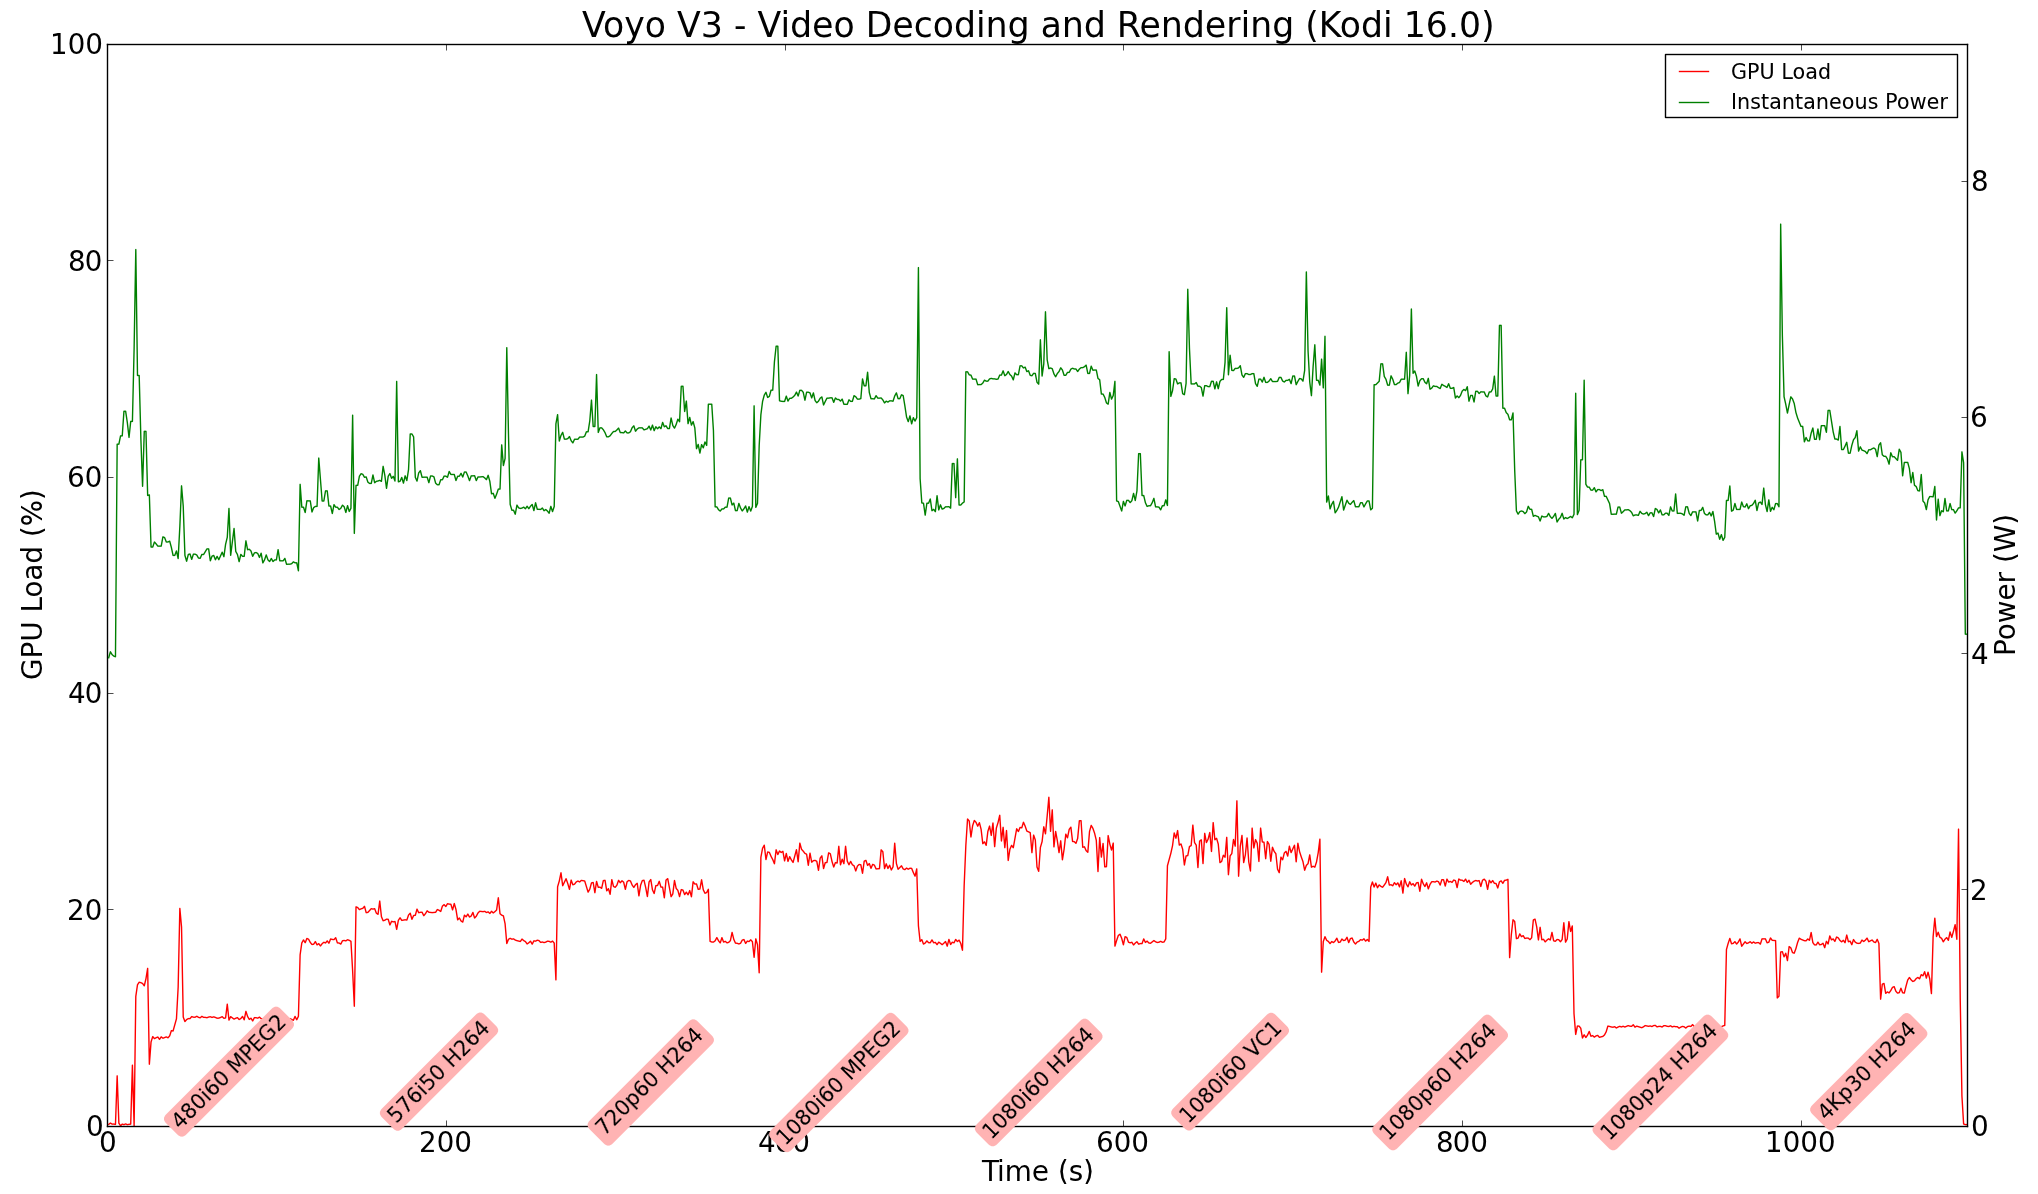
Power consumption at the wall was less than 8W even for the most stressful high frame-rate streams. GPU loading was also reasonable (as measured using GPU-Z)
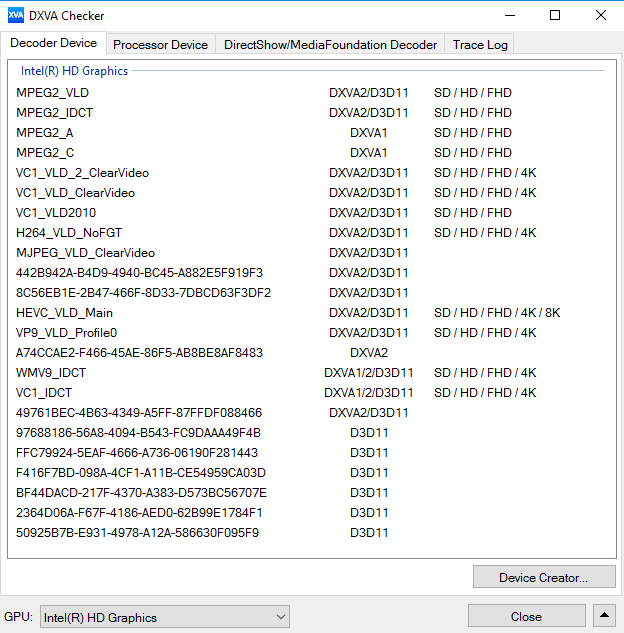
Moving on to the codec support, the Gen8 LP 16 EU-version in the Atom x7-Z8700 is quite similar to that of the Atom x5-Z8300 in the Intel Compute Stick, DXVA Checker serves as a confirmation. The GPU includes decode support for HEVC Main Profile (8b) up to 8K resolution. Unfortunately, without the capability to drive a 4Kp60 display over HDMI, this is not suitable as a 4K HTPC (even though it can drive up to 4Kp30, thanks to the HDMI 1.4b port)


69 Comments
View All Comments
ganeshts - Tuesday, March 1, 2016 - link
As you can see from the thermal stress graphs, the GPU clocks in around 280 MHz for the Furmark stress test. It is always above the base clock claimed by Intel (200 MHz). In any case, the configuration is such that the total power draw by the system at the wall doesn't exceed 10W under any circumstance (obviously, power draw by any connected USB peripherals is excluded).woggs - Tuesday, March 1, 2016 - link
How do you know you didn't get viruses or other spy-ware for a Chinese file sharing site? I've seen this happen on low-end and high-end systems going direct to vendor sites for drivers in some cases, which resulted in attempts to create an encrypted link back to Chinese IP addresses. The description of issues raise lots of red flags.ganeshts - Tuesday, March 1, 2016 - link
I downloaded on to a VM first. Mounted with 'Dism' on the VM and scanned with Windows Defender before moving it to the Voyo V3 / main network.But, yes, Voyo needs to make the drivers available separately.
user_5447 - Tuesday, March 1, 2016 - link
Why iperf (ip perf) is confusingly written as iPerf in Wi-Fi graphs?Shadowmaster625 - Tuesday, March 1, 2016 - link
This bifurcated market remains an insulting joke. You can buy these types of systems for $150 all day long. But simply upgrade the atom into a Core m and all the sudden the price is jacked up by $300? That is so insulting that I wouldnt even contemplate buying either.DanNeely - Tuesday, March 1, 2016 - link
Most of that's down to Intel's pricing. $40 for atom, vs $280 for core M. Implementing a Core M system is more expensive as well, the SoC has 30% more contacts (FCBGA 1515 vs 1170), some of which correspond to extra mobo traces (more expensive PCB). Component wise, you're also looking at 2 channels of ram not 1 for at few more dollars of parts.The OEMs are probably charging slightly higher margins since Core M is branded as a premium product not race to the bottom, and retail margins are generally a percentage of the price not a flat dollar amount; but most of the price difference is down to Intel's pricing. Their holding good mobile CPU prices (ie not their cheap lines: Atom, Pentium, Celeron) at floor of nearly $200 is all about maximizing returns in a portion of the market that they have nearly no effective competition at present. (Hopefully Zen will let AMD compete in CPU performance/watt in the ultrabook processor category soon.)
DanNeely - Tuesday, March 1, 2016 - link
Lastly, Core M is priced at a premium to core i3/5/7 because they're dies that're binned for working decently at extra low power levels, the intermediate level Celeron/Pentium lines are much cheaper because they're a dumping ground for duds.dsraa - Tuesday, March 1, 2016 - link
$359 on the 'advertised' amazon link.....pffft. Ain't buying it from there almost 2x as much.....yuck.ganeshts - Tuesday, March 1, 2016 - link
You can always use the Gearbest link that is in the final page (just prior to the Amazon link) which reflects the true value / non-inflated cost of the system - around $200.jimbo2779 - Thursday, March 3, 2016 - link
I would never deal with gearbest. Do your research on them, they are terrible, absolutely awful.Their trustpilot reviews are faked so look elsewhere and you get an idea of the type of company they are.