The ASRock X99 Extreme11 Review: Eighteen SATA Ports with Haswell-E
by Ian Cutress on March 11, 2015 8:00 AM EST- Posted in
- Motherboards
- Storage
- ASRock
- X99
- LGA2011-3
System Performance
Power Consumption
Power consumption was tested on the system while in a single MSI GTX 770 Lightning GPU configuration with a wall meter connected to the OCZ 1250W power supply. This power supply is Gold rated, and as I am in the UK on a 230-240 V supply, leads to ~75% efficiency > 50W, and 90%+ efficiency at 250W, suitable for both idle and multi-GPU loading. This method of power reading allows us to compare the power management of the UEFI and the board to supply components with power under load, and includes typical PSU losses due to efficiency. These are the real world values that consumers may expect from a typical system (minus the monitor) using this motherboard.
While this method for power measurement may not be ideal, and you feel these numbers are not representative due to the high wattage power supply being used (we use the same PSU to remain consistent over a series of reviews, and the fact that some boards on our test bed get tested with three or four high powered GPUs), the important point to take away is the relationship between the numbers. These boards are all under the same conditions, and thus the differences between them should be easy to spot.
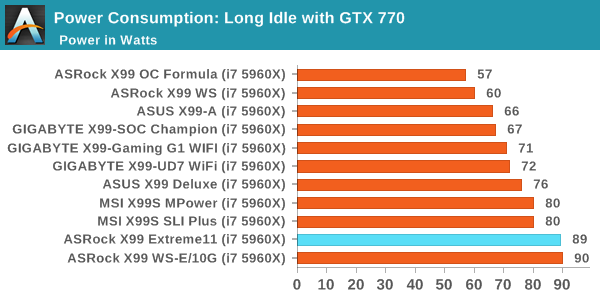
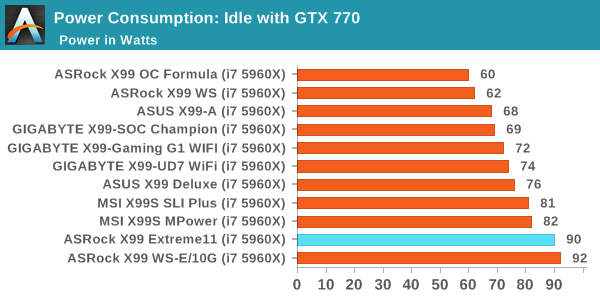
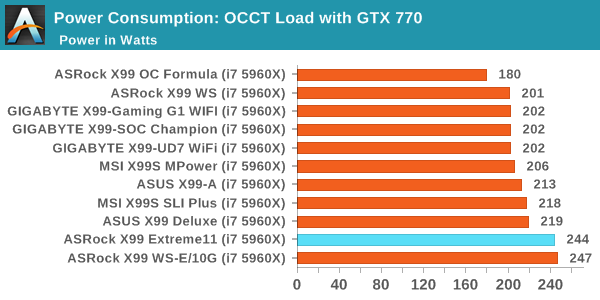
With the added PLX switches and LSI RAID controller, the Extreme11 was from the outset not going to be overly great when it came to power consumption. The same conclusions came from the ASRock X99 WS-E/10G with its power hungry 10G chip, and as a result these boards match each other both at idle and CPU load.
Windows 7 POST Time
Different motherboards have different POST sequences before an operating system is initialized. A lot of this is dependent on the board itself, and POST boot time is determined by the controllers on board (and the sequence of how those extras are organized). As part of our testing, we look at the POST Boot Time using a stopwatch. This is the time from pressing the ON button on the computer to when Windows 7 starts loading. (We discount Windows loading as it is highly variable given Windows specific features.)
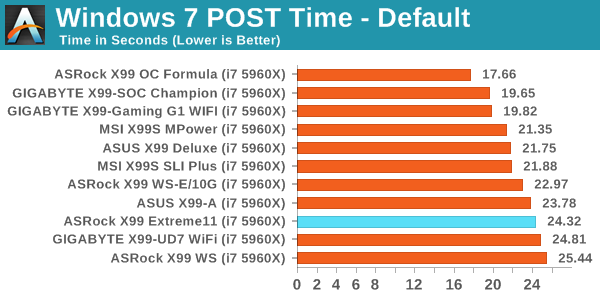
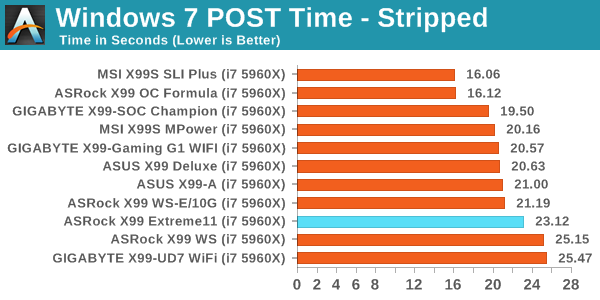
The extra controllers cause a small bump in POST time, with the final result being near the bottom of our testing results.
Rightmark Audio Analyzer 6.2.5
Rightmark:AA indicates how well the sound system is built and isolated from electrical interference (either internally or externally). For this test we connect the Line Out to the Line In using a short six inch 3.5mm to 3.5mm high-quality jack, turn the OS speaker volume to 100%, and run the Rightmark default test suite at 192 kHz, 24-bit. The OS is tuned to 192 kHz/24-bit input and output, and the Line-In volume is adjusted until we have the best RMAA value in the mini-pretest. We look specifically at the Dynamic Range of the audio codec used on board, as well as the Total Harmonic Distortion + Noise.
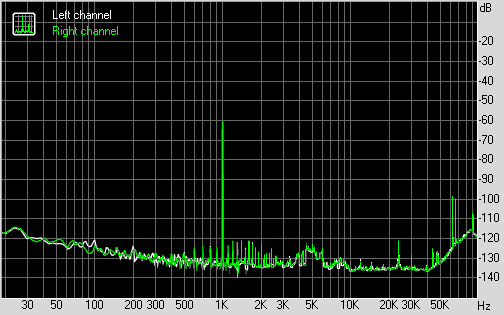
Dynamic Range of X99 Extreme11 at 100% volume
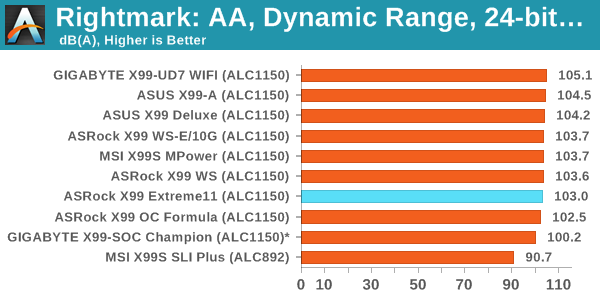
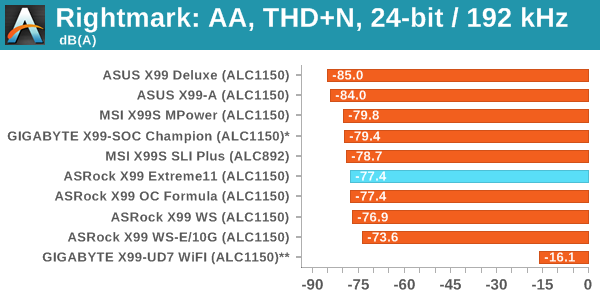
The Extreme11 results match what we have seen before on other ASRock X99 boards with Realtek ALC1150 audio codecs – around 103 dB for dynamic range and above -78 dB for THD+N.
USB Backup
For this benchmark, we transfer a set size of files from the SSD to the USB drive using DiskBench, which monitors the time taken to transfer. The files transferred are a 1.52 GB set of 2867 files across 320 folders – 95% of these files are small typical website files, and the rest (90% of the size) are small 30 second HD videos. In an update to pre-Z87 testing, we also run MaxCPU to load up one of the threads during the test which improves general performance up to 15% by causing all the internal pathways to run at full speed.
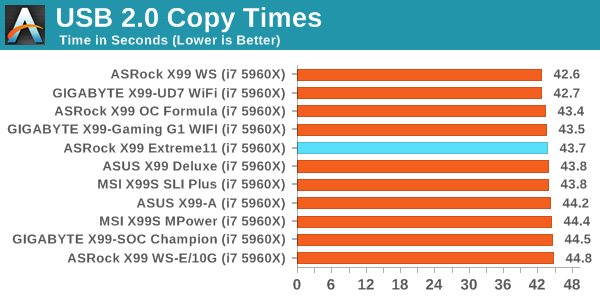
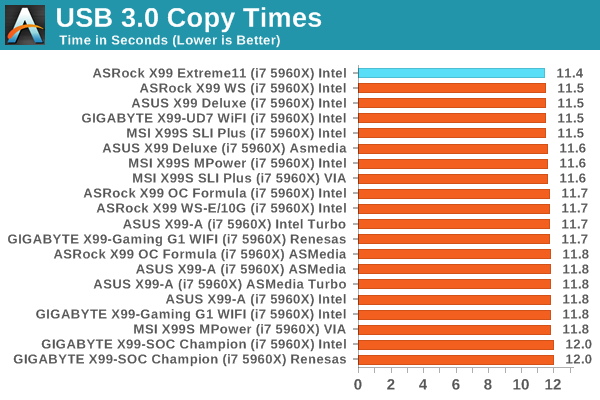
USB 2.0 performance is somewhat middling, but USB 3.0 performance on the PCH is some of the best we have seen.
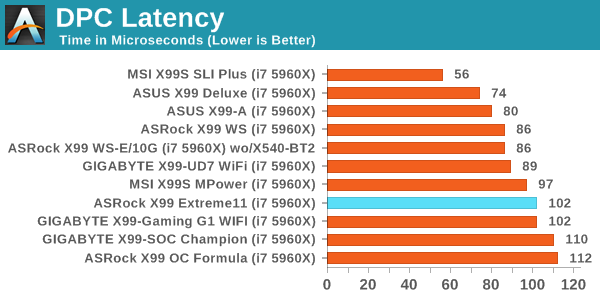
DPC Latency
Deferred Procedure Call latency is a way in which Windows handles interrupt servicing. In order to wait for a processor to acknowledge the request, the system will queue all interrupt requests by priority. Critical interrupts will be handled as soon as possible, whereas lesser priority requests such as audio will be further down the line. If the audio device requires data, it will have to wait until the request is processed before the buffer is filled.
If the device drivers of higher priority components in a system are poorly implemented, this can cause delays in request scheduling and process time. This can lead to an empty audio buffer and characteristic audible pauses, pops and clicks. The DPC latency checker measures how much time is taken processing DPCs from driver invocation. The lower the value will result in better audio transfer at smaller buffer sizes. Results are measured in microseconds.
LSI 3008 Performance
Unlike our X79 Extreme11 review, I unfortunately did not have a series of SSDs on hand to test in a similar manner. Nevertheless, the implementation for the X99 version is the same as the X79, and to recap our X79 Extreme11 results gives the following for peak sequential read speeds. The legend gives our X79 setup in terms of SATA 6 Gbps ports + SATA 3 Gbps ports (thus 2+0 gives a RAID-0 array of two SATA 6 Gbps ports), with the final eight being solely populated on the LSI controller.
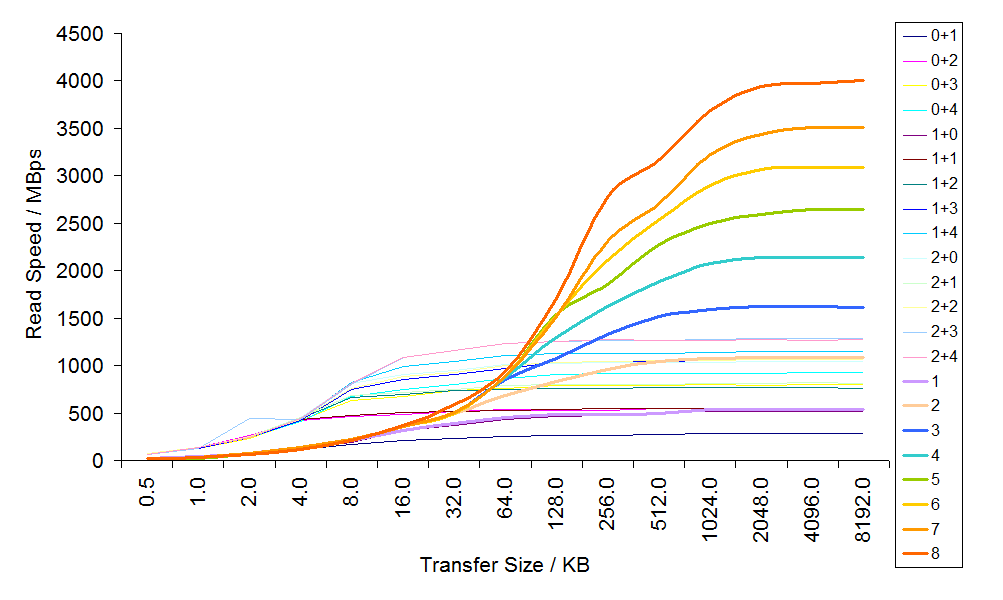
This in order to match the best PCH performance in this setup, it required three drives in RAID-0 on the LSI ports. Similar results can be extrapolated for X99 whereby six of the 10 SATA ports on the PCH are capable of RAID, and a similar number on the LSI would be needed to match it. Unfortunately any RAID array that crosses both the PCH and the LSI ports needs to be from software.


58 Comments
View All Comments
duploxxx - Wednesday, March 11, 2015 - link
board to differentiate with 18 ports, but anandtech does not test the performance of each type of port. then why bother posting this review? waste of time, for the rest this is just another board out of the 101Gnarr - Wednesday, March 11, 2015 - link
I have to agree with duploxxx. This board seriously needs a storage benchmark.petar_b - Friday, January 29, 2016 - link
no, board doesn't need storage benchmark, you lack some experience with SAS.dicobalt - Wednesday, March 11, 2015 - link
This board is for people who play games and happen to have a buttload of porn. Don't act like it's for anything else.niva - Tuesday, March 17, 2015 - link
This is exactly why we are extremely interested in this board. Is there a problem?petar_b - Friday, January 29, 2016 - link
Get at a TV and watch porn there; you can't afford this mobo anyway.austinsguitar - Thursday, March 12, 2015 - link
I will side with you duploxx... there is no reason to buy this board except to get those sata ports.... why in the HELL is this without that kind of test... anandtech.... what are you doin...Tchamber - Friday, March 13, 2015 - link
Yeah, that's much too harsh. Any one who has followed SSD/SATA on this site for the last three or so years knows that SATA is already saturated. There's no longer any reason to test a board's storage performance.abufrejoval - Thursday, March 12, 2015 - link
I believe that’s a little harsh!With the information you have been provided on this site, you can use your own powers of deduction to come up with answers.
To expect that Ian go through all the potential permutations and variants is a little much, especially when the technical limitations are clear and testing software RAIDs is beyond the scope of the article.
With everything south of the DMI passing through the equivalent of 4 PCIe 2.0 or lanes or 16Gbit/s of bandwidth, you can deduce that 10x 6Gbit SATA ports won't deliver 60Gbit/s to the CPU, especially with network, USB and all other peripheral traffic hanging in there as well.
So if you hang SSDs on all these PCH ports, that's because you like them quiet or with fast access times, not because you expect their aggregate bandwidth to arrive at the CPU.
Beyond the limits of the DMI I doubt you'll see any significant bottleneck inside the PCH so you can do your math: Any single 6Gbit SATA drive capable of delivering 6Gbit of data will very likely have that data actually arrive at that speed at the CPU. Any combination of SATA drives on the PCH will be bandwidth constrained at 16Gbit.
The Avago/LSI 3008 at 8x PCIe 3.0 (63Gbit/s) has a pretty good chance to deliver top 8-port SATA (48Gbit/s) performance without creating much of a bottleneck, while 8x12GBit SAS (96Gbit/s) would potentially fail to deliver with that chip. On the other hand LSI chips typically deliver top performance, that is very close to the theoretical maximum the connections allow, even with RAID5 and RAID6 on the chip.
So there you go: The Avago/LSI SAS HBA has a very good chance of delivering the aggregate bandwidth you expect even if loaded with top notch SSDs, while the 10Port PCH is most likely better used with spinning rust.
wyewye - Friday, March 13, 2015 - link
Abufrejoval, that's not a review, that's a butt-load of theoretical assumptions. Assumptions are the mother of fuckups. In practice you may discover different numbers, hence we read reviews online before buying.Stop apologizing for Ian's incompetence/lazyness!